Purpose
To study patients diagnosed with retinal angiomatous proliferation (RAP) based on conventional imaging techniques with phase-resolved Doppler optical coherence tomography (OCT) to detect and localize blood flow in RAP lesions; and to compare these findings to conventional imaging, which are mostly invasive and give limited information concerning intra- and transretinal blood flow.
Design
Single-center, consecutive observational case series.
Methods
Twelve treatment-naïve patients diagnosed with RAP based on fundus examination, fluorescein angiography, and indocyanine green angiography were included. Median age was 79 years (range 65–90). Patients were imaged with an experimental 1040 nm swept-source phase-resolved Doppler OCT instrument. Abnormal flow was defined as intraretinal neovascularization or retinal choroidal anastomosis.
Results
In 11 patients adequate phase-resolved Doppler OCT images were obtained showing abnormal blood flow in the RAP lesion. In 4 patients a retinal choroidal anastomosis was found, 3 patients showed intraretinal neovascularization connected with a pigment epithelial detachment, 2 patients showed only intraretinal neovascularization, and in 2 patients flow was limited to the subretinal or sub–retinal pigment epithelial space.
Conclusions
Phase-resolved Doppler OCT is able to detect and localize abnormal blood flow within RAP lesions. Blood flow was mostly confined to the intraretinal structures with or without a connecting pigment epithelial detachment; in one-third of patients a retinal choroidal anastomosis was detected. The potential of angiography with phase-resolved Doppler OCT to accurately distinguish between normal and pathologic blood flow in addition to structural OCT data without invasive procedures will help to further elucidate both retinal and choroidal vascular pathologies like RAP.
Retinal angiomatous proliferation (RAP) is a distinct form of exudative age-related macular degeneration (ARMD). In their original reports, Slakter and associates and Yannuzzi and associates hypothesized that RAP was an intraretinal neovascular process that in a later stage extended to the subretinal space, eventually progressing into a retinal choroidal anastomosis. Later, Yannuzzi and associates proposed that there might be at least 3 different vasogenic processes involved in the development of RAP lesions, stating that RAP can originate intraretinally, from the choroid, or from both simultaneously.
It is estimated that RAP constitutes approximately 10%–15% of newly diagnosed neovascular ARMD in white subjects, whereas in Asian populations the incidence rate is significantly lower. In unilateral RAP it has been reported that there is an accumulative annual risk to develop RAP in the other eye that is considerably higher than for any other type of neovascular ARMD. RAP lesions are reported in up to 60% of fellow eyes in 3 years. Diagnosing RAP-type ARMD is clinically important, because, although there is no definite consensus on the best treatment modality for RAP, standard anti–vascular endothelial growth factor (VEGF) monotherapy tends to show persistent activity of the RAP lesion. Combination treatment of photodynamic therapy with either triamcinolone or anti-VEGF seems to offer better results, but to date only relatively small comparative trials have been performed.
The diagnosis of RAP is currently based on a triad of evidence: fundus examination, fluorescein angiography, and indocyanine green angiography. A telltale sign for RAP on fundus examination is the presence of a single or multiple small intraretinal hemorrhages overlying a retinal vessel. RAP lesions are difficult to distinguish from classic or occult choroidal neovascularization (CNV) on fluorescein angiography. Early stages of RAP can be misinterpreted as classic CNV and later stages of RAP exhibit almost identical signs of occult CNV. Indocyanine green angiography is considered the standard diagnostic tool for an accurate diagnosis. The hallmark sign of RAP on indocyanine green angiography is a mid- to late-phase hot spot, which corresponds to an intraretinal neovascularization (IRN) or a retinal choroidal anastomosis. Therefore the presence of intraretinal hemorrhage(s), a suspicion of classic or occult CNV on fluorescein angiography, and a hot spot on indocyanine green angiography are evidence to claim the diagnosis of RAP. However, many general ophthalmologists do not have regular access to indocyanine green angiography, and may therefore misclassify an RAP lesion as another, more common type of CNV.
In the last decade, spectral-domain optical coherence tomography (OCT) has become irreplaceable in the management of ARMD, though it takes a fairly experienced OCT interpreter to distinguish RAP from other CNV types. Furthermore, it is difficult to visualize the intraretinal process using conventional OCT and impossible to evaluate the transretinal blood flow, which seems vital for the diagnosis of RAP. In short, RAP lesions cannot reliably be diagnosed without invasive angiography, and indocyanine green angiography is of the essence for an accurate diagnosis.
OCT angiography is a new field of imaging of the retinal vasculature and is aimed at discriminating blood vessels from static tissue in a noninvasive and depth-resolved manner. Different approaches for OCT angiography of the retinal vasculature have been proposed by analyzing phase changes or intensity changes in the OCT signal that are caused by moving light-scattering particles. Both approaches are capable of providing detailed maps of retinal and choroidal vascular beds. However, in contrast to intensity-based OCT angiography, phase-based OCT angiography is also suited for measuring flow velocities and directions. The use of OCT angiography has recently been demonstrated in polypoidal choroidal vasculopathy and exudative macular diseases. By providing noninvasive and depth-resolved information about retinal perfusion, OCT angiography is a promising tool in complementing routine conventional imaging.
Our group has developed a phase-stabilized 1040 nm swept-source OCT system with phase-resolved Doppler OCT modality. With this device, we have demonstrated the detection of tissue reperfusion in a free retinal pigment epithelial–choroid graft after transplantation. The phase-resolved Doppler OCT technique used in the current study is based on inter-B-scan comparison of phase changes, which considerably improves flow contrasting down to the capillary level. Patients diagnosed with RAP based on conventional techniques were evaluated with this phase-resolved OCT system to detect and localize abnormal blood flow in the region of the RAP lesion.
Methods
Between March 1, 2013 and September 30, 2013, consecutive treatment-naïve patients diagnosed with an RAP lesion in 1 eye were included in this single-center observational case series. The study was approved by the local internal review board of the Rotterdam Eye Hospital and the Medical Ethical Committee of the Erasmus University Hospital (Rotterdam, Netherlands). All patients provided written informed consent for the use of the noncommercially available phase-resolved Doppler OCT device.
All patients underwent a complete ophthalmologic examination including slit-lamp biomicroscopy, Snellen visual acuity (converted to logMAR for statistical analysis), conventional spectral-domain OCT, fundus photography, and fluorescein and indocyanine green angiography. Patients were included in this study if they were aged 65 years or older and had no other active ocular diseases affecting the macula. The diagnosis of RAP was based on a combination of the presence of small intraretinal hemorrhages on fundus examination, the appearance of choroidal neovascularization seen on fluorescein angiography, and/or a hyperfluorescent mid- to end-phase hot spot on indocyanine green angiography. Fluorescein and indocyanine green angiographic images were reviewed for confirmation of the RAP diagnosis by 2 independent ophthalmologists (T.M. and J.M.); in case of disagreement, consensus was obtained through side-by-side discussion.
Patients were imaged using a previously developed optical frequency domain imaging system with a phase-resolved Doppler OCT modality. The instrument is based on a swept-source laser (Axsun Technologies Inc, Billerica, Massachusetts, USA) with a central wavelength of 1040 nm operating at a 100 kHz A-scan rate. The axial resolution was measured to be 6.5 μm in air (4.8 μm in tissue) and the lateral resolution was 25.2 μm. Elaborate technical details of this optical frequency domain imaging instrument were described previously by Braaf and associates.
In phase-resolved Doppler OCT, blood flow is detected noninvasively from phase changes in the OCT signal caused by moving particles in the retina, especially the erythrocytes and leukocytes in blood vessels. In conventional phase-resolved OCT, phase changes are detected comparing successive A-scans. In high-speed OCT this results in a short time interval between repeated A-scans, which is insufficient to detect low flow velocities in small vessels. Inter-B-scan Doppler OCT was therefore used, comparing B-scans instead of successive A-scans to increase the time interval between repeated A-scans and improve flow sensitivity. A backstitched-B-scan protocol was used in which 4 small repeated B-scans were stitched together to form a complete backstitched B-scan. The inter-B-scan time interval was set to 2.5 ms (250 A-scans), which was found to be effective to detect flow velocities of less than 1 mm/s, which is proven to be sufficient to image the retinal capillaries. The phase-resolved Doppler OCT protocol used in this study measured a 3-dimensional data volume consisting of 300 single backstitched B-scans with 2000 A-scans/B-scan over a retinal square area of 3.0 × 3.0 mm and has an acquisition time of 6 seconds per volume. The sample arm power was 1.7 mW on the cornea and measured before every patient examination. The used power is safe according to the American National Standards Institute laser safety standards.
The phase-resolved Doppler OCT scan grid is indicated with a white dashed square on each fundus photograph ( Figures 1–4 , Column 1). Fluorescein and indocyanine green angiographic images were resized to the area of the phase-resolved Doppler OCT scan ( Figures 1–4 , Columns 2 and 3, respectively). Phase-resolved Doppler OCT measurements were processed to Doppler en face images ( Figures 1–4 , Column 4) and cross-sectional Doppler tomograms ( Figures 1–4 , Column 5). B-scans with significant eye motion artefacts were manually removed in the Doppler en face images to facilitate interpretation and comparison with conventional imaging. Discontinuities in the flow displayed on the Doppler en face images were attributed to these eye motion artifacts. The location of the Doppler tomogram is indicated with a red dashed line in the Doppler en face image. The Doppler inter-B-scan phase differences (red) were projected over structural B-scans (gray scale) in the Doppler tomograms.
Results
Twelve patients were included in this study based on fundus examination and fluorescein and indocyanine green angiography. The median age of the patients was 79 years (range 65–90), and the median visual acuity at time of diagnosis was 0.57 logMAR (range 0.14–1.3 logMAR). Phase-resolved Doppler OCT imaging was of very poor quality in 1 patient, owing to inability to fixate for a prolonged time, making Doppler analysis unreliable. Eleven patients were evaluated in the final analysis; baseline characteristics and examination outcomes are reported in the Table .
| Patient # | Sex (M/F) | Age (y) | RAP Eye | VA | SD OCT | FE | FA | ICG | PRD OCT | Fellow Eye | ||
|---|---|---|---|---|---|---|---|---|---|---|---|---|
| (logMAR) | IRF | SRF | PED | IRH | CNV | Hot Spot | Abnormal Flow | |||||
| 1 | F | 82 | OD | 0.7 | + | + | − | + | + | + | RCA | Dry ARMD |
| 2 | F | 75 | OS | 0.72 | + | + | + | + | + | + | IRNP | Dry ARMD |
| 3 | M | 73 | OD | 0.24 | − | + | − | + | + | + | AVN, subretinal | Neovascular ARMD |
| 4 | M | 67 | OD | 0.14 | − | + | − | − | + | + | AVN, sub-RPE | Dry ARMD |
| 5 | M | 82 | OD | 0.8 | + | + | − | + | + | + | IRN | Neovascular ARMD |
| 6 | M | 79 | OD | 0.14 | + | + | − | + | + | + | n/a | Neovascular ARMD |
| 7 | M | 90 | OD | 1.28 | + | − | − | + | + | − | RCA | Neovascular glaucoma |
| 8 | M | 65 | OS | 0.32 | + | + | − | + | + | + | RCA | Dry ARMD |
| 9 | F | 79 | OS | 0.7 | + | − | + | + | + | + | RCA | Dry ARMD |
| 10 | M | 78 | OD | 0.44 | + | − | + | + | + | + | IRNP | Dry ARMD |
| 11 | M | 90 | OS | 1.3 | + | + | + | + | + | + | IRNP | Dry ARMD |
| 12 | F | 89 | OD | 0.44 | + | − | − | + | + | + | IRN | Dry ARMD |
In 10 out of 11 patients focal intraretinal hemorrhages were seen on fundus examination, suggestive of an RAP lesion. All patients showed characteristics of RAP, with either classic- or occult-type lesions on fluorescein angiography, and in 10 out of 11 patients a mid- to end-phase hyperfluorescent hot spot was seen on indocyanine green angiography.
In 9 out of 11 patients we found abnormal intraretinal blood flow on phase-resolved Doppler OCT. In 3 patients this was found to be connected to sub–retinal pigment epithelial blood flow in a pigment epithelial detachment and in 4 patients it was connected to the choroid, considered to be a retinal choroidal anastomosis. In 2 out of 11 patients flow was limited to the subretinal or sub–retinal pigment epithelial space. Below, the imaging in all 11 patients is described in more detail.
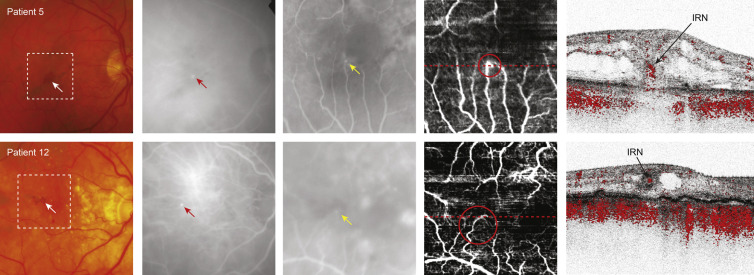
In 2 patients (Patients 5 and 12) abnormal intraretinal blood flow was detected by phase-resolved Doppler OCT in the absence of a clear retinal choroidal anastomosis ( Figure 1 ). In both patients a small intraretinal hemorrhage was seen on fundus examination ( Figure 1 , Column 1) and a hyperfluorescent hot spot on late-phase indocyanine green angiography at the same location ( Figure 1 , Column 2). Poorly defined hyperfluorescent areas were found on early-phase fluorescein angiography near the foveal avascular zone in both patients ( Figure 1 , Column 3).
The Doppler en face image of Patient 5 showed enhanced blood flow at the ending of a capillary at the margin of the foveal avascular zone ( Figure 1 , Column 4, top row; red circle). The Doppler tomogram clearly reveals the depth-resolved location of an IRN, by showing abnormal intraretinal blood flow ( Figure 1 , Column 5, top row). A connection of this intraretinal blood flow to the choroid was not detected ( Supplementary Video 1 , available at AJO.com ).
The Doppler en face image of Patient 12 depicted a tortuous capillary near the foveal avascular zone ( Figure 1 , Column 4, bottom row; red circle). The Doppler tomogram ( Figure 1 , Column 5, bottom row) through the ending of this capillary confirmed abnormal blood flow confined to the intraretinal structures, considered to be an IRN.
The location of abnormal intraretinal blood flow seen on phase-resolved Doppler OCT corresponded to the location of the small intraretinal hemorrhage(s) seen on fundus examination, as well as to the hyperfluorescent hot spot on late-phase indocyanine green angiography and the hyperfluorescent areas indicated on early fluorescein angiography.
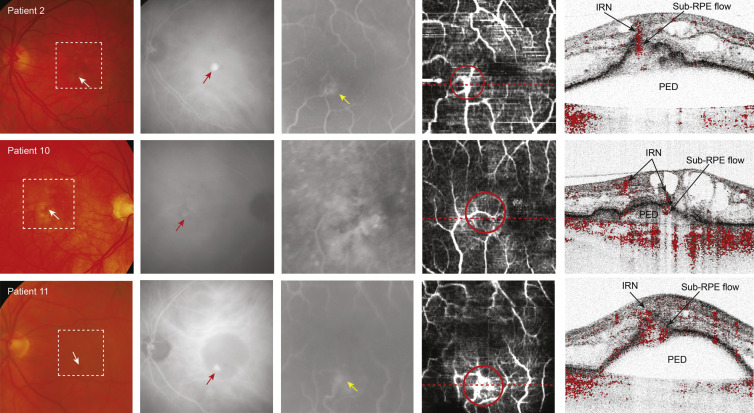
In 3 patients (Patients 2, 10, and 11) the phase-resolved Doppler OCT images detected abnormal intraretinal blood flow connected to sub–retinal pigment epithelial blood flow in a pigment epithelial detachment ( Figure 2 ). Intraretinal hemorrhages were seen on fundus examination in all patients ( Figure 2 , Column 1) and were consistent with the location of the hyperfluorescent hot spot depicted on late-phase indocyanine green angiography ( Figure 2 , Column 2). In Patient 11 the hyperfluorescent hot spot on indocyanine green angiography was found at the border of a pigment epithelial detachment ( Figure 2 , Column 2, bottom row). Early fluorescein angiography showed hyperfluorescent vascular networks in Patients 2 and 11 ( Figure 2 , Column 3, top row and bottom row) and increasing leakage in the late-phase fluorescein angiography in all 3 patients (data not shown).
The Doppler en face image of Patient 2 showed 2 connecting vessels in an area of enhanced blood flow at the border of the foveal avascular zone ( Figure 2 , Column 4, top row; red circle). The Doppler tomogram clearly revealed the depth-resolved information locating abnormal blood flow in the retina (IRN) and in the sub–retinal pigment epithelial space ( Figure 2 , Column 5, top row).
The Doppler en face image of Patient 10 depicted an abnormally curved vessel near the fovea ( Figure 2 , Column 4, middle row; red circle). The Doppler tomogram ( Figure 2 , Column 5, middle row) demonstrates dissecting this vessel twice at different depth locations (indicated by “IRN” in the figure) and it showed it could be traced from the inner retinal layers to the area under the detached retinal pigment epithelium.
On the Doppler en face image of Patient 11 an abnormal vascular network was seen ( Figure 2 , Column 4, bottom row; red circle). The Doppler tomogram showed an area of abnormal blood flow in the retina continuous to the sub–retinal pigment epithelial region, just at the top of the pigment epithelial detachment ( Figure 2 , Column 5, bottom row), without any vessels in the pigment epithelial detachment or along the retinal pigment epithelium connecting to the choroid ( Supplementary Video 2 , available at AJO.com ).
In all 3 patients the consecutive cross-sectional phase-resolved Doppler OCT tomograms showed signs of transretinal flow; however, that flow could not be followed to the choroid on consecutive cross-sectional phase-resolved Doppler OCT tomograms. Therefore blood flow is considered confined to the retina alone. There was a direct correlation with the location of the IRN on phase-resolved Doppler OCT tomogram and the location of the small intraretinal hemorrhages seen on fundus examination and with the hyperfluorescent hot spots on late-phase indocyanine green angiography in all patients.
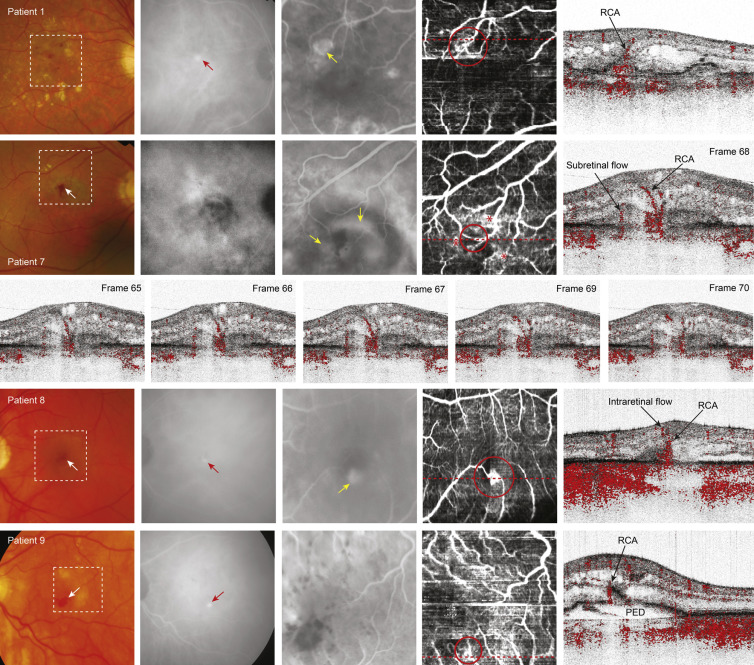
In 4 patients (Patients 1, 7, 8, and 9) transretinal blood flow was detected with phase-resolved Doppler OCT, traceable from an intraretinal location to the choroid in consecutive frames, considered to be a retinal choroidal anastomosis ( Figure 3 ). In all 4 patients intraretinal hemorrhages were seen on fundus examination ( Figure 3 , Column 1), which corresponded to the location of the hyperfluorescent hot spots found on late-phase indocyanine green angiography ( Figure 3 , Column 2) in Patients 1, 8, and 9. Indocyanine green angiography did not reveal a hot spot in Patient 7, although the hemorrhage seen on fundus examination was suggestive for RAP. Early fluorescein angiography showed abnormal hyperfluorescent vascular networks in Patients 1, 7, and 8 ( Figure 3 , Column 3) with increasing leakage in the late phase (not shown).
On the Doppler en face image of Patient 1 a mesh-like vascular network is shown extending to the margin of the foveal avascular zone ( Figure 3 , Column 4, top row; red circle). On the Doppler tomogram an intraretinal vessel connects to blood flow detected in the sub–retinal pigment epithelial space (indicated as “RCA” in Figure 3 , Column 5, top row).
The Doppler en face image of Patient 7 depicted 2 vessels ( Figure 3 , Column 4, second row; red circle) extending to region of the hemorrhage seen on fundus examination ( Figure 3 , Column 1, second row). These vessels were surrounded by several abnormal vascular networks ( Figure 3 , Column 4, second row; red asterisks). The Doppler tomogram ( Figure 3 , Column 5, second row) demonstrated the cross-sectional representation of transretinal blood flow (retinal choroidal anastomosis) and flow extending from or to the choroid. Figure 3 (third row) shows a sequence of consecutive frames through the retinal choroidal anastomosis illustrating the progression of the blood flow detectable from its intraretinal location to the sub–retinal pigment epithelial space ( Supplementary Video 3A and B , available at AJO.com ).
The Doppler en face image of Patient 8 showed 2 vessels connecting to an area of blood flow located in the foveal avascular zone ( Figure 3 , Column 4, fourth row; red circle). The Doppler tomogram showed subretinal blood flow connecting to an intraretinal vessel, considered a retinal choroidal anastomosis ( Figure 3 , Column 5, fourth row).
The Doppler en face image of Patient 9 depicted a vascular network ( Figure 3 , Column 4, bottom row; red circle) near the foveal avascular zone. On the Doppler tomogram a vessel is displayed in the area of a local break in the retinal pigment epithelium, on top of the pigment epithelial detachment (indicated as “RCA” in Figure 3 , Column 5, bottom row). In the surrounding frames it becomes visible that this vessel forms an anastomosis with vessels located within the pigment epithelial detachment and with intraretinal vessels ( Supplementary Video 4 , available at AJO.com ).
The location of the retinal choroidal anastomosis seen on phase-resolved Doppler OCT was consistent with the location of the intraretinal hemorrhages seen on fundus examination in all patients, and also with the late-phase hot spots on indocyanine green angiography in Patients 1, 8, and 9 and the early hyperfluorescent vascular networks seen on fluorescein angiography in Patients 1, 7, and 8.
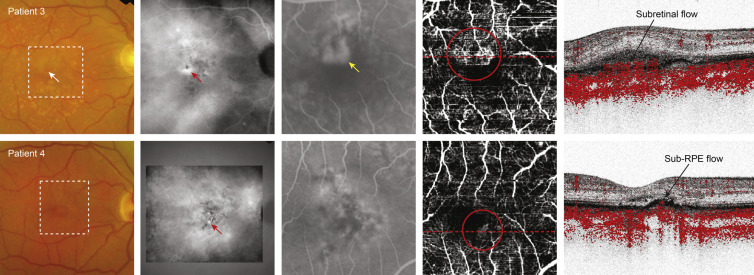
In 2 patients (Patients 3 and 4) there was no discernible abnormal blood flow either intraretinally or transretinally ( Figure 4 ). Patient 3 showed an intraretinal hemorrhage on fundus examination, while in Patient 4 only hyperpigmentation was seen ( Figure 4 , Column 1). Both patients revealed a late-phase hyperfluorescent hot spot on indocyanine green angiography ( Figure 4 , Column 2). Fluorescein angiography showed a mixed/classic CNV in Patient 3 and an occult CNV in Patient 4 ( Figure 4 , Column 3). On the Doppler en face image an abnormal vascular network was seen at the border of the foveal avascular zone in both patients ( Figure 4 , Column 4; red circles). The Doppler tomogram of Patient 3 showed abnormal blood flow confined to the subretinal space ( Figure 4 , Column 5, top row) and sub–retinal pigment epithelial space (shown in Supplementary Video 5 , available at AJO.com ), while in Patient 4 ( Figure 4 , Column 5, bottom) it was limited to the sub–retinal pigment epithelial space alone. These findings corresponded to the mixed/classic-type and occult CNV that was seen on fluorescein angiography, respectively.
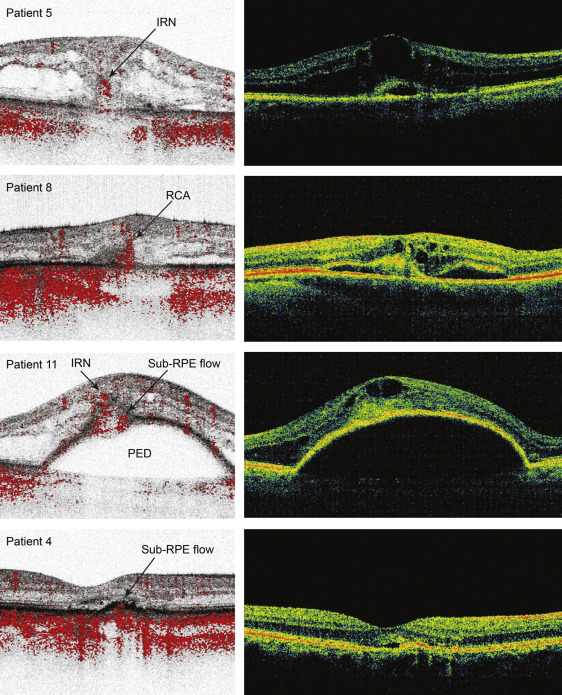
Figure 5 shows the most representative images from the head-to-head comparison of the spectral-domain OCT scan with phase-resolved Doppler OCT tomograms for each of the 4 subcategories described above. For each of the 11 patients a spectral-domain OCT scan was chosen that resembled the location of the phase-resolved Doppler OCT as closely as possible. In all images the main overall structures were comparable. Smaller details, for example small intraretinal cysts, seemed slightly better defined on the phase-resolved-intensity OCT images. The region of abnormal blood flow localized on the phase-resolved Doppler OCT tomograms corresponded to a high reflective area within or under the retinal tissue on the spectral-domain OCT. Patients 8 and 11 are the best examples of this finding.