Purpose
To propose a new parameter, “Parallelism,” to evaluate retinal layer integrity on spectral-domain optical coherence tomography (SDOCT), and to investigate the association between parallelism and visual function in eyes with idiopathic epiretinal membrane (ERM).
Design
Retrospective, observational evaluation of a diagnostic test.
Methods
We evaluated a consecutive series of 57 eyes of 57 patients with ERM and 30 healthy eyes of 30 volunteers for whom M-CHARTS testing and SDOCT were performed on the same day. OCT images were skeletonized, and the orientation of segmented lines in the image was termed “Parallelism” and was expressed as a value ranging from 0-1 and increasing as the retinal layers ran more parallel with each other. The relationships between parallelism and visual acuity and between parallelism and metamorphopsia score were evaluated.
Results
In normal eyes, parallelism was nearly homogeneous and varied slightly with the location. Parallelism in eyes with ERM was significantly lower than that in normal eyes. In the horizontal and vertical scans, parallelism was significantly correlated with visual acuity, horizontal metamorphopsia score, and vertical metamorphopsia score. Parallelism of the center (1 mm) in the horizontal scan was strongly correlated with horizontal metamorphopsia score ( R = −0.632; P < .0001). Significant negative correlation was found between parallelism and retinal thickness both in horizontal and vertical scans.
Conclusions
Parallelism was significantly lower in eyes with ERM than in normal eyes, and correlated strongly with metamorphopsia and visual acuity in eyes with ERM.
In recent decades, imaging technology in optical coherence tomography (OCT) has advanced rapidly and contributed immeasurably to progress in ophthalmology. OCT provides cross-sectional images of the retina, as in microscopy of tissue sections, and a 3-dimensional standpoint in understanding retinal diseases. OCT also enables objective measurement of retinal thickness as a novel quantitative parameter for assessment of disease severity and evaluation of therapeutic efficacy.
More recently, improved OCT image quality has been achieved by increased retinal scan speed owing to advancement of OCT generations from time-domain OCT to spectral-domain OCT (SDOCT) and by image processing techniques using multiple-aligned OCT scans to reduce speckle noise. Later generations of OCT systems have enabled clinicians to appreciate the individual retinal layers, and these layers on the OCT images have provided important information about pathologies of diseases such as diabetic macular edema, epiretinal membrane (ERM), and glaucoma. Quantitative evaluation of disrupted retinal layers by layer segmentation, which allows analysis of continuous sequence in retinal thickness between selected layers, has yielded correlations between local layer thickness and pathologic conditions. However, use of software-based automatic layer segmentation analysis in clinical practice is limited to specific diseases because of inaccuracy in certain cases. Automatic layer segmentation software functions effectively in normal OCT images and uncomplicated OCT images in diseased eyes, such as in glaucoma and retinitis pigmentosa, but manual compensation is sometimes required for analyses of segmented lines in OCT images in diseased eyes. Developments of robust software for segmentation analyses are eagerly expected.
In this study, we proposed a new parameter, “Parallelism,” to evaluate retinal layer integrity by using an entirely new concept. Parallelism indicates how straight the layers are and how parallel the layers are to each other. It can be calculated using line segments obtained by simply filtering and thresholding of the original image, while segmentation analysis requires solid lines to calculate retinal thickness. Picture interpolation to create solid lines is unnecessary; therefore, parallelism has potential as a robust and easily determined parameter of structural integrity of retinal layers. The algorithm for calculating parallelism was tested using OCT scans from normal subjects and patients with ERM, and clinical relevance was explored.
Methods
Subjects
The present study had a retrospective, observational design for evaluation of a diagnostic test. All the research and measurements adhered to the tenets of the Declaration of Helsinki and were approved by the Institutional Review Board of Kyoto University Graduate School of Medicine for retrospective review of existing patient data. We retrospectively examined 57 eyes of 57 patients (mean age ± standard deviation, 67.5 ± 7.6 years; range, 50-81 years) with idiopathic ERM but without any other macular abnormality who visited Kyoto University Hospital from February 19, 2013 through July 31, 2013. The inclusion criterion was the availability of M-CHARTS (Inami Co, Tokyo, Japan) test results and SDOCT images of sufficient quality that were acquired on the same day. Eyes with secondary ERM (eg, attributable to diabetic retinopathy, venous occlusion, retinal detachment, uveitis, or trauma) were excluded from this study. All patients had undergone comprehensive ophthalmologic examinations, including measurement of best-corrected visual acuity (BCVA), slit-lamp biomicroscopy, color fundus photography, and SDOCT. Patients were tested at this same visit for the presence of metamorphopsia by using M-CHARTS to obtain separate measurements of the severity of image distortion along horizontal and vertical lines. Data of 30 eyes of 30 volunteers (64.5 ± 10.7 years; range, 38-77 years) for candidate control eyes were retrospectively collected from our database of normal volunteers.
Optical Coherence Tomography
Retinal sectional images of the macula were obtained using SDOCT (Spectralis; Heidelberg Engineering, Heidelberg, Germany). The central fovea was defined as the area lacking inner retinal layers in the macular region. Cross-sectional images at 30 degrees through the fovea were chosen for each eye. The Spectralis OCT system has built-in software to calculate retinal thickness, and we used this feature to measure average foveal thickness of the area 6 mm in diameter centered on the fovea and of each subfield. Scans were manually corrected if there were any B-scans with an algorithm failure, such as inaccurately drawn automated boundary lines.
Calculation of Parallelism
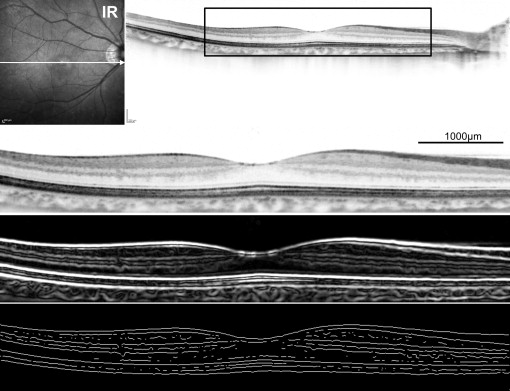
To quantitatively evaluate orientations of retinal layers, we first extracted skeletonized images (line art) from OCT images by applying filtration through first-order derivative of a Gaussian filter using the ImageJ plug-in Feature Detector, an algorithm based on the optimization of a Canny-like criterion, followed by a 1-2 pixel band-pass filter and binarization by intensity thresholding using Otsu’s thresholding method for automatic binarization level decision ( Figure 1 ). Because the target object of image processing in this study was a 6-mm-long section on a full-thickness OCT image, filter bandwidth was adjusted to reduce noise in the images with maintenance of visualization of multiple layers. Lines in the vitreous space and beyond the retinal pigment epithelium were erased manually as artifacts. ERMs were not erased and were included in analyses. Note that the analysis requires only information regarding layer orientation, which can be obtained using line segments, and not solid lines or accurate segmentation of the retinal layers.
In the skeletonized images, angles of neighboring pixel pairs against the horizon were categorized as 0, 45, 90, and 135 degrees, and the numbers of pixel pairs were counted, basically according to the study by Ueda and associates on actin filament-bundle orientations in plants ( Figure 2 ). In this study, “Parallelism” referred to the orientations of retinal layers and was calculated using the ImageJ plug-in KbiLinesAngle ( http://hasezawa.ib.k.u-tokyo.ac.jp/zp/Kbi/ImageJKbiPlugins ), as follows:
Parallelism= ( | n 0 − n 90 |+| n 45 − n 135 | ) / ( n 0 + n 45 + n 90 + n 135 )
Stay updated, free articles. Join our Telegram channel

Full access? Get Clinical Tree


