Purpose
To analyze corneal and total aberrations using custom-developed anterior segment spectral optical coherence tomography (OCT) and laser ray tracing in keratoconic eyes implanted with intracorneal ring segments (ICRS).
Design
Evaluation of technology. Prospective study. Case series.
Methods
Nineteen keratoconic eyes were measured before and after ICRS surgery. Anterior and posterior corneal topographic and pachymetric maps were obtained pre- and postoperatively from 3-dimensional OCT images of the anterior segment, following automatic image analysis and distortion correction. The pupil center coordinates were used as reference for estimation of corneal aberrations. Corneal aberrations were estimated by computational ray tracing on the anterior and posterior corneal surfaces. Total aberrations were measured using a custom-developed laser ray tracing aberrometer. Corneal and total aberrations were compared in 8 eyes pre- and postoperatively for 4-mm pupils.
Results
Total and corneal aberrations were highly correlated. Average root mean square of corneal and total high-order aberrations (HOAs) were 0.78 ± 0.35 μm and 0.57 ± 0.39 μm preoperatively, and 0.88 ± 0.36 μm and 0.53 ± 0.24 μm postoperatively (4-mm pupils). The anterior corneal surface aberrations were partially compensated by the posterior corneal surface aberrations (by 8.3% preoperatively and 4.1% postoperatively). Astigmatism was 2.03 ± 1.11 μm preoperatively and 1.60 ± 0.94 μm postoperatively. The dominant HOA aberrations both pre- and postoperatively were vertical coma (Z 3 −1 ), vertical trefoil (Z 3 −3 ), and secondary astigmatism (Z 4 4 ). ICRS decreased corneal astigmatism by 27% and corneal coma by 5%, but on average, the overall amount of HOA did not decrease significantly with ICRS treatment.
Conclusions
OCT is a reproducible technique to evaluate corneal aberrations. OCT-based corneal aberrations and ocular aberrations show a high correspondence in keratoconic patients before and after ICRS implantation. ICRS produced a decrease in astigmatism, but on average did not produce a consistent decrease of HOAs.
The quality of the images projected on the retina is determined by the optical properties of the cornea and crystalline lens. In the young eye, the aberrations of the ocular components are generally well tuned, with the aberrations of the lens partly compensating the aberrations of the cornea. In diseased eyes such as keratoconus or following certain corneal surgical procedures, this balance is lost as a result of the associated changes in corneal shape. Aberrometry techniques, such as Hartmann-Shack or laser ray tracing, have become widely used technologies to measure aberrations in the laboratory and in the clinic. The contribution of the corneal aberrations to the ocular aberrations is typically calculated from the subtraction of corneal aberrations (computed by ray tracing on corneal elevation data) from ocular aberrations. However, the lack of reliable posterior corneal elevation measurements, particularly in highly degraded corneas, has limited a full analysis of the corneal (anterior and posterior surfaces) and total aberrations in keratoconic eyes, before and following treatment.
To date, the analysis of corneal aberrations from both anterior and posterior corneal surfaces has been performed only using Scheimpflug imaging. However, several studies have reported a poor repeatability of this technique, especially in irregular corneas. This variability could be associated, among other factors, with interpolation errors attributable to meridional sampling approaches, relatively long acquisition times, and errors in optical distortion correction, particularly challenging with highly deformed corneas and in the presence of implants with a refractive index different from that of the cornea.
Spectral-domain optical coherence tomography (OCT) presents several advantages for the measurement of accurate anterior and posterior corneal geometry over other techniques, owing to its high speed and resolution, and the possibility for obtaining 3-dimensional (3-D) corneal maps with a homogeneous rectangular (rather than meridional) sampling. OCT provides a direct measurement of corneal elevation, and therefore is free from the skew ray ambiguity present in standard Placido disk topography. Besides, the regular and dense lateral scanning provides higher lateral resolution than typical radial sampling (standard Placido disk) or meridional sampling (Scheimpflug imaging). However, OCT is generally subject to motion artifacts and distortions: fan distortion (arising from the scanning architecture, and resulting in a combination of geometric aberrations, including field distortion, astigmatism, and spherical aberration) and optical distortion (arising from refraction at the optical surfaces). Because of these distortions, OCT images need to be corrected for quantification. Fan (following instrument calibration) and optical distortion (through preceding surfaces) are corrected using 3-D ray tracing analysis. Previous work validates the repeatability and accuracy of our spectral OCT system in corneal geometric measurements, and in comparison with Scheimpflug and Placido corneal topography. We have recently demonstrated quantitative anterior segment OCT imaging for surface topography of the cornea and crystalline lens. Besides distortion correction and automatic processing tools, OCT acquisition protocols are optimized to minimize the impact of motion artifacts.
In particular, we have presented tools for quantitative anterior and posterior corneal topography in keratoconic corneas before and after treatment with intracorneal ring segments (ICRS), as well as full 3-D characterization of the implanted ICRS. While evaluating corneal topography allows monitoring the progression of keratoconus and the potential benefit of the treatment, a better understanding of the impact of the changes of corneal shape (by disease or treatment) is obtained by studying its aberrations, as these determine optical quality. The combined measurements of corneal (anterior and posterior) and total aberrations allow a better understanding of the optical degradation imposed by the corneal deformation in keratoconus and the optical benefit resulting from treatment, as well as the interactions between the aberrations produced by each optical element.
Several studies in the literature have examined total and corneal aberrations in keratoconus. However, although there is evidence that the posterior cornea may be importantly affected in keratoconus, only few studies have considered the posterior corneal shape in the estimation of corneal aberrations. Keratoconic and aphakic eyes have in fact been used in the literature as models for cross-validations of total and corneal aberrometry techniques, assuming that total aberrations are primarily driven by the aberrations of the anterior corneal surface. The evaluation of the optical performance in patients implanted with ICRS has been addressed in several studies, which analyzed total and anterior corneal aberrations. However, the incorporation of the posterior corneal surface should make those comparisons more accurate. A deeper analysis of the optical changes produced by ICRS (at both the corneal and ocular levels) will help to understand the potential of this technique for the treatment of keratoconus. In this study, we present, for the first time, OCT-based corneal aberrometry and its application in keratoconic patients before and after ICRS implantation. Corneal aberrations were compared with total aberrations measured with laser ray tracing in the same patients. These comparisons allowed evaluating interactive effects of anterior cornea, posterior cornea, and internal aberrations. In addition, the pre- and postoperative optical quality estimated from the measured aberrations was correlated with visual performance. This analysis allowed us to get insights on the potential optical and visual benefits of the ICRS procedure.
Subjects and Methods
Keratoconus Patients
Nineteen keratoconic eyes of 17 patients (10 male, 7 female) diagnosed by an experienced corneal specialist (N.A.) on the basis of clinical and topographic signs were part of an observational study of ICRS for keratoconus, and were recruited from patients attending the Ophthalmology Service at the Fundación Jiménez-Díaz, Madrid, Spain. The study was revised and approved by the Institutional Review Boards of the Fundación Jiménez-Díaz and followed the tenets of the Declaration of Helsinki. The subjects signed a consent form and they were aware of the nature of the study. Table 1 includes selected descriptive preoperative parameters: keratoconus degree following the Amsler-Krumeich classification, cone location, and maximum anterior corneal curvature (Kmax). The average age of the subjects was 29.3 ± 10.8 years.
| Eye # | Preoperative Data | ICRS Parameters | |||||||
|---|---|---|---|---|---|---|---|---|---|
| KC Degree | Cone Location | Kmax (D) | ICRS Technique | Optical Zone (mm) | ICRS Thickness (μm) | ICRS Arc Length (deg) | Incision Site (deg) | Planned Depth (μm) | |
| 1 | III | I-T | 52.00 | Femtosecond | 6 | 200 | 210 | 70 | 380 |
| 2 | III | I-C | 53.63 | Femtosecond | 6 | a:200; b:200 | a:160; b:90 | 35 | 360 |
| 3 | III | I-T | 55.20 | Femtosecond | 6 | a:250; b:200 | a:120; b:90 | 100 | 380 |
| 4 | III | I-T | 56.44 | Manual | 5 | a:250; b:200 | a:160; b:120 | 140 | 380 |
| 5 | III | I-T | 57.86 | Femtosecond | 6 | a:200; b:200 | a:120; b:120 | 100 | 380 |
| 6 | II | I-C | 48.58 | Femtosecond | 6 | 250 | 160 | 110 | 353 |
| 7 | III-IV | C | 62.35 | Manual | 5 | a:250; b:250 | a:160; b:90 | 120 | 370 |
| 8 | III-IV | I-N | 58.93 | Femtosecond | 6 | 300 | 210 | 135 | 440 |
| 9 | III-IV | I-C | 63.37 | Manual | 5 | a:250; b:250 | a:160; b:90 | 60 | 380 |
| 10 | III | I-C | 56.15 | Manual | 5 | 200 | 160 | 50 | 350 |
| 11 | III-IV | I-T | 59.04 | Femtosecond | 6 | a:250; b:250 | a:120; b:120 | 115 | 380 |
| 12 | III-IV | I-C | 64.16 | Femtosecond | 5 | 300 | 210 | 165 | 380 |
| 13 | II | I-T | 48.64 | Femtosecond | 6 | a:150; b:150 | a:120; b:120 | 75 | 380 |
| 14 | II-III | C | 56.25 | Femtosecond | 6 | 300 | 150 | 10 | 380 |
| 15 | II | I-N | 55.07 | Femtosecond | 6 | 250 | 150 | 125 | 375 |
| 16 | III | C | 51.56 | Femtosecond | 6 | 300 | 150 | 0 | 380 |
| 17 | II | I-C | 51.63 | Femtosecond | 6 | 250 | 150 | 140 | 380 |
| 18 | II | I-T | 52.29 | Femtosecond | 6 | a:300; b:300 | a:120; b:120 | 75 | 347 |
| 19 | II | I-T | 58.44 | Femtosecond | 6 | 250 | 210 | 60 | 380 |
Intracorneal Ring Segment Surgery
All surgeries were performed by an experienced surgeon (N.A.). Ferrara-like ICRS were implanted following manual or femtosecond laser–assisted tunnel creation. Table 1 summarizes the specifications of the surgical procedure for ICRS implantation in each patient. Depending on the preoperative corneal topography and refraction, 1 or 2 segments were implanted, equidistantly to the incision site (steepest meridian).
Corneal Aberration Analysis: Optical Coherence Tomography
OCT corneal images of 19 keratoconic eyes were obtained preoperatively and 3 months post ICRS implantation. The spectral OCT instrument, image processing algorithms, and distortion corrections (fan and optical) to obtain anterior and posterior corneal topography from OCT images have been described in detail in previous publications.
Briefly, the spectral OCT set-up is based on a fiber-optic Michelson interferometer configuration with a superluminescent diode (λ0 = 840 nm, Δλ = 50 nm) as a light source and a spectrometer consisting of a volume diffraction grating, and a CMOS camera as a detector. The effective acquisition speed is 25 000 A-scans/s. The axial range is 7 mm in depth, resulting in a theoretical pixel resolution of 3.4 μm. The axial resolution is 6.9 μm. Measurements were collected in a 10 × 12-mm area, and consisted of a collection of 50 B-scans composed by 360 A-scans. The total acquisition time of a 3-D data set was 0.72 seconds, which we had previously tested to be sufficiently brief to minimize motion artifacts.
Images were acquired while the subjects fixated a Maltese cross fixation stimulus presented on a mini-display (SVGA OLED LE400; LiteEye Systems, Centennial, Colorado, USA) implemented in a secondary channel. The images of the cornea were acquired with respect to the anterior corneal specular reflection. Sets of 3-D images were captured approximately 5 seconds after blinking. Five repeated measurements were collected in each condition after inducing mydriasis with 1 drop of tropicamide 1%.
OCT images were de-noised, clustered (cornea, iris, and ICRS), segmented, and corrected from fan and optical distortion correction. The segmented anterior and posterior corneal surfaces were fitted with Zernike polynomial expansion. Corneal thickness maps and the 3-D iris position were also obtained. The iris plane and 3-D coordinates of the pupil center were used for registration of pre- and postoperative data, and as reference for the estimation of corneal aberrations.
The pupil center (obtained from the automatically identified iris volume) was used as a reference in the analysis of pre- and postoperative measurements. Corneal elevation maps were reported within the optical zone defined by the ICRS and the natural pupil. The center of the implanted ICRS was obtained from the automatically identified ICRS volume, and its shift from the pupil center was estimated for registration of pre- and postoperative measurements. The rays passing through the ICRS are highly deviated, resulting in halos, and they cannot be accounted for by a standard aberration analysis. For this reason, in this study we have analyzed optical aberrations in a circular 4-mm area concentric with the patient’s pupil, in order to ensure quantitative analysis within the optical zone without the influence of ICRS.
Corneal thickness was calculated from direct subtraction of the posterior corneal surface from the anterior corneal surface. Corneal pachymetry is implicitly considered in the estimations of full corneal aberrations, including potential redistributions of corneal thickness (and considering that refractive index remains unchanged). An extensive analysis of corneal pachymetry and longitudinal changes after ICRS can be found in Pérez-Merino and associates.
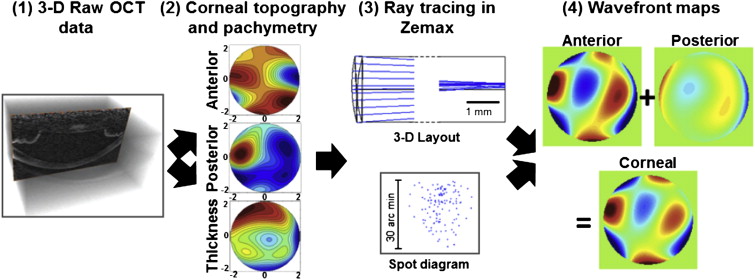
The elevation data from both corneal surfaces within a central 4-mm pupil diameter area were fitted by Zernike polynomial expansions (up to sixth order) and exported to ZEMAX (Radiant ZEMAX; Focus Software, Tucson, Arizona, USA) for ray tracing analysis. Refractive indices of 1.376 and 1.334 were used for the cornea and aqueous humor, respectively. Wave aberrations were calculated in the pupil plane, placed at 3.47 mm from the anterior corneal surface, by tracing an array of 64 × 64 collimated rays through a 1-surface (anterior cornea only) or 2-surface (anterior and posterior cornea, separated by corneal thickness) eye model. In the 1-surface model, the index after the anterior corneal surface was set to 1.334. The contribution of the posterior corneal surface was obtained from direct subtraction of the anterior corneal surface aberrations from corneal aberrations. Corneal aberrations were analyzed preoperatively and 3 months post ICRS implantation. Figure 1 illustrates the computation of corneal aberrations from OCT data, that is, ray tracing calculation on OCT distortion-corrected corneal surfaces.
Total Aberration Analysis: Laser Ray Tracing
Total wave aberrations were measured using custom laser ray tracing, which has been described in detail in a previous study. In brief, an infrared (786-nm) laser beam samples different positions of the pupil sequentially, while a charge-couple device (CCD) camera records the corresponding aerial images of light reflected off the retina. Ray aberrations are obtained by estimating the deviations of the centroids of the retinal spots images corresponding to each entry pupil location with respect to the reference (chief ray). These deviations are proportional to the local derivatives of the wave aberrations. Measurements were done under mydriasis (1 drop 1% tropicamide). The sampling pattern (37 rays in a hexagonal configuration) was adjusted by software to fit a 4-mm pupil centered at the pupil center. The pupil center reference allowed preoperative and postoperative comparisons, and the pupil diameter was selected to guarantee that postoperative measurements fitted the optical zone defined by the inner diameter of the ICRS. Maximum energy exposure was 6.8 μW. Prior to the measurement, the patient adjusted his or her subjective refraction using a Badal optometer. The Badal system was modified for this study to allow correction of spherical errors up to −12 diopters, frequent in moderate to advanced keratoconus. All measurements were done under foveal fixation of a Maltese cross fixation stimulus. Total wave aberrations were fitted by sixth-order Zernike polynomial expansions following OSA standards. Preoperative and 3-month-post-ICRS total aberrations were measured and analyzed in 8 eyes.
Optical Quality Metrics
Wave aberrations were described in terms of individual Zernike coefficients or root mean square (RMS). RMS was used to report the magnitude of high-order aberrations (HOAs) excluding tilt, defocus, and astigmatism, and of certain relevant aberrations (astigmatism, coma, and trefoil). The point-spread function (PSF) and the modulation transfer function (MTF) were computed from Zernike coefficients by means of Fourier optics using routines written in Matlab (MathWorks, Natick, Massachusetts, USA), for 4-mm pupils. Optical quality was described in terms of the visual Strehl metric. Visual Strehl was computed as the volume under the visual MTF (obtained from the overlapping of the MTF with the inverse of a general neural transfer function), normalized to diffraction limit. Visual Strehl was evaluated through focus (considering HOAs, and canceling the astigmatic terms). The maximum value of the through-focus visual Strehl curve was obtained as the best-corrected optical quality metric. This optical quality metric has been shown to correlate best with logMAR visual acuity in a normal population.
Visual Acuity Measurement
Visual acuity was measured using a high-contrast Snellen visual acuity test. Patients were tested at a distance of 4 m (13 ft) from the visual acuity chart. All measurements were performed with natural pupils under photopic conditions. Best-corrected visual acuity was obtained for optimal spherical and cylindrical correction with spectacles and given in logMAR units.
Statistical Analysis
Univariate analysis (independent-samples Student t test) was used to evaluate differences between preoperative and postoperative measurements. Correlations (Pearson correlation coefficients) were assessed between OCT and laser ray tracing aberration measurements. A P value less than .05 was considered statistically significant in all comparisons.
Results
Laser Ray Tracing Versus Optical Coherence Tomography Aberrometry
Corneal and total aberrations were compared in 8 eyes preoperatively and 3 months post ICRS implantation. Figure 2 shows the average coefficients describing the second and HOAs of the whole eye and of the cornea, as well as the corresponding wave aberration maps (excluding tilt, defocus, and astigmatism). The corresponding simulated PSFs for all subjects (average) pre- and postoperatively are also shown. Both pre- and postoperatively, total and corneal aberrations are dominated by astigmatism (eliminated in the maps shown in Figure 2 to allow visualization of higher-order aberrations), vertical coma (Z 3 −1 ), vertical trefoil (Z 3 −3 ), and secondary astigmatism (Z 4 4 ). Anterior corneal aberrations are slightly higher than those of the whole cornea (including both anterior and posterior surfaces), indicating a compensatory role of the posterior corneal surface. While total and corneal aberrations show quite similar aberration patterns, several total aberration terms tend to be lower than the corresponding corneal aberration terms.
Figure 3 shows individual corneal and total wave aberration maps (excluding tilt, defocus, and astigmatism) for all eyes measured with OCT and with laser ray tracing, preoperatively and 3 months post ICRS implantation. In most eyes, the high-order wave aberration maps are dominated by coma and trefoil. Repeated measurements were highly reproducible within each subject, with average (across all patients and conditions) standard deviations of 0.13 μm (laser ray tracing), 0.17 μm (OCT anterior), and 0.19 μm (OCT corneal) for RMS astigmatism, and of 0.07 μm (laser ray tracing), 0.10 μm (OCT anterior), and 0.11 μm (OCT corneal) for RMS HOA. Total and corneal aberrations show in general a good correspondence (except for Eye 5). In most cases total aberrations are lower than corneal aberrations, suggesting a compensatory effect of the crystalline lens. On average, the RMS HOAs were 0.78 ± 0.35 μm (OCT) and 0.57 ± 0.39 μm (laser ray tracing) preoperatively and 0.88 ± 0.36 μm (OCT) and 0.53 ± 0.24 μm (laser ray tracing) postoperatively.


