Purpose
To summarize the epidemiology of pathologic myopia and myopic choroidal neovascularization (CNV) and their impact on vision.
Design
Systematic literature review of all English-language studies evaluating the epidemiology and visual burden of pathologic myopia or myopic CNV.
Methods
PubMed and EMBASE were searched with no time limits using predefined search strings for English-language studies evaluating the epidemiology and visual burden of pathologic myopia and myopic CNV.
Results
In total, 39 relevant publications were identified. Population-based studies reported pathologic myopia to be the first to third most frequent cause of blindness. The prevalence of pathologic myopia was reported to be 0.9%-3.1%, and the prevalence of visual impairment attributable to pathologic myopia ranged from 0.1%-0.5% (European studies) and from 0.2%-1.4% (Asian studies). The prevalence of CNV in individuals with pathologic myopia was reported to be 5.2%-11.3%, and was bilateral in approximately 15% of patients. All studies of visual outcome in patients with myopic CNV (duration ranging from less than 3 months to 21.5 years) reported deterioration in best-corrected visual acuity over time. Older age, subfoveal CNV location, and larger baseline lesion size were predictors of worse visual outcomes.
Conclusions
Pathologic myopia is an important cause of vision loss worldwide, affecting up to 3% of the population. Of these, a substantial proportion of patients develop myopic CNV, which mostly causes a significant progressive decrease in visual acuity. This condition should therefore be a target for new treatment strategies.
Myopia is a common eye condition, affecting 20%-40% of adults, which poses a significant public health burden and cost to society. A proportion of people with myopia have pathologic myopia, which is characterized by excessive and progressive elongation of the globe, and is now considered to be an important cause of impaired vision and blindness worldwide. Choroidal neovascularization (CNV) is a frequent complication associated with pathologic myopia that threatens vision, and is characterized by the occurrence of newly formed abnormal blood vessels that grow under the retinal pigment epithelium or retina and can penetrate the Bruch membrane to extend into the subretinal space, with subsequent scarring. The precise pathogenesis of CNV in eyes with pathologic myopia is unclear, and a range of hypotheses were discussed in detail in a recent review. CNV is acutely symptomatic, is associated with the occurrence of a central scotoma, and can result in a rapid deterioration of central vision; hence, there is a need for urgent clinical treatment.
Data on the epidemiology of pathologic myopia and CNV secondary to pathologic myopia (myopic CNV) in the literature are inconsistent, and the impact of this condition on vision remains unclear; hence, we conducted a systematic review to describe the epidemiology and visual burden of pathologic myopia and myopic CNV.
Methods
Sources and Methods of Literature Search
We conducted a systematic review of all English-language studies that evaluated the epidemiology and visual burden of pathologic myopia or myopic CNV. A core search string was developed to identify all English-language human studies examining pathologic myopia or myopic CNV. Medical Subject Heading terms and keywords were used and included the following: degenerative myopia, neovascular, CNV, choroidal, pathologic, degenerative, progressive, and neovascularization. Filters were added to the core search string to create searches with the aim of identifying papers that examined epidemiology, prevalence, and visual burden. Search results were combined and reviewed. Searches were conducted in PubMed and EMBASE in March 2011 with no time limits and were updated on June 29, 2012. To supplement the primary search, the Cochrane Library and the University of York Centre for Reviews and Disseminations databases were interrogated using disease terms for pathologic myopia and CNV. Reference lists of included studies were also reviewed.
Study Selection and Data Extraction
Articles identified from the searches were screened by a single researcher and checked by a second researcher; discrepancies were resolved through discussion with a third researcher. There is no single widely used definition for pathologic myopia; some have suggested that pathologic myopia could be defined by a refractive error of at least −6.0 diopters or an axial length of at least 26 mm with the presence of 1 or more typical fundus lesions. Studies were included if they were considered to concern pathologic myopia, defined as described above, or if they concerned pathologic, degenerative, progressive, and malignant myopia (all referred to as pathologic myopia here). All references to high myopia (and myopia gravis) were reviewed to verify that they concerned high myopia with fundus changes (studies referring to high myopia only were excluded). If the terms myopic degeneration, myopic maculopathy, myopic macular degeneration, and myopic retinopathy were used, references were reviewed to verify that they met the definition of pathologic myopia. All references to CNV secondary to pathologic myopia, myopic CNV, subretinal neovascularization, Fuchs spot, Forster–Fuchs retinal spot, or disciform degeneration in pathologic myopia were considered to refer to myopic CNV. The categorizations of people as blind or visually impaired were taken directly from the articles and, therefore, used the definitions applied in the original articles. In the majority of articles, visual impairment and blindness were defined using best-corrected visual acuity (BCVA) cut-offs according to the US or World Health Organization (WHO) definitions. Thus, while the cut-offs vary somewhat, in most cases, visual impairment in this report is defined as BCVA <20/40 to >20/200 (logMAR 0.30 to <1.00; US) or BCVA <20/60 to >20/400 (logMAR 0.50 to <1.20; WHO). Blindness was defined as BCVA <20/200 (logMAR 1.00; US) or <20/400 (logMAR 1.20; WHO).
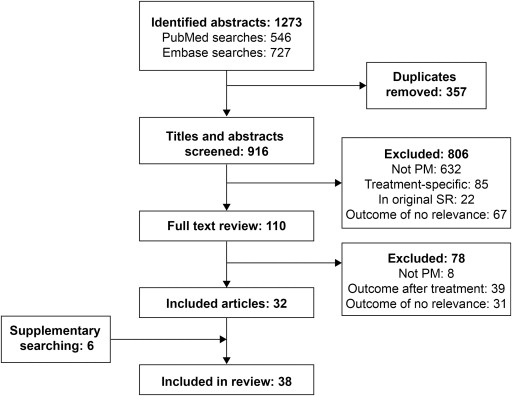
A total of 736 citations were identified in the March 2011 search and 537 were identified in the June 2012 update, resulting in 1273 citations to be reviewed ( Figure 1 ). After removing duplicates, 916 citations were reviewed, of which 110 were deemed suitably relevant to be reviewed as full papers. After reviewing the full publications, a further 78 papers were excluded, resulting in 32 publications being identified by the searches. Supplementary searching of the Cochrane Library and Centre for Reviews and Disseminations databases provided no additional papers, but searching of reference lists resulted in an additional 6 papers being identified. Thus, 38 papers were considered to be relevant for this systematic review. Data extraction was independently performed by 2 researchers and discrepancies were resolved by discussion.
Results
Of the 38 eligible studies, 24 were publications primarily focusing on the prevalence or incidence of pathologic myopia, and 13 of these included data on pathologic myopia as a cause of low vision or blindness. The remaining 14 studies focused on CNV, namely the prevalence and location of CNV, associated risk factors, and the changes in visual acuity during the follow-up of untreated patients with myopic CNV. In total, 22 studies were published since 2000 and the remaining 16 were published between 1965 and 1999. Details of the methodology and quality of these studies are provided in Supplementary Table 1 (available at AJO.com ).
Pathologic Myopia as a Cause of Blindness or Low Vision
Seventeen studies reported on the contribution of pathologic myopia to low vision or blindness ( Table 1 ). Eight studies assessed the prevalence of blindness or low vision in samples representative of the general population and reported the proportion of individuals in which pathologic myopia was the cause of blindness/low vision. In the 2 studies of European populations reporting these data, pathologic myopia was the cause of low vision or blindness in 5.8% and 7.8% of eyes with low vision or blindness. The Los Angeles Latino Eye Study (LALES), which examined Latin American residents of Los Angeles, reported pathologic myopia as the cause of blindness or low vision in 4.5% of eyes. In contrast, in the 3 large studies performed in China and Japan, pathologic myopia was the cause of blindness or low vision in 12.2%-27.4% of individuals with low vision, and in a pilot study performed in Hong Kong, pathologic myopia was the cause of low vision in 31.3% of individuals with low vision. In the 6 studies reporting the contribution of pathologic myopia to blindness, pathologic myopia was the first, second, or third most frequent cause of blindness.
| Reference/Study Name (Terminology for Pathologic Myopia) | Population | Age, Years | Subjects (Eyes) in Study | Blind | Low Vision | Blind Or Low Vision | |||||
|---|---|---|---|---|---|---|---|---|---|---|---|
| Subjects (Eyes) | Subjects (%) Attributable to Pathologic Myopia | Ranking | Subjects (Eyes) | Subjects (%) Attributable to Pathologic Myopia | Ranking | Subjects (Eyes) | Subjects (%) Attributable To Pathologic Myopia | ||||
| Population-based studies | |||||||||||
| European studies | |||||||||||
| Klaver et al 1998 The Rotterdam Study (myopic degeneration) | Population residing in a city district of Rotterdam, Netherlands | ≥55 (average 70) | 6775 (13550) | (64) a | 4 (6.3) a | 3rd a | (192) a | 11 (5.7) a | 3rd a | (256) | 15 (5.8, eyes) a |
| Buch et al 2001 The Copenhagen City Eye Study | Residents of Copenhagen, Denmark | 60-80 | 944 (1888) | NR | NR | NR | 944 b | 1 (0.1) b | 4th b | NR | NR |
| Cedrone et al 2006 | Residents of Ponza, Italy | ≥40 | 843 (1686) | (36) b | 5 (13.9) b | 3rd b | (67) c | 3 (4.5) c | 6th c | (103) | 8 (7.8, eyes) |
| Latin American study | |||||||||||
| Cotter et al 2006 The Los Angeles Latino Eye Study | Latin American residents of Los Angeles, USA | ≥40 | 6129 (12 258) | 12 (43) a | 5 (11.6) a | 3rd a | 55 (91) a | 1 (1.1) a | 9th a | (134) | 6 (4.5, eyes) a |
| Asian studies | |||||||||||
| Xu et al 2006 The Beijing Eye Study | Residents of Beijing, China | ≥40 (average 56.1 years) | 4409 (8816) | 13 b | 1 (7.7) b | 3rd b | 49 b | 16 (32.7) b | 2nd b | 62 | 17 (27.4, individuals) b |
| Iwase et al 2006 The Tajimi Study | Randomly selected residents of Tajimi city, Japan | ≥40 (average 57.5 years) | 3021 (6042) | (49) a | 11 (22.4) a | 1st a | (76) a | 7 (9.2) a | 3rd a | (125) | 18 (14.4, eyes) a |
| Yamada et al 2010 | Estimate of the entire Japanese population | All ages | NR | 187 800 d | (12.9) d | 2nd d | 1 673 000 d | 198 000 (11.8) d | 3rd d | 1.8 million | (12.2, individuals) d |
| Van Newkirk 1997 Hong Kong Adult Vision Pilot Study | Hong Kong Chinese residents | ≥40 | 355 (710) | NR | NR | NR | 16 e | 5 (31.3) e | 1st e | NR | NR |
| Blind registry studies | |||||||||||
| Macdonald 1965 | Registered blind individuals in Canada | All ages | 24 605 (49 210) | 24 605 d | 2232 (9.1) d | 3rd d | NR | NR | NR | NR | NR |
| Avisar et al 2006 | Newly registered blind individuals in Israel , 2003 | All ages | 1958 | 1958 b | (7.4) b | 2nd b | NR | NR | NR | NR | NR |
| Ghafour et al1983 | Newly registered blind individuals in West Scotland, UK , 1980 | All ages | 357 (714) | 357 (714) b | 43 (6.0) b | 5th b | NR | NR | NR | NR | NR |
| Krumpaszky et al 1999 | Newly registered blind individuals Württemberg-Hohenzollern, Germany , 1994 | All ages | 647 | 647 f | 43 (6.6) f | 4th f | NR | NR | NR | NR | NR |
| Wu et al 2011 | Newly blind residents of Jing-An district in China , 2007−2009 | All ages (mean, 66.12 ± 14.82) | 309 793 | 142 (284) b | 74 (26.1) b | 1st b | NR | NR | NR | NR | NR |
| Selected populations | |||||||||||
| Shah et al 2011 | Children attending a low-vision clinic in Pakistan | 4-16 | 270 | NR | NR | NR | NR | NR | NR | 270 | 30 (11.1), ranked 3rd g |
| Pi et al 2012 | School-aged children in Western China | 6-15 (average 11) | 3079 children | NR | NR | NR | 237 h | 3 (1.3) h | 3rd h | NR | NR |
| Sainz-Gomez et al 2010 | Spanish nursing home residents | ≥65 (average 82) | 392 (784) | (158) d | 35 (22.2) d | 2nd d | (185) i | 11 (5.9) i | 3rd i | (343) | 46 (13.4) |
| Khan 2000 | Patients attending a tertiary care eye hospital in India | All ages | 410 | NR | NR | NR | 410 b | 37 (9.0) b | 4th b | NR | NR |
a Data based on WHO criteria; data based on US criteria also reported in these studies.
c Visual impairment defined as best-corrected VA < 20/70 to >20/400.
e Visual impairment defined as VA < 20/60.
f Blindness defined as VA < 20/1000.
g Blindness defined as VA < 3/60; visual impairment defined as VA < 6/18 to 3/60.
h Visual impairment defined as VA ≤ 20/40.
A further 5 studies reported pathologic myopia as a cause of blindness in individuals registered as blind in a particular country or region of a country. Four studies concerned individuals newly registered as blind over a single year or over 3 years, whereas a Canadian study involved all individuals registered blind at the time of the study. The frequency of pathologic myopia as the cause of blindness was relatively consistent across the 4 studies in white populations (6.0%-9.1%) and was much higher in the Chinese study (26.1%). Pathologic myopia was ranked as the second to fifth most frequent cause of blindness in the studies of white populations, and was the most frequent cause in the Chinese study.
Two studies reported the frequency of pathologic myopia as the cause of blindness or low vision in children. Pi and associates reported that pathologic myopia was the cause of low vision in 1.3% of visually impaired school-aged children in Western China, whereas Shah and associates reported that 11.1% of children attending a low-vision clinic in Peshawar, Pakistan, had pathologic myopia as the main cause of visual impairment. In both studies, pathologic myopia was the third most common cause of visual impairment. Two further studies reported on pathologic myopia as the cause of low vision or blindness in institutionalized elderly people in Pamplona, Spain (average age, 82 years), and individuals seen at a tertiary care eye hospital in Hyderabad, India (46% of patients were less than 30 years of age).
Prevalence and Incidence of Pathologic Myopia and Visual Impairment Attributable to Pathologic Myopia in General Populations
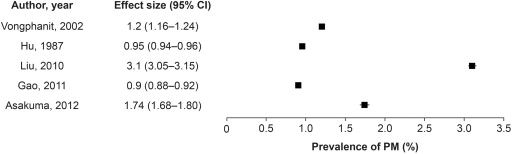
Six publications provided data on the prevalence of pathologic myopia in general populations ( Table 2 ). Five were population-based surveys in the general community. The Blue Mountains Eye Study (BMES) recorded a prevalence of 1.2% (per individual) for a predominantly white population, whereas 4 studies of Asian populations reported a prevalence of 0.90%-3.1% per individual ( Figure 2 ). A study in school-aged children in China reported a prevalence of pathologic myopia at 0.19% per eye.
| Reference (Study Name) | Population | Definition of Pathologic Myopia | Age, Years | Subjects (Eyes) in Study | Subjects (Eyes) With Pathologic Myopia | Prevalence of Pathologic Myopia |
|---|---|---|---|---|---|---|
| Vongphanit et al 2002 (The Blue Mountains Eye Study) | Urban Australian population residing in 2 postcodes of the Blue Mountains region | “Myopic retinopathy”: a cluster of signs that indicates degeneration of chorioretinal tissues associated with the excessive axial elongation of the myopic eye | ≥49 | 3583 (7166) | 44 (67) CNV, 1 eye Fuchs spot, 3 eyes Chorioretinal atrophy, 11 eyes | 1.2% (individuals) 0.93% (eyes) |
| Hu et al 1987 | Population residing in East, Mid-South, and North-East China | “Degenerative myopia”: no specific definition given | All ages | 26 084 (52 168) | NR | 0.95% (individuals) |
| Liu et al 2010 (The Beijing Eye Study) a | Residents of Beijing, China | “Myopic retinopathy”: the presence of ≥1 of the following features: staphyloma, lacquer cracks, Fuchs spot, or chorioretinal atrophy at the posterior pole | ≥40 (average 56.0) | 4319 (8484) | 132 (198) Lacquer cracks, 9 eyes Fuchs spot, 3 eyes | 3.1% (individuals) 2.3% (eyes) |
| Gao et al 2011 | Rural population in Northern China | “Myopic retinopathy”: signs of staphyloma, lacquer cracks, Fuchs spot, and myopic chorioretinal atrophy | ≥30 | 6603 evaluable individuals, 60 participants | (84) | 0.90% (individuals) (95% CI: 0.7-1.1) |
| Asakuma et al 2012 (Hisayama Study) | Residents of Hisayama, Japan | “Myopic retinopathy”: presence of diffuse chorioretinal atrophy, patchy chorioretinal atrophy, lacquer cracks, or macular atrophy | ≥40 | 1992 (3784) | 33 (47) | 1.74% (individuals) 1.24% (eyes) |
| Pi et al 2012 | School-aged children in Western China | “PM”: myopia with changes in the fundus, including slanted optic disc, lacquer crack formation, and Fuchs spot | 6-15 (average, 11) | 3079 children | (6) | 0.19% (eyes) |
a This analysis of the Beijing study was for myopic retinopathy, whereas Xu et al 2006 reported the prevalence of myopic degeneration.
Ten publications focused on identifying the prevalence and causes of low vision and blindness in the general population ( Table 3 ). Of note, the study by Wang and associates assessed the prevalence and causes of visual field loss (VFL) while the other studies evaluated vision loss per se. Although the prevalence of pathologic myopia in the general population was not expressly stated in these papers, the prevalence of visual impairment attributable to pathologic myopia was estimated by expressing the number of cases of low vision/blindness caused by pathologic myopia as a percentage of the number of participants examined in the survey. Three studies of European populations yielded an estimated prevalence of 0.11%-0.47%; LALES presented results equating to a prevalence of 0.05%; and 5 studies of Far East Asian populations yielded an estimated prevalence of 0.17%-1.41%. Furthermore, Pi and associates estimated a prevalence of pathologic myopia–related visual impairment in children in China of 0.10%, and Avisar and associates recorded the prevalence of blindness attributable to pathologic myopia in Israel as 0.02%-0.03%.
| Reference (Study Name) | Population | Definition of Pathologic Myopia | Age | Subjects (Eyes) in Study | Subjects (Eyes) With Pathologic Myopia | Prevalence of VI Attributable to Pathologic Myopia |
|---|---|---|---|---|---|---|
| European studies | ||||||
| Klaver et al 1998 (The Rotterdam Study) | Population residing in a city district of Rotterdam, Netherlands | “Myopic degeneration”: no specific definition given | ≥55 (average, 70) | 6775 (13 550) | (15) | 0.11% (eyes) a |
| Buch et al 2001 (The Copenhagen City Eye Study) | Residents of Copenhagen, Denmark | “Myopic macular degeneration”: no specific definition given | 60-80 | 944 (1888) | 1 | 0.11% (individuals) b |
| Cedrone et al 2006 | Italian residents originally examined for a previous 1988 study | “Degenerative myopia”: no specific definition given | ≥40 | 843 (1686) | (8) | 0.47% (eyes) c |
| Avisar et al 2006 | Entire Israeli population | “Myopic maculopathy”: no specific definition given | All ages | Years 1998-2003: Population range: 6-6.8 million | NR | 0.02%-0.03% (blindness) b |
| Latin American study | ||||||
| Cotter et al 2006 (The Los Angeles Latino Eye Study) | Latin American residents of Los Angeles, USA | “Myopic degeneration”: no specific definition given | ≥40 | 6129 (12 258) | 3 | 0.05% (individuals) a |
| Asian studies | ||||||
| Van Newkirk 1997 (Hong Kong Adult Vision Pilot Study) | Hong Kong Chinese residents | “Myopic degeneration”: staphylomatous change of the sclera with atrophy of the retinal pigment epithelium and choroid, temporal to the optic nerve, including the macula | ≥40 | 355 (710) | 5 | 1.41% (individuals) d |
| Xu et al 2006 (The Beijing Eye Study) | Residents of Beijing, China | “Degenerative myopia”: a myopic refractive error of at least -6 diopters and a typical myopic maculopathy with stretching of the macula | ≥40 (average, 56.1) | 4409 (8816) | 17 | 0.39% (individuals) b |
| Wang et al 2006 (Beijing Eye Study) e | Residents of Beijing, China | “Degenerative myopia”: macular region showed myopic atrophic changes, refractive error of at least -6 diopters, and optic disc appeared normal | ≥40 (average, 56.0) | 4350 (8617) | (84) | 0.97% (eyes) f |
| Iwase et al 2006 (The Tajimi Study) | Randomly selected residents of Tajimi city, Japan | “Myopic macular degeneration”: no specific definition given | ≥40 (average, 57.5) | 3021 (6042) | (18) | 0.30% (eyes) a |
| Yamada et al. 2010 | Estimate of the entire Japanese population | “Degenerative myopia”: no specific definition given | All ages | 127 700 000 g | 222 303 | 0.17% (individuals) h |
a Data based on WHO criteria; data based on US criteria also reported in these studies.
c Visual impairment defined as best-corrected VA < 20/70 to >20/400.
d Visual impairment defined as VA < 20/60.
e This study estimates the prevalence of pathologic myopia as a cause of visual field loss rather than visual impairment.
f Eyes with visual field loss, defined as at least 1 test location of reduced sensitivity.
g Estimated Japanese population, taken from 2007 World Population Datasheet ( http://www.prb.org/pdf07/07wpds_eng.pdf ).
The annual incidence of blindness attributable to pathologic myopia in the general population was reported in 3 studies ( Table 4 ). Values ranged from 0.77 per 100 000 for Germany to 2.1-4.3 per 100 000 for Israel. In China, a 5-year follow-up of the Beijing Eye Study reported an overall pathologic myopia incidence of 0.05%, while the annual incidence of blindness attributable to pathologic myopia was estimated as 12.6 per 100 000 in Shanghai for the 2007-2009 period.
| Reference | Population | Definition of Pathologic Myopia | Subjects for Population | Number of Individuals Newly Blind | Incidence of Blindness Attributable to Pathologic Myopia, per 100 000 |
|---|---|---|---|---|---|
| Krumpaszky et al 1999 | Registered blind in Württemberg-Hohenzollern, Germany , 1994 | High myopia, all sequelae of high myopia including retinal detachment and fundal changes | 5356 | 647 a | 0.77 a |
| Avisar et al 2006 | Registered blind in Israel , 1998-2003 | Myopic maculopathy (no definition given) | 16-21 × 10 3 | 1958-2186 b | 2.1-4.3 b |
| Wu et al 2011 | Registered blind in Jing-An district, China , 2001-2009 | Myopic macular degeneration: refractive error of at least -6.0 diopters plus tessellated fundus with patchy chorioretinal atrophy, macular hemorrhage, or posterior staphyloma | 2001: 378 2009: 514 | For 2001-2003: 100 b For 2007-2009: 142 b | For 2001-2003: 4.8 b For 2007-2009: 12.6 b |
a Blindness defined as VA < 20/1000.
Risk Factors for Pathologic Myopia
Four studies assessed risk factors for pathologic myopia and found that greater axial length (3 studies ) and age (2 studies ) were found to be significantly associated with pathologic myopia. Other risk factors for pathologic myopia identified by a single study were larger optic disc area, female sex, myopic refractive error (per -1 diopter), and family history of myopia. One study assessed the impact of sex and age on pathologic myopia, though no significant associations were identified.
Two review articles described evidence for a genetic basis for pathologic myopia. Based on studies in twins and in families with pathologic myopia, 9 loci for pathologic myopia have been identified, including 7 autosomal dominant loci on chromosomes 2, 4, 7, 12, 17, 18, and 21; 1 autosomal recessive locus on chromosome 14; and 1 recessive locus on the X chromosome. Furthermore, 1 article has identified a novel susceptibility locus at chromosome band 11q24.1 for pathologic myopia in a Japanese population. Possible environmental factors associated with pathologic myopia (including annual hours of sunshine, water hardness, selenium levels, and use of fluorinated water) have been reported in 2 US studies from the 1980s, although the authors state that identified factors were not necessarily causally related to the development of pathologic myopia.
Prevalence of Choroidal Neovascularization in General Populations
Two of the studies that reported the prevalence of pathologic myopia in the general population recorded the number of eyes identified with CNV or Fuchs spot. The BMES identified 4 eyes with CNV or Fuchs spot, equivalent to a prevalence of 0.05%, and the Beijing Eye Study recorded Fuchs spot in 3 eyes, corresponding to a prevalence of 0.04%. However, the small numbers of individuals with CNV/Fuchs spot in these population studies mean that these values have somewhat limited accuracy.
Prevalence and Incidence of Choroidal Neovascularization in Individuals With Pathologic Myopia
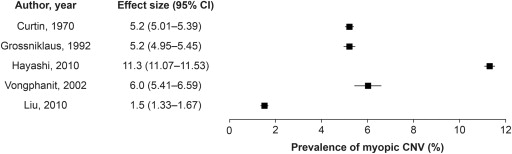
The prevalence of CNV in individuals with pathologic myopia has been reported in 3 studies ( Table 5 ) and can be calculated from the 2 population-based studies described above (BMES, 6.0%; Beijing Eye Study, 1.5% ). Studies in individuals with pathologic myopia reported a prevalence of 5.2% (2 studies performed in the United States) and 11.3% (for a study performed in Tokyo). Curtin and associates reported that Fuchs spot was bilateral in 4 patients (16.7% of individuals with the lesion). A further study in individuals with myopic CNV reported that 14% of individuals had bilateral CNV. A summary of the prevalence of myopic CNV reported in studies is presented in Figure 3 .
| Reference (Study Name) | Population | Definition of Pathologic Myopia | Definition of CNV-type Lesion | Age | Subjects (Eyes) | Prevalence of CNV |
|---|---|---|---|---|---|---|
| Studies in patients with PM | ||||||
| Curtin et al 1970 | Patients referred to the Myopia Clinic, Manhattan, NY, USA | Axial length >26.5 mm | Fuchs spot | All ages | (538) | 5.2% of eyes (28 eyes) Bilateral in 4 patients (16.7%) |
| Grossniklaus et al 1992 | Records for accessioned eyes from the Eye Pathology Laboratory, Baltimore, MD, USA , 1923-1990 | Axial length 25.5-26.5 mm and refractive error −5.0 to −7.5 diopters | “Subretinal neovascularization” Fuchs spot | All ages (average, 59) | 202 (308) (285 eyes were post mortem) | Subretinal neovascularization, 5.2% of eyes Fuchs spot, 3.2% of eyes |
| Hayashi et al 2010 | Consecutive patients attending the High Myopia Clinic, Tokyo, Japan , with PM and a follow-up of >5 years | “PM” Myopic refraction ≥−8 diopters or axial length ≥26.5 mm | Choroidal neovascularization | All ages (mean, 41) | 429 (806) | 11.3% of eyes (91 eyes) at baseline |
| Studies in general populations | ||||||
| Vongphanit et al 2002 (The Blue Mountains Eye Study) | Urban Australian population residing in 2 postcodes of the Blue Mountains region | “Myopic retinopathy” A cluster of signs that indicates degeneration of chorioretinal tissues associated with the excessive axial elongation of the myopic eye | CNV or Fuchs spot | ≥49 years | 44 (67) | 6.0% of eyes CNV, 1 eye Fuchs spot, 3 eyes |
| Liu et al 2010 (The Beijing Eye Study) | Residents of Beijing, China | “Myopic retinopathy” The presence of ≥1 of the following features: staphyloma, lacquer cracks, Fuchs spot, or chorioretinal atrophy at the posterior pole | Fuchs spot | ≥40 (average, 56) | 132 (198) | 1.5% of eyes (3 eyes) |
One study reported the incidence of CNV in individuals with pathologic myopia (myopic refractive error of at least -8 diopters and fundus changes typical of pathologic myopia) followed up for at least 3 years. Over a mean follow-up of 10.8 years, 10.2% (n = 33) of eyes (32 individuals, 14.7%) developed CNV. At baseline, 46 fellow eyes had pre-existing myopic CNV; 16 of the 33 eyes that developed CNV were fellow eyes of individuals with existing myopic CNV. Therefore, the incidence of CNV in the fellow eye was significantly higher in patients with an existing myopic CNV than in those without existing CNV: 34.8% vs 6.1%, P = .0001.
Eight of the studies identified in the searches reported on sex ratio differences in the proportion of patients with myopic CNV. All 8 reported a predominance of the condition in female subjects, with prevalence ranging from 52%-92% ( Supplementary Table 2 , available at AJO.com ). Eight studies reported on the proportion of patients with subfoveal lesions, which ranged from 55%-94%.
Impact on Vision
Two population-based studies reported on BCVA in individuals with pathologic myopia compared with individuals without pathologic myopia. After adjusting for age, mean BCVA letter score in the worst eye for individuals with pathologic myopia was 39 (as measured using the Early Treatment Diabetic Retinopathy Study scale), compared with 49 for individuals without pathologic myopia in the BMES ( P < .0001). In the Beijing Eye Study, mean BCVA was logMAR 0.88 (41 letters) for individuals with pathologic myopia compared with logMAR 0.56 (57 letters) for individuals without pathologic myopia ( P < .001).
Eleven studies reported on visual outcome for patients with myopic CNV followed up for durations ranging from under 3 months to 21.5 years ( Table 6 ). At baseline, the proportion of patients with a BCVA of 20/200 or worse ranged from 21%-60% in 8 studies reporting this measure. Most studies reported a deterioration in BCVA over the study duration (3 months – 21.5 years). Six studies reported worsening of BCVA in at least 50% of eyes over the course of the study and 6 studies reported an increase of at least 20% in the proportion of individuals with a BCVA of 20/200 or worse. The 2 studies that did not report deterioration in BCVA had a high proportion of patients with a BCVA of 20/200 or worse at baseline (47% and 60%).
| Reference | Age, Years (Mean) | No. of Patients (Eyes) | Follow-up, Years (Mean) | Mean Visual Acuity, logMAR/Letters | Proportion of Patients With BCVA ≤20/200 | Change in BCVA, % Eyes | ||||
|---|---|---|---|---|---|---|---|---|---|---|
| Baseline | Final | Baseline | Final | Worsened | Stable | Improved | ||||
| Fried et al 1981 (Fuchs spot, CNV in 77%) | All ages | 36 (55) | 3-15 (median, 5) | NR | NR | 47% a | 41% | 37% | 28% | 35% |
| Hotchkiss and Fine, 1981 (22% received previous treatment) b | All ages (45) | 33 (27) | (2.1) | NR | NR | NR | 44% a | 52% | 33% | 15% |
| Hampton et al 1983 | 12-96 (50% aged 30-55) | 39 (42) | <3 months to 2+ years | NR | NR | 26% a | 62% a | 71% | 27% | 2% |
| Avila et al 1984 | 20-80 (52.2) | 58 (70) | 0.8-9 (3.4) | NR | NR | 60% a | 60% a | 46% | 34% | 20% |
| Secretan et al 1997 | <60 years (median, 41.3) | (50) | 5 | NR | NR | 0% (inclusion criterion) | NR | 62% c | 36% | 2% c |
| Tabandeh et al 1999 | ≥50 (63.1) | 22 (22) | 1 | 1.1 | 1.0 | 50% | 73% | 36% | 41% | 23% |
| Bottoni and Tilanus, 2001 | ≤55 (median, 44) | 31 (31) | 1-20 (3.9) | NR | NR | NR | NR | 58% d | 26% | 16% d |
| Yoshida et al 2002 | ≤40 years (29.8) | 22 (26) | 3-11.1 (6.8) | 0.44 | 0.33 | 8% | 12% | 19% d | 54% | 27% d |
| >40 years (54.6) | 41 (47) | 3-21.5 (7.2) | 0.89 | 1.12 e | 32% | 53% | 51% d | 32% | 17% d | |
| Yoshida et al 2003 | 26-61 (46.9) | 25 (27) | 10-13.3 (11) | 0.75 | 1.32 e | 30% | 96% | NR | NR | NR |
| Hayashi et al 2005 | All ages (48.6) | 52 (57) | 5-19.3 (8.9) | 0.73 | 0.96 e | 21% | 65% | NR | NR | NR |
| Kojima et al 2006 | All ages (47.7) | 54 (54) | 5 | 0.68 | NR | 24% | 65% | 85% | 11% | 4% |
Stay updated, free articles. Join our Telegram channel

Full access? Get Clinical Tree


