Purpose
To investigate the efficacy of periodic injection of aflibercept in each subtype of age-related macular degeneration (AMD) and to explore the predictive factors for visual outcome in clinical settings.
Design
Prospective nonrandomized interventional case series.
Methods
Patients with AMD were recruited and were administered aflibercept injections once a month for 3 months followed by once every 2 months for 8 months. The logarithm of the minimal angle of resolution (logMAR) at 12 months and improvement of vision from baseline were compared among polypoidal choroidal vasculopathy (PCV), retinal angiomatous proliferation (RAP), and typical AMD. Regression rate of polypoidal lesions was assessed. We also performed regression analysis with logMAR at 12 months as the dependent variable.
Results
The study sample consisted of 98 patients: 46 had typical AMD, 42 had PCV, and 10 had RAP. Mean logMAR improved from 0.36 to 0.21 in 12 months. While there was no difference in visual improvement between typical AMD and PCV, final logMAR was better in PCV (0.32 ± 0.09 vs 0.08 ± 0.04, P = .016). Thirty-nine PCV patients underwent follow-up angiography, and regression of polyps was observed in 27 cases (69.2%). Multiple regression analysis showed that the presence of external limiting membrane (ELM), smaller greatest linear dimension, and the presence of polypoidal lesion were associated with better visual outcome (R 2 = 0.53, P = 2.73 × 10 −14 ).
Conclusions
Periodic injection of aflibercept is effective for PCV as well as for typical AMD. The statuses of ELM, greatest linear dimension, and polypoidal lesion are predictive for visual outcome.
Age-related macular degeneration (AMD) is a leading cause of visual impairment, especially in developed countries. AMD can be divided into dry and wet forms. While the visual impairment progresses gradually in dry AMD, choroidal neovascularization (CNV) develops and hemorrhage or exudative changes deteriorate the vision rapidly. The treatment of AMD was unsatisfactory until recently but dramatically changed after 2 pivotal studies showed the efficacy of anti–vascular endothelial growth factor (VEGF) drug ranibizumab. The randomized studies clearly showed that monthly intravitreal injections of ranibizumab are effective in improving vision.
Aflibercept is another anti-VEGF drug, which has higher affinity to VEGF, longer half-life, and capability of inhibiting placental growth factor. The VIEW I/II studies were conducted and showed that 3 monthly injections followed by bimonthly injections are not inferior to monthly injections of ranibizumab in terms of visual gain in 52 or 96 weeks.
Thus, there is no doubt about the efficacy of anti-VEGF therapy for AMD; however, there are several issues to be addressed when physicians translate the result into clinical practice. First, clinical trials including the ones discussed above have specific inclusion and exclusion criteria as to the baseline visual acuity or the size of the lesions. Information regarding those who do not meet the inclusion criteria (eg, those with good visual acuity) is lacking. Second, subtypes of AMD, including polypoidal choroidal vasculopathy (PCV) and retinal angiomatous proliferation (RAP), are not differentiated in the trials. While recent studies reported the favorable result of ranibizumab on PCV, photodynamic therapy, especially combined with anti-VEGF therapy, is also effective and the optimal treatment of PCV is still controversial. RAP was associated with less favorable outcome compared to typical AMD before the era of anti-VEGF therapy and there is still little evidence about the treatment effect of RAP. The visual outcome might be different in these subtypes. Third, which kind of patient responds well to the treatment is unclear. Since anti-VEGF therapy for AMD requires frequent and ongoing injections of the drug and is accompanied by physical, economic, and social burden, estimating the chance of visual gain based on baseline characteristics is appreciated for appropriate informed consent.
In the present study, we prospectively recruited consecutive patients with treatment-naïve AMD and treated them with periodic injections of aflibercept. The results would show the real-world effect of aflibercept and help in predicting the visual outcome in each patient.
Methods
Study Design and Setting
This was a prospective, nonrandomized, interventional study conducted in an institutional setting. The study design was approved by the Institutional Review Board of Kyoto University Graduate School of Medicine, and all study conduct adhered to the tenets of the Declaration of Helsinki. Each patient gave written informed consent for participation in the study.
Patients and Study Population
Participants were recruited at the Macular Service, Department of Ophthalmology, Kyoto University Hospital from November 19, 2012 to December 26, 2013. Inclusion criteria were age older than 50 years, axial length less than 26.5 mm, the presence of neovascular AMD, and willingness to participate in the study. Only 1 eye from each patient was included in the study; when a patient’s second eye developed AMD, that eye was not included in the study. Exclusion criteria were any previous treatment of CNV and the presence of other retinal diseases such as angioid streaks, vitelliform macular dystrophy, and retinal vein or artery occlusion. Those with chronic courses of AMD, indicated by disease history and/or massive fibrotic lesions, were also excluded. In addition, those who dropped out of the study were excluded from the analysis.
Intervention and Observation Procedure
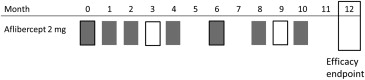
All the participants underwent 3 courses of monthly injections and subsequent bi-monthly injections of aflibercept (2.0 mg). The number of injection should be 3 + 4 in the 12-month study period ( Figure 1 ). When there was a contraindication such as cerebral infarction or when patients did not agree to undergo the treatment, injection was skipped. Alternatively, additional injections were administered or photodynamic therapy (PDT) was performed at the physicians’ discretion. Patients underwent comprehensive examinations including visual acuity measurement, axial length measurement (IOL Master, Carl Zeiss Meditec, Dublin, California, USA), fundus photography, spectral-domain optical coherence tomography (SD OCT; Spectralis; Heidelberg Engineering, Heidelberg, Germany), fluorescein angiography (FA) and indocyanine green angiography (IGA), and fundus autofluorescence imaging at baseline (HRA2; Heidelberg Engineering). Fundus photography, SD OCT, angiography, and fundus autofluorescence imaging were performed under sufficient pupillary dilation.
Visual acuity measurement and SD OCT were performed at each visit and the result at months 3, 6, 9, and 12 were analyzed. At month 12, we also performed FA, IGA, and fundus autofluorescence imaging.
Visual acuity was measured with Landolt C charts (Takagi Seiko, Nakano, Japan) in a standard way. SD OCT images were obtained using Spectralis (Spectralis Family Acquisition Module, version 5.7.5.0) with Heidelberg Eye Explorer (version 1.8.6.0; Heidelberg Engineering). The eye tracking system of the device was used to detect and maintain the correct scanning position. Thirty-degree horizontal and vertical scans through the fovea were recorded using normal and enhanced depth imaging mode with averaging of 100 scans. Thirteen raster scans covering a 20 × 30-degree oblong rectangle was performed with averaging of 50 scans for each scan. We measured the central retinal thickness (CRT), which was defined as the distance between the vitreoretinal surface and the inner surface of retinal pigment epithelium ( Figure 2 , Top). Choroidal thickness was measured in enhanced depth imaging scans as a length between the outer border of the Bruch membrane and chorioscleral interface ( Figure 2 , Upper middle). CRT and choroidal thickness were measured in horizontal and vertical scans and averaged. Pigment epithelium detachment (PED) height was defined as the distance between the outer border of the retinal pigment epithelium and the inner border of the Bruch membrane; maximum PED heights in the raster scans were recorded ( Figure 2 , Lower middle). The presence of foveal external limiting membrane (ELM) and inner segment ellipsoid (ISe) was evaluated in vertical and horizontal scans. The presence of vitreoretinal adhesion was judged in raster scans ( Figure 2 , Top). Whether the treatment achieved dry macula, defined as the absence of intra- or subretinal fluid throughout the raster scans, was also judged.
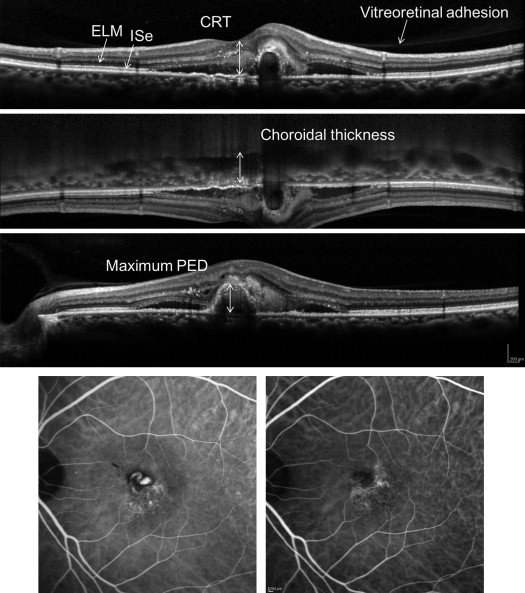
As to the angiography, we measured the greatest linear dimension at baseline and 12 months. Although we measured the size of CNV including branching vascular network and polypoidal lesion in PCV, the exact border was unclear in some cases at baseline and/or at 12 months (16/98, 16.3%). Thus, the comparison was made in the rest of the patients. We judged the presence of polypoidal lesions in each case ( Figure 2 , Bottom). The cases with polypoidal lesions were diagnosed as PCV and cases with intraretinal neovascularization were diagnosed as RAP. The other patients were categorized as typical AMD (tAMD).
Outcome Measures
Main outcome measure was changes in visual acuity. Secondary outcome measures involved subgroup comparison between patients with or without visual acuity better than 0.5 (20/40) and among subtypes of AMD. In addition, we performed multivariate regression analysis to identify the baseline characteristics predicting visual outcome.
Statistical Analysis
Statistical analysis was carried out using SPSS version 19 (IBM Japan, Tokyo, Japan). A P value smaller than .05 was considered as significant. Visual acuity measured with Landolt C charts was converted to logarithm of minimal angle of resolution (logMAR) to perform statistical analysis. Paired t test or χ 2 test was used to compare baseline and month 12 characteristics. Changes in visual acuity (VA) or CRT from baseline were assessed using 1-way repeated-measures analysis of variance (ANOVA) and post hoc Bonferroni correction. Two-way repeated-measures ANOVA was used to investigate the difference in clinical course of VA or CRT among the groups. Bivariate relationships were examined using the Pearson correlation coefficient for continuous variables and Spearman correlation coefficient test for binary variables. Step-wise multivariate regression analysis was performed with age, greatest linear dimension, presence of polypoidal lesion, presence of reticular pseudodrusen, CRT, maximum PED, choroidal thickness, presence or absence of ELM, ISe, and vitreoretinal adhesion as independent factors and visual acuity at 12 months as dependent factor.
Results
The study included 112 patients who met inclusion and exclusion criteria. Fourteen patients dropped out because of gastric cancer, ileus, or unknown reason. Thus, the study sample consisted of 98 patients: 46 patients with tAMD, 42 patients with PCV, and 10 patients with RAP. Mean number of injection was 6.8 ± 0.2 (range: 1-8). One patient developed cerebral infarction after the first injection and refrained from subsequent treatment. Another 8 patients received fewer than 6 injections owing to patients’ will, but continued visiting and were included in the analysis. One patient was refractory to the initial 3 monthly injections and received combination therapy with PDT. As the adverse event, 1 patient in the study population and another patient who dropped out developed retinal pigment epithelium tear. Baseline and 12-month characteristics of the participants are shown in Table 1 . Visual acuity improved by about 1.5 lines in 12 months. CRT, PED, and choroidal thickness decreased significantly. Greatest linear dimension was also decreased, primarily by the resolution of hemorrhage and PED. The size of the CNV did not change significantly. Vitreoretinal adhesion was noted in 27 patients at baseline and 6 of them developed posterior vitreous detachment during the treatment period.
| Baseline | 12 Months | P Value | |
|---|---|---|---|
| Age (y) | 75.7 (74.1-77.3) | ||
| Sex (male/female) | 62/36 | ||
| Subtype (tAMD/PCV/RAP) | 46/42/10 | ||
| logMAR | 0.36 (0.29-0.43) | 0.21 (0.12-0.29) | 6.356 × 10 −10 |
| Greatest linear dimension (μm) | 3990.6 (3541.5-4439.7) | 3569.0 (3167.9-3970.2) | .001 |
| Lesion size (mm 2 ) | 3.77 (3.36-4.18) | 3.86 (3.43-4.29) | .548 |
| CRT (μm) | 318.3 (289.5-347.1) | 176.1 (157.6-194.6) | 1.266 × 10 −14 |
| Maximum PED (μm) | 247.8 (204.9-290.7) | 117.9 (94.2-141.6) | 1.085 × 10 −9 |
| Choroidal thickness (μm) | 248.1 (226.9-269.3) | 222.5 (202.3-242.5) | 3.842 × 10 −12 |
| Intact foveal ELM (+/−) | 68/30 | 72/26 | .421 |
| Intact foveal ISe (+/−) | 48/50 | 57/41 | .193 |
| Vitreoretinal adhesion (+/−) | 27/71 | 21/77 | .311 |
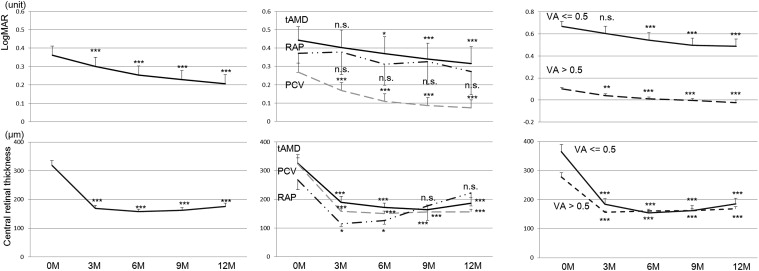
The clinical course of all the participants is shown in Figure 3 (Top left). As stated above, the treatment was generally effective. We compared the treatment effect among the subtypes of AMD ( Figure 3 , Top middle). Patients with each subtype showed similar trend and 2-way repeated-measures ANOVA showed no significant difference among the subtypes ( P = .097). Visual acuity (logMAR) at 12 months was significantly better in PCV patients than in tAMD patients (0.32 ± 0.09 vs 0.08 ± 0.04, P = .016). In addition, we compared patients with or without visual acuity better than 0.5 (20/40) ( Figure 3 , Top right). Both groups showed significant improvement from baseline. The visual gain looked better in those with baseline visual acuity ≤0.5 but there was no significant difference (1.8 ± 0.4 lines vs 1.2 ± 0.3 lines, P = .171). The clinical courses of CRT are shown in Figure 3 (Bottom row). Retinal thickness decreased quickly after the treatment with aflibercept and maintained the effect for 12 months in any subtypes (Bottom middle) or regardless of the baseline visual acuity (Bottom right). Prevalences of dry macula at 3, 6, 9, and 12 months are shown in Table 2 . Prevalence of dry macula was significantly lower in tAMD patients compared to PCV patients at 3, 6, and 9 months ( P = .015, P = .045, and P = .009, respectively).
Stay updated, free articles. Join our Telegram channel

Full access? Get Clinical Tree


