Purpose
To compare nonmydriatic stereoscopic Optomap ultrawide field images with dilated stereoscopic Early Treatment Diabetic Retinopathy Study 7-standard field 35-mm color 30-degree fundus photographs (ETDRS photography) and clinical examination for determining diabetic retinopathy (DR) and diabetic macular edema (DME) severity.
Design
Single-site, prospective, comparative, instrument validation study.
Methods
One hundred three diabetic patients (206 eyes) representing the full spectrum of DR severity underwent nonmydriatic ultrawide field 100-degree and 200-degree imaging, dilated ETDRS photography, and dilated fundus examination by a retina specialist. Two independent readers graded images to determine DR and DME severity. A third masked retina specialist adjudicated discrepancies.
Results
Based on ETDRS photography (n = 200), the results were as follows: no DR (n = 25 eyes [12.5%]), mild nonproliferative DR (NPDR; 47 [23.5%]), moderate NPDR (61 [30.5%]), severe NPDR (11 [5.5%]), very severe NPDR (3 [1.5%]), and proliferative DR (52 [2.5%]). One (0.5%) eye was ungradable and 6 eyes did not complete ETDRS photography. No DME was found in 114 eyes (57.0%), DME was found in 28 eyes (14.0%), and clinically significant DME was found in 47 eyes (23.5%), and 11 (5.5%) eyes were ungradable. Exact DR severity agreement between ultrawide field 100-degree imaging and ETDRS photography occurred in 84%, with agreement within 1 level in 91% (K W = 0.85; K = 0.79). Nonmydriatic ultrawide field images exactly matched clinical examination results for DR in 70% and were within 1 level in 93% (K W = 0.71; K = 0.61). Nonmydriatic ultrawide field imaging acquisition time was less than half that of dilated ETDRS photography ( P < .0001).
Conclusions
Nonmydriatic ultrawide field images compare favorably with dilated ETDRS photography and dilated fundus examination in determining DR and DME severity; however, they are acquired more rapidly. If confirmed in broader diabetic populations, nonmydriatic ultrawide field imaging may prove to be beneficial in DR evaluation in research and clinical settings.
Current evidence-based diabetes eye care is highly effective in preserving vision and preventing vision loss from diabetic retinopathy (DR). Because DR frequently is asymptomatic when most amenable to treatment, regular eye examination is recommended for all persons with diabetes mellitus to identify the presence and degree of DR and to initiate sight-preserving treatments as indicated. Only an estimated 60% of the diabetic population in the United States receives the recommended annual eye examination. Retinal evaluation and photography are important components of clinical care for DR and an integral element of clinical trials and telemedicine programs. Early Treatment Diabetic Retinopathy Study (ETDRS) 7-standard field 35-mm color 30-degree stereoscopic color fundus photographs (ETDRS photography) evaluated using the modified Airlie House classification of diabetic retinopathy are an accepted standard for determining severity of DR.
Given the rapidly increasing number of patients at risk, retinal imaging of all patients is a daunting task that requires ever more rapid, readily obtained images for evaluation. Although ETDRS photography and grading protocols provide an established and documented standard for detecting and assessing severity of DR, ETDRS photography requires skilled photographers, pharmacologic pupil dilation, and traditionally, the use of 35-mm slide film. These requirements impact efficiency, convenience, and cost of the procedure. Examiners and researchers have evaluated numerous alternatives to ETDRS photography for retinal imaging and assessment of DR severity. These studies have included the use of nonmydriatic retinal cameras, digital video imaging, fewer nonstereoscopic retinal fields, and multiple image montages.
The Optos ultrawide field retinal imaging systems (Optos PLC, Scotland, United Kingdom) use scanning laser ophthalmoscope technology combined with the unique optical properties of a large ellipsoidal mirror, allowing imaging of up to 200 degrees (82%) of the retina in a single image that takes approximately one quarter of a second to acquire. Low-powered green (532 nm) and red (633 nm) laser light simultaneously scan the retinal and choroidal tissue. A composite color image is formed by the combination of the red and green wavelengths. By scanning a 100-degree area of the retina instead of the ultrawide field 200 degrees, the high-resolution imaging mode (ResMax; Optos plc) results in a 10% to 15% increase in resolution by using the available pixels within a smaller area, achieving an 11-μm resolution.
A rapid, clinically validated, nonmydriatic method of retinal imaging would facilitate access of individuals with diabetes into recommended eye care programs, thus ultimately reducing the risk of visual loss and preserving vision. Ultrawide field imaging also may detect additional disease not identified in the more limited area coverage of ETDRS protocol photography. In this study, we evaluated the ability of stereoscopic nonmydriatic digital retinal images obtained using an Optos P200MA device to determine severity of DR as compared with ETDRS photography and clinical retinal examination through dilated pupils by a retinal specialist.
Methods
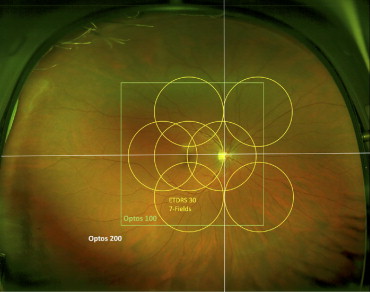
A single-site, prospective, clinic-based, comparative instrument validation study was conducted to evaluate the agreement in assessing severity of DR at the retinal lesion level between stereoscopic nonmydriatic Optos Optomap retinal images using 100-degree Optomap plus with ResMax (UWF100) and 200-degree retinal fields Optomap plus (UWF200), clinical retinal examination through dilated pupils, and ETDRS photography ( Figure 1 ) .
Subjects were recruited at the Beetham Eye Institute of the Joslin Diabetes Center as they arrived for regularly scheduled eye appointments. Patients were eligible for the study if they met all the following inclusion criteria: age 18 years or older, diagnosis of type 1 or type 2 diabetes mellitus as defined by the American Diabetes Association, willingness to undergo photography and imaging sessions, and willingness to sign the institutionally approved informed consent specifically designed for this study. Patients were excluded from the study if they had no history of diabetes, had a history of a condition in either eye that may preclude pupil dilation, or were using eye drops (mydriatic or miotic) that would alter pupil size or reactivity. Patient eligibility was determined from medical record review of the most recently diagnosed level of DR. Patients were selected to ensure distribution of various levels of DR, ranging from no DR (ETDRS level 10) to high-risk proliferative DR (PDR; ETDRS level 75). To evaluate the ability of the imaging device to identify subtle lesions of DR, recruitment was weighted toward less severe levels of DR. Mild to moderate nonproliferative DR (NPDR) was present in 54% of eyes and PDR was present in 26% of eyes. Subject characteristics and the distribution of DR severity are summarized in Table 1 .
| Study participant characteristics (n = 103 patients) | |
| Age (years) | 53.9 ± 15.2 (18 to 88) |
| Gender | |
| Female/male | 51 (49.5%)/52 (50.5%) |
| Race | |
| White | 83 (80.6%) |
| Black | 9 (8.7%) |
| Hispanic | 3 (2.9%) |
| Asian | 1 (1.0%) |
| Other/unspecified | 7 (6.8%) |
| Ocular characteristics (n = 206 eyes) | |
| ETDRS electronic visual acuity (letter score/Snellen equivalent) | |
| Median | 85 (20/20) |
| Range | 35 to 98 (20/200 to 20/12.5) |
| ≥ 20/20 | 145 (70.4%) |
| < 20/20 to ≥ 20/40 | 50 (24.3%) |
| < 20/40 to ≥ 20/100 | 10 (4.8%) |
| < 20/100 | 1 (0.5%) |
| Retinopathy severity a | |
| No DR | 25 (12.5%) |
| Mild nonproliferative DR | 47 (23.5%) |
| Moderate nonproliferative DR | 61 (30.5%) |
| Severe nonproliferative DR | 11 (5.5%) |
| Very severe nonproliferative DR | 3 (1.5%) |
| Proliferative DR | 47 (23.5%) |
| High-risk proliferative DR | 5 (2.5%) |
| Ungradable | 1 (0.5%) |
| Macular edema severity a | |
| No DME | 114 (57.0%) |
| DME | 28 (14.0%) |
| CSME | 47 (23.5%) |
| Ungradable for DME | 11 (5.5%) |
a Grading based on ETDRS 35-mm 7-standard film photographs. Six eyes did not complete imaging (n = 200 eyes).
The study required 1 visit, and all data gathering and imaging occurred during each subject’s regularly scheduled eye appointment. A certified imager acquired nonmydriatic nonsimultaneous stereoscopic 100-degree- and 200-degree-field ultrawide field images of each subject according to the study imaging protocol using the Optos P200MA instrument. Unlike traditional fundus cameras, Optos imaging relies on proper eye positioning by the imager and correct patient fixation on a target, rather than the imager viewing the retinal structures for focus. The UWF100 and UWF200 images were centered on the fovea, covering approximately 25% and 82%, respectively, of the retinal area, including the disc, macula, and major vascular arcades. The certified imager repeated imaging up to 3 times during the imaging session if the imager considered the images to be of suboptimal quality. The imager stored all images using proprietary software and images were available for review using proprietary Optos image review software (Optos V2 Vantage Dx Review version 2.5.0.135; Optos plc, Dunfermline, Scotland, United Kingdom).
After the initial ultrawide field imaging, patients proceeded to their scheduled clinical examination, which included pharmacologic pupil dilation using 2.5% phenylephrine hydrochloride and 1.0% tropicamide and dilated retinal examination by a retinal specialist. On completion of the clinical examination, an ETDRS certified photographer acquired ETDRS photographs of each subject using 35-mm Kodachrome 64-color slide film and a Zeiss FF4 (Carl Zeiss Meditec Inc, Dublin, California, USA) 30-degree mydriatic fundus camera. After film processing, the certified ETDRS photographer sorted, filed, and stored the 35-mm slides according to ETDRS protocol.
A fellowship-trained retinal specialist (P.S.S.) graded ETDRS photographs on a standard slide light box through Donaldson viewers according to ETDRS protocol. The graders entered retinal findings directly onto a standardized patient-specific electronic template modified from the Wisconsin Reading Center ETDRS retinal evaluation form and using the unique study identification numbers. The graders recorded the presence and degree of the following lesions, referenced to the modified Airlie House classification of diabetic retinopathy : hemorrhages, microaneurysms, or both (H/Ma); intraretinal microvascular abnormalities (IRMA); venous beading (VB); cotton wool spots; hard exudates; retinal thickening; neovascularization on the disc (NVD); neovascularization elsewhere on the retina (NVE); preretinal hemorrhage; vitreous hemorrhage; drusen; and traction retinal detachment.
A trained optometrist specializing in diabetes (J.D.C.), highly experienced in evaluating ETDRS photographs and digital retinal images, graded nonmydriatic ultrawide field images according to a defined protocol while masked to the clinical and ETDRS photography findings. The template was the same as the template used for recording findings from ETDRS photographs. The grader recorded the presence and degree of the same lesions graded on ETDRS photographs. To grade the UWF100 and UWF200 images with respect to ETDRS 7-standard 30-degree fields, the grader defined field 1 as centered on the optic disc and including the retinal area bounded by a radius defined as the distance between the center of the optic disc to the fovea, field 2 as centered on the fovea and including the retinal area bounded by a radius defined as the distance between the fovea and the center of the optic disc, and field 3 as the area of the retina temporal to the fovea. Imaginary vertical and horizontal lines through the center of the optic disc defined fields 4 (superior temporal), 5 (inferior temporal), 6 (superior nasal), and 7 (inferior nasal; Figure 1 ). Stereoscopic viewing was achieved using a hand-held Screen-Vu stereoscope (PS Manufacturing, Portland, Oregon, USA) viewer. Images were displayed on a Dell UltraSharp 2007FP 20-inch flat panel LCD monitor (Dell Inc, Round Rock, Texas, USA) with 1200 × 1600-pixel resolution in 32-bit color with a Radeon 9250 video card (Advanced Micro Devices Inc, Sunnyvale, California, USA). The monitors used were part of the centralized reading center of the Joslin Vision Network and had been calibrated previously to a color temperature of 6500 K and a γ setting of 2.2 (i1Display, Greytag Macbeth; X-Rite Incorporated, Grand Rapids, Michigan, USA).
Two gradings of ultrawide field images were performed for each study participant in the following order: nonmydriatic UWF100 images only followed by nonmydriatic UWF100 and UWF200 images viewed together. All image graders were masked to ophthalmic and medical history information, including clinically diagnosed level of DR severity for each eye. Grading protocol for each ultrawide field image method review followed an initial automated software rendering and adjustment of color composite images and subsequent manual γ adjustment of the green wavelength images. Color composite, green-wavelength images, and red-wavelength images were viewed individually in the following order with varying digital zoom and magnification and image rendering as appropriate: (1) individual stereo pair images side by side and (2) stereoscopic viewing.
The grader recorded “cannot grade” when inadequate photographic quality or media opacity prevented determining the presence of a characteristic being graded. If 1 or more disc areas of retina were visible in an ETDRS-defined photographic field and that area was free of the characteristic, the grading was “no evidence” rather than “cannot grade.” If the characteristic was present in the unobscured part of the field, it was estimated for the entire field based on the observable field findings. In the absence of definable lesions in the macula, the grader recorded no macular edema or “cannot grade,” even if 1 image of the stereo pair of the ETDRS photographs or ultrawide field images prevented stereoscopic reading of the macula area. On initial imaging, a macular artifact related to the optical system in the Optos P200MA resulted in ungradable images for macular edema in 48 (23%) eyes. Technical adjustments to optimize the optical system for managing the corneal reflex were made to reduce the macular artifact. A total of 14 patients (18 eyes) who initially were ungradable for diabetic macular edema (DME) were reimaged on both the original Optos P200MA and the updated Optos machine. The ungradable rate for DME was reduced by 50% after reimaging on the updated imaging system. Reimaged eyes that became gradable for DME were included in the calculation of the κ statistics for DME agreement.
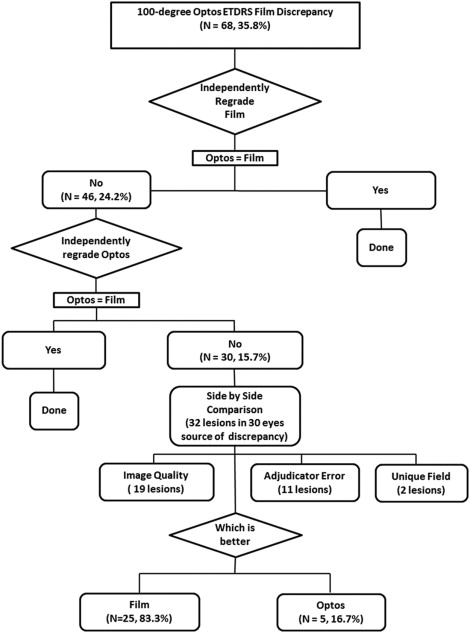
Agreement between the 2 readers (P.S.S. and J.D.C.) with regard to grading DR level previously was demonstrated as substantial to almost perfect (κ, 0.80 ± 0.13; weighted κ, 0.95 ± 0.04; Joslin Vision Network Reading Center Internal Quality Control). A senior retinal specialist (L.P.A.) independently re-evaluated all images that had differences between level of DR determined by ETDRS photographs and ultrawide field. After re-evaluation, all images that had discrepancies underwent a direct side-by-side comparison to identify the source of discrepancy and to determine the preferred method in evaluating DR and DME severity. The final adjudicated level of DR and DME was determined based on the adjudicated and side-by-side grading of both ETDRS photographs and ultrawide field images. Figure 2 presents a flowchart of the evaluation and adjudication process and the number of images evaluated in each step.
Statistical analysis
The clinical ETDRS levels of DR severity were compared, the agreement between clinical ETDRS level of DR severity between ultrawide field images and ETDRS photographs was cross-tabulated, and both unweighted and weighted (using a linear scheme) κ values were calculated. Eyes classified as ungradable were excluded from the analysis. Guidelines for interpretation were based on Landis and Koch as used in ETDRS report number 10 (0.0 to 0.2 = slight agreement; 0.21 to 0.40 = fair agreement; 0.41 to 0.60 = moderate agreement; 0.61 to 0.80 = substantial agreement; and 0.81 to 1.00 = almost perfect agreement). Severity of DR and individual lesion grading comparisons were tested using κ statistics, sensitivity and specificity percentages, and positive and negative predictive values. Additional sensitivity, specificity, positive predictive values, and negative predictive values were calculated after treating DR severity level as a binary variable with clinically important threshold values that excluded ungradable images: (1) severe or less advanced NPDR versus mild or more advanced PDR, (2) no or mild NPDR versus moderate NPDR or more advanced DR, and (3) no DME or DME versus clinically significant macular edema (CSME). For these evaluations, the adjudicated level of DR and DME was considered the gold standard. All statistical analyses were performed using SAS software version 9.2 (SAS, Inc, Carey, North Carolina, USA).
Results
A total of 206 eyes of 103 patients with type 1 or 2 diabetes were enrolled in this validation study. Ultrawide field imaging was performed and completed in all eyes. ETDRS photographs were obtained and completed in 200 (97.1%) eyes (1 study participant [2 eyes] declined further imaging with film, and in 4 eyes of 4 different participants, the film either did not advance in the camera or the 35-mm slides were not returned from the processing laboratory). Table 1 reports subject characteristics at enrollment and the distribution of DR and DME severity as graded on ETDRS photographs. After detailed grading by 2 independent graders (J.D.C. and P.S.S.) and masked adjudication by the senior retina specialist (L.P.A.), 190 images (95%) were gradable for DR and 156 images (93%) were gradable for DME in both ultrawide field images and ETDRS photographs.
In the analysis of the 190 gradable images for DR, comparison between the level of DR identified on ultrawide field images agreed exactly with ETDRS photographs in 84% (160) of eyes and was within 1 step in 91% (173) of eyes with a κ value of 0.79 (95% confidence interval [CI], 0.73 to 0.86) and weighted κ of 0.85 (95% CI, 0.80 to 0.91; Table 2 ). Compared with clinical examination ( Table 3 ), there was exact agreement with level of DR identified on ultrawide field images in 70% (137) of eyes, and agreement was within 1 step in 93% (184) of eyes, with a κ value of 0.61 (95% CI, 0.53 to 0.69) and weighted κ value of 0.77 (95% CI, 0.71 to 0.84). In eyes where ultrawide field and clinical examination results did not match exactly (n = 60), ultrawide field images agreed more closely with ETDRS photographs in 48 eyes (80%), whereas clinical examination results agreed more closely in 11 eyes (18%). Ultrawide field and clinical examination results agreed with ETDRS photographs at an equal degree in 1 eye (2%). Macular edema severity graded on a 3-category scale (no DME, DME < CSME, CSME) agreed exactly in 79% of the eyes, with a κ value of 0.60 (95% CI, 0.49 to 0.71) and a weighted κ value of 0.66 (95% CI, 0.55 to 0.77; Table 4 ).
| Grading by 35-mm ETDRS Photographs | Grading by Ultrawide Field Images | ||||||||
|---|---|---|---|---|---|---|---|---|---|
| Frequency | DR Absent | Mild NPDR | Moderate NPDR | Severe NPDR | Very Severe NPDR | PDR < High Risk | High Risk PDR | Ungradable | Total (%) |
| DR absent | 23 | 0 | 0 | 0 | 0 | 0 | 0 | 2 | 25 (12.5) |
| Mild NPDR | 2 | 36 | 4 | 0 | 0 | 0 | 0 | 5 | 47 (23.5) |
| Moderate NPDR | 0 | 2 | 55 | 0 | 1 | 1 | 0 | 2 | 61 (30.5) |
| Severe NPDR | 0 | 1 | 1 | 8 | 0 | 1 | 0 | 0 | 11 (5.5) |
| Very severe NPDR | 0 | 0 | 1 | 0 | 2 | 0 | 0 | 0 | 3 (1.5) |
| PDR < high risk | 0 | 3 | 3 | 5 | 2 | 34 | 0 | 0 | 47 (23.5) |
| High-risk PDR | 0 | 0 | 0 | 1 | 0 | 2 | 2 | 0 | 5 (2.5) |
| Ungradable | 0 | 0 | 0 | 0 | 0 | 0 | 1 | 0 | 1 (0.5) |
| Total (%) | 25 (12.5) | 42 (21.0) | 64 (32.0) | 14 (7.0) | 5 (2.5) | 38 (19.0) | 3 (1.5) | 9 (4.5) | 200 (100) |
| Grading by Dilated Retinal Examination | Grading by Ultrawide Field Images | ||||||||
|---|---|---|---|---|---|---|---|---|---|
| Frequency | DR Absent | Mild NPDR | Moderate NPDR | Severe NPDR | Very Severe NPDR | PDR < High Risk | High Risk PDR | Ungradable | Total (%) |
| DR absent | 19 | 5 | 1 | 0 | 0 | 1 | 0 | 3 | 29 (14.1) |
| Mild NPDR | 6 | 30 | 10 | 0 | 0 | 0 | 0 | 2 | 48 (23.3) |
| Moderate NPDR | 0 | 6 | 46 | 7 | 2 | 0 | 0 | 1 | 62 (30.1) |
| Severe NPDR | 0 | 3 | 6 | 7 | 3 | 2 | 0 | 1 | 22 (10.7) |
| Very severe NPDR | 0 | 0 | 0 | 1 | 0 | 0 | 0 | 0 | 1 (0.5) |
| PDR < high risk | 0 | 0 | 3 | 1 | 0 | 32 | 0 | 2 | 38 (18.5) |
| High-risk PDR | 0 | 0 | 0 | 0 | 0 | 3 | 3 | 0 | 6 (2.9) |
| Ungradable | 0 | 0 | 0 | 0 | 0 | 0 | 0 | 0 | 0 (0) |
| Total (%) | 25 (12.1) | 44 (21.4) | 66 (32.0) | 16 (7.8) | 5 (2.4) | 38 (18.4) | 3 (1.5) | 9 (4.4) | 206 (100) |
| Grading by 35-mm ETDRS Photographs | Grading by Ultrawide Field Images | ||||
|---|---|---|---|---|---|
| Frequency | DME Absent | DME | CSME | Ungradable | Total (%) |
| DME absent | 87 | 4 | 2 | 6 | 99 (58.9) |
| DME | 6 | 12 | 5 | 0 | 23 (13.7) |
| CSME | 11 | 5 | 24 | 2 | 42 (25.0) |
| Ungradable | 3 | 0 | 1 | 0 | 4 (2.4) |
| Total (%) | 107 (63.7) | 21 (12.5) | 32 (19.1) | 8 (4.8) | 168 (100) |
Stay updated, free articles. Join our Telegram channel

Full access? Get Clinical Tree


