Fig. 6.1
Flow chart detailing the basic steps of the split-spectrum amplitude-decorrelation angiography (SSADA) algorithm. Eight optical coherence tomography (OCT) repeated B-frames (M-B-frames) were scanned consecutively at the same spatial location to produce 8 spectral interferograms and 8 standard-resolution cross-sectional images. Using SSADA, each full spectral interferogram was split into 4 spectral bands creating 32 low-resolution interferograms. B-scan decorrelation of each split band yielded 28 decorrelation frames which were averaged to produce one final decorrelation-based flow cross section with improved quality
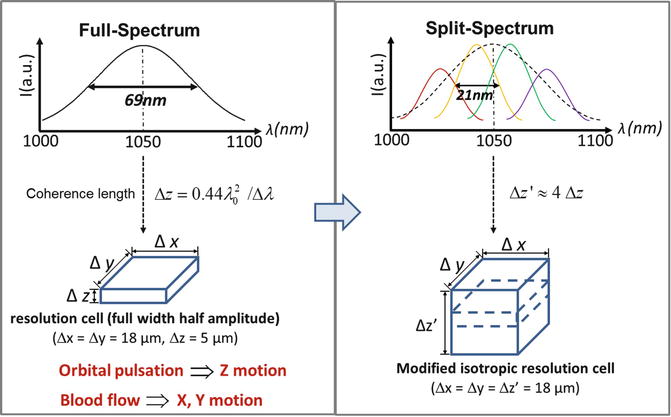
Fig. 6.2
Diagram of the modification of the optical coherence tomography (OCT) imaging resolution cell using the split-spectrum method. The resolution cell (x = y > z) in the current configuration can be modified into a new resolution cell (x = y = z′)
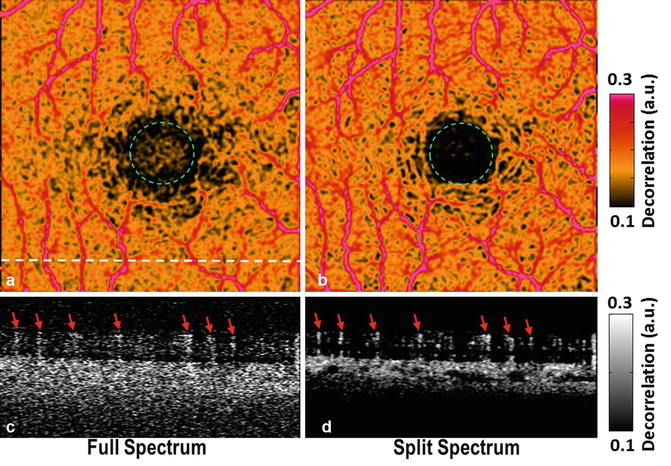
Fig. 6.3
Comparison of amplitude-decorrelation angiograms of the macula (3 × 3 mm area) using full-spectrum (a, c) and split-spectrum (b, d) algorithms. Three-dimensional (3D) angiography scans were acquired on a 100 kHz optical coherence tomography (OCT) prototype. With the novel split-spectrum algorithm, en face maximum decorrelation projections of the retinal circulation showed less noise inside the foveal avascular zone (FAZ, inside green dotted circles) and a more continuous perifoveal vascular network using the novel split-spectrum algorithm (b) compared to the standard full-spectrum algorithm (a). The signal-to-noise ratio (SNR), computed by dividing the perifoveal flow signal by the false flow signal in the FAZ, is 2.1 times higher using the split-spectrum algorithm [6]. The cross-sectional angiograms (scanned across the red dashed line in a) showed more clearly delineated retinal vessels (red arrows) and choroidal layers and less noise using the split-spectrum algorithm (d) compared to the standard full-spectrum algorithm (c)
Furthermore, the full OCT spectrum is split into several narrower spectral bands, resulting in an OCT resolution cell in each band which is isotropic and less susceptible to axial motion noise (Fig. 6.2). Creation of isotropic resolution cells having equal sensitivity to axial and transverse flow can be useful for quantifying flow. In other words, OCT angiography extracts flow information that can be further processed for quantification because the flow values generated by the isotropic resolution cells are a function of the flow velocity regardless of direction.
6.4 Retinal and Choroidal Circulation
The macular region of the fundus is responsible for central vision. Capillary dropout in the macular region due to diabetic retinopathy is a major cause of vision loss. Focal loss of the choriocapillaris is a possible causative factor in the pathogenesis of both dry and wet age-related macular degeneration [8], the leading cause of blindness in industrialized countries [9]. Thus, macular angiography is important.
The SSADA is used to demonstrate macular angiography of both the retinal and choroidal circulations in a normal eye (Fig. 6.4). The 3D SSADA data set comprises a stack of 200 averaged decorrelation cross-sectional images, along with the associated averaged reflectance images, that span 3 mm in the slow transverse scan (Y) direction (Fig. 6.4a). The 3D data is separated into retinal and choroidal regions with the dividing boundary set at the retinal pigment epithelium (RPE) (see yellow line in Fig. 6.4). The depth (Z direction) of the highly reflective RPE is identified through the analysis of the reflectance and reflectance gradient profiles [10]. The region above the RPE is the retinal layer, and the region below is the choroidal layer. The en face X-Y projection angiograms (Fig. 6.4b, c) are produced by selecting the maximum decorrelation value along the axial (Z) direction in each layer.
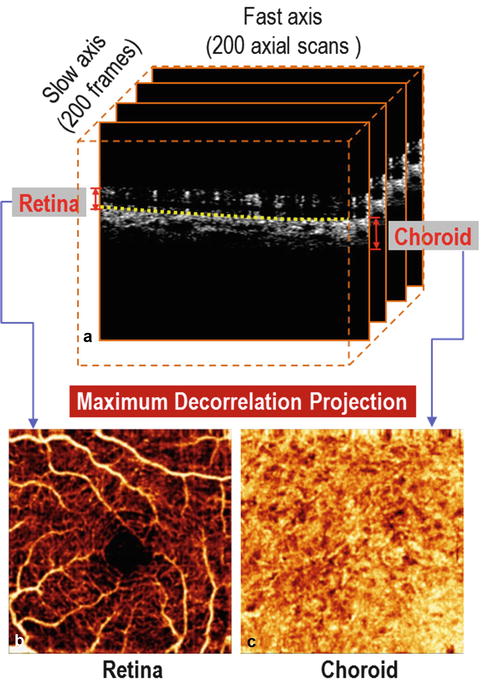
Fig. 6.4
Segmentation and processing of an optical coherence tomography (OCT) angiogram of a normal macula. (a) The 3D OCT angiogram comprises 200 frames of averaged decorrelation cross sections stretched along the slow scan axis. Each frame is computed using the split-spectrum amplitude-decorrelation angiography (SSADA) algorithm shown in Fig. 6.1. The angiogram spans 3 mm in all 3 dimensions. The cross-sectional angiogram shows the retinal and choroidal circulations along the retinal pigment epithelium (RPE) boundary (dotted yellow line). The retina and choroid were separately projected. (b) The retina angiogram shows the retinal vessels become smaller toward the fovea ending in parafoveal capillary net with no flow detected in the foveal avascular zone (FAZ). (c) The choroidal angiogram shows a near-confluent high-flow network
The flow pixels form a continuous microcirculatory network in the retina. The vascular network is absent in the foveal avascular zone (Fig. 6.4b) of approximately 600 μm diameter, in agreement with known anatomy. There are some disconnected apparent flow pixels within the foveal avascular zone (Fig. 6.4b) due to noise. The choriocapillaris layer forms a confluent overlapping plexus [11], so it is to be expected that the projection image of the choroidal circulation shows confluent flow (Fig. 6.4c).
Based on the decorrelation seen in the gray scale, the flow in the inner choroid has higher velocity. The volume is also greater than the retinal circulation, again consistent with known physiology that the choroidal circulation has much higher flow than the retinal circulation [11]. There are signal voids in the outer choroid that may be due to fringe washout from high flow velocity and the shadowing effect of overlying tissue. The cross sections also show a few spots of decorrelation in the RPE layer. These must be artifacts because the RPE is avascular. This is likely due to the projection of flow decorrelation in a proximal layer (i.e., inner retinal layers) onto distal layers which have a strong reflected signal (i.e., RPE).
Stay updated, free articles. Join our Telegram channel

Full access? Get Clinical Tree


