Near-Infrared Fundus Autofluorescence
Ulrich Kellner
Simone Kellner
Fundus autofluorescence (FAF) derived from lipofuscin and its major fluorophor, A2E, has developed into an important noninvasive imaging technique in the last decade. When interpreting images in normal and disease states, one must keep in mind that several different fluorophores are present within the retina and the retinal pigment epithelium (RPE) (see also Chapters 1, 2 and 3) (1,2). A specific selection of the wavelength for excitation of AF and the wavelength of the cutoff filter for emitted light could provide additional possibilities for noninvasive imaging of the RPE.
Near-infrared autofluorescence (NIA) imaging, which uses the same excitation light and cutoff filters employed for indocyanine-green (ICG) angiography, is widely available. NIA was first described as pseudofluorescence prior to ICG angiography (3). The intensity of the emitted AF is about 60-100 times lower compared to that of AF (2), but imaging can be reliably repeated.
NIA imaging was first reported in 2006, and has been applied in several recently published studies (2,4, 5, 6, 7, 8, 9, 10, 11, 12, 13, 14, 15). This chapter describes the imaging technique, the origin of the NIA signal, the distribution of NIA in the healthy eye, and the clinical findings in selected retinal diseases and their implications.
IMAGING TECHNIQUE
Imaging of NIA can be done using a confocal scanning laser ophthalmoscope (cSLO, Spectralis HRA; Heidelberg Engineering, Heidelberg, Germany) (2). Different camera objectives provide either a 30-degree or wide-angle field-of-view mode. The image resolution is usually 768 × 768 pixels, but it can be varied. Focusing is achieved using the near-infrared reflectance mode at 815 nm. Diode laser light (787 nm) is used to excite AF. A band-pass filter with a cutoff at 800 nm included in the system is inserted in front of the detector. Six pictures per second are recorded and about 15 single images are averaged depending on the fixation of the patient (Fig. 6.1). Because of the lower-intensity signal, optimal imaging is performed with dilated pupils. Cideciyan et al. (5) reported a technique termed near-infrared reduced-illuminance AF imaging (NIR-RAFI). Although they reduced the illuminance for FAF in their HRA2, they used the same manufacturer settings for NIR-RAFI as described above.
NIA images are evaluated qualitatively on a computer monitor. Abnormalities of NIA distribution are documented and classified as either increased, reduced, or absent NIA compared to other areas within the same image. Interindividual differences in media transmission properties due to the presence or absence of cataract, after cataract, or moderate vitreous opacities, and the associated difficulties with normalization in a clinical setting preclude an easy quantification of NIA intensity. Image
postprocessing with different programs and quantification of NIA images has been suggested in research settings (2,5).
postprocessing with different programs and quantification of NIA images has been suggested in research settings (2,5).
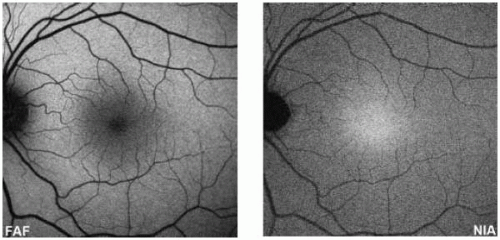 FIGURE 6.1. Normal distribution of FAF as recorded using conventional AF imaging and NIA imaging. At the posterior pole, AF shows the highest intensity in the perifoveal area with a decrease toward the fovea. In contrast, NIA has a peak intensity in the foveal area with a decrease toward the periphery. More peripherally, AF and NIA distributions are homogeneous. |
ORIGIN OF THE NIA SIGNAL
The major fluorophore contributing to NIA is most likely melanin and its related compounds (melanolipofuscin, melanolysosomes, and oxidized melanin) in the RPE cells (2). A low-intensity signal is obtained from melanin in the deep choroid, which can be detected in areas denuded of RPE cells (i.e., geographic atrophy).
The notion that the NIA signal derives from melanin is based on the following evidence: The distribution of NIA seems to correspond to that of RPE melanin (16), although the contribution of choroidal melanin is evident (2). The severely reduced NIA signal in areas of RPE loss indicates that the major source for NIA is the RPE. The markedly increased NIA signal in choroidal nevi supports the view that NIA is derived predominantly from ocular melanin (see Chapter 15). Melanin absorption decreases with increasing wavelength (17,18). AF emission spectra of melanin granules of human RPE have been mostly examined for shorter wavelengths (17,19). At wavelengths used for conventional AF imaging (<500 nm), melanin AF is present but with much lower intensity compared to lipofuscin. For synthetic melanin and melanin in the skin, AF with a maximum at 870-900 nm was demonstrated after excitation at 785 nm (20). Melanin AF is increased with oxidation (18,21,22). Melanolipofuscin (melanin with a cortex of lipofuscin) and melanolysosomes (melanin with a cortex of enzyme-reactive material) accumulate with age and may represent melanin in the process of repair, modification, or degradation (23). The AF of melanolipofuscin is intermediate between melanin and lipofuscin (19). In summary, AF of melanin, oxidized melanin, and compound granules containing melanin contribute to the NIA signal.
Keilhauer and Delori (2) thoroughly discussed the possible contributions of other fluorophores to the NIA signal. Even for conventional AF imaging, only a few fluorophores within the lipofuscin complex (A2E, cis-isomers of A2E, and all-trans-retinal dimer conjugate [24, 25, 26]) have been clearly characterized (see also Chapter 3). Other fluorophores may be present, and the composition of fluorophores within the
lipofuscin granules may differ among different diseases (1,26). Although the possibility that lipofuscin fluorophores contribute to the NIA signal cannot be ruled out, that is unlikely based on the different AF distributions observed in normal individuals and in patients with a variety of retinal disorders when imaged using conventional AF and NIA. Other possible fluorophores include collagen, elastin, and porphyrin. Porphyrins within the blood vessels do not emanate detectable AF, but a contribution to NIA in hemorrhages cannot be excluded (3,4). The emission spectra for collagen and elastin (27) have not been examined with near-infrared light. A major contribution of these other fluorophores to NIA is unlikely (2).
lipofuscin granules may differ among different diseases (1,26). Although the possibility that lipofuscin fluorophores contribute to the NIA signal cannot be ruled out, that is unlikely based on the different AF distributions observed in normal individuals and in patients with a variety of retinal disorders when imaged using conventional AF and NIA. Other possible fluorophores include collagen, elastin, and porphyrin. Porphyrins within the blood vessels do not emanate detectable AF, but a contribution to NIA in hemorrhages cannot be excluded (3,4). The emission spectra for collagen and elastin (27) have not been examined with near-infrared light. A major contribution of these other fluorophores to NIA is unlikely (2).
Histological examination of photoreceptors and RPE in retinal degenerative disease is of limited value for comparison with NIA images. First, primarily tissue obtained from patients with advanced stages of disease has been available for histological studies. Second, histological reports often focus on lipofuscin distribution, whereas melanin distribution is rarely mentioned. As discussed below, the available information on RPE melanin alterations in Stargardt disease, retinitis pigmentosa (RP), and age-related macular degeneration (AMD) are in accordance with NIA findings in these disorders.
NORMAL NIA
The optic disc and retinal vessels appear dark on normal NIA images (Fig. 6.1). The NIA signal remains relatively even from the mid-peripheral to the peripheral retina. At the posterior pole, the NIA signal is maximal, with a peak at the fovea and a marked decline of NIA intensity toward the perifoveal region. Large choroidal vessels are visible with NIA in about 5% of normal individuals. The distribution of NIA differs strongly from that obtained using conventional AF imaging (see also Chapters 3 and 9).
The distribution of NIA intensity varies among individuals. At present, the influence of aging on NIA imaging is unknown. An age-related decrease in the ratio of foveal to perifoveal NIA has been observed (2). Age changes are difficult to predict. The melanin content in the RPE cells decreases with age, but the fluorescence of melanin granules increases especially to longer wavelengths (17,19,28). With increasing age, pure melanin granules are increasingly transformed to melanolipofuscin or melanolysosomes, but melanin synthesis also occurs (28, 29, 30). It can be assumed that the result of these opposing age-related effects on melanin and its compounds may be variable.
Stay updated, free articles. Join our Telegram channel

Full access? Get Clinical Tree


