Molecular Biology and Genetics of the Retina
John M. Nickerson
J. Fielding Hejtmancik
In this chapter we provide reference material to provide the resident and clinical ophthalmologist with an adequate knowledge base to follow the rapid advances in the field of molecular biology and genetics of the retina and eye. Many of these advances are developed to the point at which the clinical practitioner needs to be aware of definitive genetic tests for certain ophthalmic diseases and the technical approaches that underlie them. He or she should know how these tests are performed and the caveats associated with these tests. Thus, the function of this chapter is to provide a primer for the fundamentals of molecular biology including both current and some historical techniques, examples of the application of molecular biology to fundamental research on the basics of the visual system, applications to specific retinal diseases and degenerations, and finally a discussion of techniques in genetic linkage and association tests. This chapter is not intended to replace a survey course in molecular biology, nor to provide detailed protocols to carry out these techniques. Several excellent texts1,2 and laboratory manuals3,4 provide much more thorough treatments. Also, this chapter is not meant to be encyclopedic on all the current topics of retinal molecular biology. We only touch on a comparative handful, beginning with a few definitions.
OVERVIEW OF TERMS AND TECHNIQUES
Molecular Biology
Molecular biology is the study in detail of polymers of nucleic acids (DNA and RNA) that encode gene products, largely proteins. It includes the study of the control and regulation of gene expression. To quote Horace Freeland Judson, “Molecular biology is a discipline, a level of analysis, a kit of tools—which is to say, it is unified by style as much as by content. The style is unmistakable. The style is bold; it is simplifying; it is unsparing; often it is extremely competitive. The style is also, sometimes, subtle and sophisticated.”5
DNA
DNA is the fundamental genetic material that encodes genes. DNA, in almost all forms of life, is replicated and passed from one generation to the next. Information is stored in DNA by the sequence of the bases in the molecule: adenine (A), guanine (G), cytosine (C), and thymine (T). By convention the sequences from left to right are the 5′ to 3′ orientation of the sense strand of the DNA molecule, where 5′ is the fifth position on the deoxyribose and the 3′ refers to the third carbon atom of deoxyribose. Information about a gene product is stored as triplets of the bases. The genetic code decodes the triplets of bases, translating the DNA sequence through its messenger RNA (mRNA), an RNA copy of the DNA sequence, into an amino acid sequence. The amino acid sequence folds into a three-dimensional (3D) structure, forming a protein that is capable of some biologic function; these proteins in sum constitute the bulk of physiologic cellular machinery.
Recent advances in genetics and molecular biology have challenged some basic tenets of the field. Classically, it has been felt that proteins, rather than DNA or RNA, are the majority of this machinery. However, although this is generally the case, there are several notable exceptions to this principle that have been emphasized by recent advances.6 These include ribozymes, microRNAs, and others.7 Because RNA can serve both informational and catalytic roles, it has been postulated that it might in fact be the evolutionary forerunner of both proteins and DNA.8 In addition, it has become apparent that not only the sequence of bases along the DNA molecule but also modifications to the DNA bases and their associated histone and nonhistone chromosomal proteins can be used to transmit information across generations.9 Although most molecular biologic observations can be explained using classical concepts, these new findings are causing a basic reassessment of the fundamental tenets of molecular genetics and biology.
Restriction Enzymes
The discovery of restriction enzymes by microbiologists studying Escherichia coli and other bacteria provided a foundation for modern molecular biology. These enzymes, which are found in various prokaryotes, cut the DNA double helix at specific base sequences or sites. These sites are short but specific DNA sequences of four to eight bases in length. The natural function of a restriction enzyme is to degrade the DNA of invading viruses in order to protect the bacterium from infection. For example, the restriction enzyme EcoRI recognizes the sequence GAATTC in DNA and cleaves the DNA between the G and the first A. There are currently in excess of 3,800 restriction enzymes possessing about 300 distinct sequence specificities. Of these restriction enzymes, over 640 are commercially available with over 230 distinct sequence specificities.10 These are well documented in RE Base <http://rebase.neb.com> Restriction endonucleases usually recognize sequences that are palindromic (reading the same forward and backward).
When these enzymes cut the DNA strands in the middle of recognition sequences, blunt ends are formed. When the strand scissions are offset, overlapping singlestranded ends of two or four bases are created. These “sticky ends” can occur with an overhang of the 3′ strand (e.g., as produced by the restriction enzyme, Pst I) or with the 5′ strand (e.g., as with EcoRI). Because any sticky ends created by digestion with the same restriction enzyme can reanneal readily under the proper conditions, these enzymes provide a powerful tool for inserting foreign DNA fragments into many vectors or other constructions. This allows virtually all sequences from the human genome to be cloned (inserted into plasmid, bacteriophage, or other vectors and replicated usually in bacteria) so that large amounts can be isolated in pure form.
One way in which bacteria protect their own DNA from digestion with their restriction endonucleases is with methylases that recognize and add a methyl group to the same sequences as those recognized by the corresponding restriction endonuclease. That sequence, once methylated, is no longer a target for some restriction endonucleases. Some restriction endonucleases are not inhibited by methylation, and these can recognize exactly the same sequences as their homologs that are inhibited. Two restriction enzymes that recognize the same base sequence but are isolated from different organisms are called isoschizomers. Just as isoschizomers may or may not react similarly to methylation, they may not cut the DNA strands at the identical site within the recognition sequence, and thus they may not produce identical ends compatible for cloning.
Although these differences are of more central concern to cloning and rearranging DNA fragments, they can also be important in gene mapping. For example, the use of a methylation-sensitive restriction endonuclease for the analysis of restriction fragment length polymorphisms (RFLPs) might suggest genetic (DNA sequence) polymorphism when none exists. Methylation plays a role in gene expression in higher eukaryotes, and the use of pairs of isoschizomers, one of which is inhibited by methylation, is a means of assessing gene inactivation. Usually a gene that is not expressed in a given tissue is methylated, whereas the same gene is not methylated in a tissue where the gene’s expression is needed.
Recombinant DNA Technology
Recombinant DNA technology is the set of techniques and tools used by molecular biologists to manipulate DNA molecules. In simplest form, “recombinant DNA technology allows us to prepare large amounts of pure DNA of a homogeneous sequence.” We illustrate the technology with the example of a procedure called subcloning, shown in Figure 19A.1. We begin with a DNA sequence of interest, for example, just a part of a gene or complementary DNA (cDNA) that will be “inserted” into a second usually larger piece of DNA, called a “vector,” which is used to propagate the gene fragment. Vectors are usually derived from bacterial viruses (bacteriophage) or bacterial plasmids, small double-stranded DNA circles commonly found in bacteria that replicate autonomously from the bacterial DNA. The vectors usually have been manipulated to delete parts of the parental plasmid or virus and frequently have had other genes added to them depending on their specific application. To subclone the gene fragment into a different vector, some sequence information or knowledge of the positions of restriction enzyme recognition sites is required. The sequences of the vectors are usually known. Using a desktop computer and DNA sequence analysis software or online in web browsers at numerous sites, restriction enzyme sites in sequences can be identified readily. The choice of the enzymes depends on the availability of compatible ends that border the “insert” to be subcloned, the absence of extra internal sites in the insert, and compatible sites in the vector. Having cleaved the gene fragment with a restriction enzyme, the DNA fragments of DNA can be purified by any of several techniques including electrophoresis, differential precipitation, or chromatography. The purified DNA fragment can be introduced into a specialized vector that has a compatible restriction enzyme site in an appropriate location. The two DNA molecules are mixed in roughly equimolar amounts, and the enzyme T4 DNA ligase is added. This enzyme will join covalently the 5′ phosphate from the end of one DNA molecule to the 3′ hydroxyl of another DNA fragment. When both ligations (one from each end of the two molecules) have been completed, we will have created a circular DNA molecule bearing a copy of the vector and the insert. By judicious choice of conditions in the previous ligation reaction, the fraction of aberrant molecules can be minimized but not totally eliminated. Important examples of these unwanted circular molecules include a single copy of the vector with two or more inserts and others that have no insert.
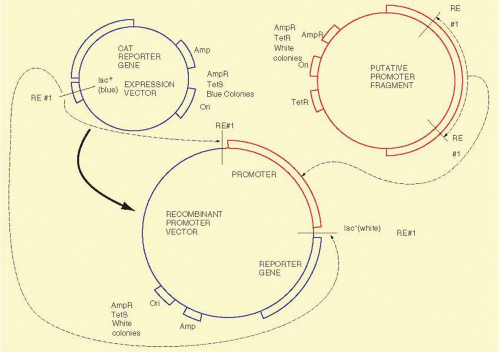 FIG. 19A.1 Subcloning of a DNA fragment, in this case containing a putative promoter fragment, from one clone into another vector. Judicious selection of an appropriate restriction enzyme yields a recombinant plasmid containing the inserted promoter fragment in the recombinant plasmid. Drug resistance markers are located on each of the plasmids, allowing selection of the appropriate plasmid after bacterial transformation. The plasmids contain enough markers so that it is easy to discriminate among the three plasmids shown on the figure. The expression vector contains the β-lactamase gene, which allows bacteria containing this plasmid to grow in the presence of ampicillin. This plasmid also contains the gene for β-galactosidase. In the presence of a substrate called X-gal, colonies containing this gene will turn blue. The restriction enzyme site for RE #1 is within this gene, and when a fragment is successfully cloned into this site, the gene is interrupted and is no longer capable of functioning to convert the substrate, X-gal, into the blue product. Thus, colonies with the insert in the expression vector will be white: Bacterial colonies that are TetR and AmpR (tetracycline resistant and ampicillin resistant) result from the original plasmid containing the promoter fragment. Neither of the other plasmids (the expression vector or the recombinant vector) contains the TetR gene, and they will be TetS (sensitive to tetracycline), so colonies containing these plasmids will fail to grow on plates containing tetracycline. To select the appropriate colonies, we plate the initial transform ants on Amp plates containing X-gal. One day later we will pick the white colonies. We will replate them on Amp plates in an ordered pattern and on Tet plates in the same ordered pattern. Those that are AmpR, white, and TetS is will be the colonies that contain the appropriate plasmid. We will verify the legitimacy of the plasmid by preparing a small amount of the plasmid from these colonies and digest the plasmid with RE # 1, the restriction enzyme that we used to make the construct. Valid constructs should give us the two identical sized fragments that we used to make the recombinant plasmid. |
The next step, bacterial transformation, introduces the vector-insert recombinant plasmid into bacterial cells. This can be done by chemical treatment or by electroporation, both of which open small pores in the bacterial plasma membrane, allowing the DNA to enter the cell. Once in the bacterium, the plasmid replicates independently of the host cell DNA and continues to do so well after the cell stops growing. Depending on the particular plasmid, each bacterial cell might contain several to hundreds of copies of the plasmid. Usually the vector DNA contains an antibiotic resistance gene, such as β-lactamase, that allows a transformed bacterial cell harboring the recombinant plasmid to grow in media containing an antibiotic, ampicillin in this case. By plating the bacteria on petri dishes containing a rich medium including ampicillin, only resistant bacteria (those carrying the plasmid) will grow enough to form appreciable colonies in a day or so. The transformation events are rare enough so that individual colonies can be chosen, selected with a sterile loop or toothpick, and replated. Thus, in only 1 to 2 days, a single bacterial colony can be purified to homogeneity that bears a single pure plasmid. A milligram of the plasmid can be purified readily from a 1-L culture of the isolated bacteria. This quantity is usually sufficient to last over 1 year.
Southern Blotting
Digestion of a small plasmid (e.g., pBR322 which is 4,362 bp in size) with a restriction endonuclease produces a small number of fragments of discrete size. By subjecting the digested DNA to agarose gel electrophoresis, these fragments can be separated by their sizes, and afterward detected visually with ethidium bromide staining. Ethidium bromide binds to DNA, and when bound ethidium bromide fluoresces intensely under UV light. In electrophoresis, the electric field moves DNA fragments through the meshwork of agarose fibers. The agarose matrix impedes larger DNAs more than smaller fragments so that small DNAs migrate faster than the larger fragments. After electrophoresis and staining, the resulting DNA fragments appear as an array of bands on the agarose gel with the larger fragments near the starting point and smaller fragments progressively nearer the anodal end of the gel. The set of bands is a fingerprint characteristic of the plasmid that was digested with the one restriction enzyme. It is easy to compare different plasmids digested with the same enzyme by running the digests on adjacent lanes of an agarose gel.
To learn whether a DNA sample, for example, the insert of a plasmid, contains some or all of a gene or to learn whether the insert is a faithful representation of the gene in a human being, it is often necessary to evaluate human DNA on an agarose gel. When DNA isolated from humans or other higher eukaryotes is digested with a restriction enzyme, the result appears as a broad smear from top to bottom of the gel. This is because the human genome contains 3 × 10⁹ base pairs (the number of unique nucleotides present in a haploid set of human chromosomes). For a restriction endonuclease recognizing a sequence of six nucleotides, assuming recognition sites are randomly distributed approximately once every 4 kilobase (kb) pairs in the genome, resulting in roughly 7.5 × 10⁵ different DNA fragments. The individual fragments lie so close together that they appear as a smear on an ethidium bromide-stained gel. Clearly, if an individual fragment is to be identified, a means other than ethidium bromide staining is required to locate the band on the gel.
The double-stranded nature of DNA, with Watson Crick base pairing between the two strands containing complementary sequences, provides an ideal means to identify specific DNA fragments. After being run on an agarose gel, the DNA fragments are denatured to separate the complementary strands and then transferred from the agarose gel onto a support membrane, either nitrocellulose or more commonly nylon (Fig. 19A.2). The transfer can occur by capillary action (the classic Southern blot), vacuum, pressure, or electric current. Although the initial binding of DNA to membrane is reversible (unless the transfer is performed in alkaline buffer), fragments can be covalently attached by baking, ultraviolet irradiation, or drying.11 The DNA fragments are immobilized on the membrane in a denatured state and in a position precisely corresponding to their locations on the agarose gel.
Specific DNA fragments are identified by annealing with a probe that has been labeled with radioactive phosphorus or fluorescent nucleotides. The probe is usually a piece of cloned DNA isolated from a vector. The probe is denatured into its two strands just before application to the membrane. This allows each strand of the probe to anneal to the denatured DNAs bound to the membrane. Radioactive nucleotides are incorporated into probes in several ways. Nick translation involves nicking one strand of the DNA double helix with DNase I and then elongating from this point by E. coli DNA polymerase I replacing one strand with radioactive nucleotides. In random priming, a mixture of many different oligonucleotides, usually hexamers, is annealed to denatured DNA strands to serve as a primer for elongation of the templates. The latter technique has the advantage of giving very high-specific activities (usually >109 cpm per μg with 32P-labeled nucleotides) and can be used to label DNA fragments in low-melting point agarose directly after excision from an electrophoretic gel. Various alternative means to label probes, including production of a single-stranded probe with M13 phage or riboprobes (labeled RNA probes), is useful in special circumstances. When oligonucleotides are used as probes, they are simply end-labeled with polynucleotide kinase, which transfers the γ-phosphate (usually radioactive 32P) of ATP to a 5′ hydroxyl group in DNA. For many techniques, fluorescently labeled deoxynucleotides can be used instead of radionuclides, providing greater convenience, avoiding the problems inherent in handling radioactivity, but usually with some decrease in sensitivity.
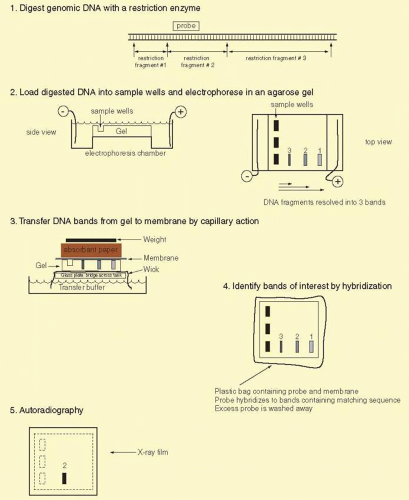 FIG. 19A.2 Southern blot analysis. To identify a specific genomic DNA fragment among the hundreds of thousands of restriction enzyme fragments in the human genome, we use the Southern blotting technique.11 The approach consists of several steps illustrated above. Genomic DNA is prepared and digested with any of several restriction enzymes. The DNA fragments are separated by size on agarose gel electrophoresis. The smaller fragments migrate faster through the agarose fiber meshwork. The fragments of interest can be identified by hybridization with a labeled probe. The DNA bands are first transferred out of the agarose onto a nitrocellulose or nylon membrane by capillary action. The DNA fragments can be permanently attached to the membrane by heat or ultraviolet light treatment. A radiolabeled DNA probe (e.g., a denatured cDNA) in single-stranded form can anneal by base pairing to its counterpart on the membrane. Excess probe DNA is washed off the filter, and by autoradiography of the filter we can visualize the specific DNA band or bands matching the probe. The Southern procedure allows us to detect and measure the size of one or a few DNA fragments out of the millions of different genomic DNA fragments produced by digestion with a given restriction enzyme. |
The probe, if initially double stranded, is denatured thermally or by adjustment to an alkaline pH before hybridization. It is added to a suitable hybridization medium and allowed to anneal to the target DNA immobilized on the blot. Annealing or hybridization takes place best at approximately 5°C below the melting temperature (Tm) of the probe-target complex. This Tm can be influenced by the hybridization solution in several ways. It will increase in proportion to the logarithm of the ionic strength of the solution. It will decrease in the presence of formamide or other denaturant. The Tm is influenced by the length of the probe and the percentage of bases that are G and C. G:C base pairing is more stable than A:T base pairing. A general formula for the Tm of a hybrid is
Tm = 81.5°C – 16.6(log10[Na+]) + 0.41(%G + C) – 0.63(%formamide) – (600/probe length)
where [Na+] is the sodium ion concentration in molar dimension and probe length is in base pairs.
In addition, the Tm of a hybrid is decreased by 1°C to 1.5°C for each percent of mismatch between the probe and its target sequence. Hybrids formed by RNA are slightly more stable, so an RNA-DNA hybrid might melt at a temperature as much as 10°C above the corresponding DNA-DNA hybrid. Finally, short oligonucleotides approximately follow a different rule:
Tm = 2(A + T) + 4(G + C)
where each letter represents the number of that particular base in the oligonucleotide. For example, the Tm of a 20-mer with four A’s, six G’s, five C’s, and five T’s, is 62° C. In practice, various computer programs are available for PCR primer design, many online, to provide accurate estimates of these parameters.
There are several protocols for hybridization in common use, each of which works well if used appropriately. These protocols have several ingredients in common. Ionic strength (Na+ concentration, other monovalent cations) and denaturants such as formamide influence the stability of specific hybrids. A second group of components including detergents (especially sodium dodecyl sulfate) and charged species (such as bovine serum albumin, polyvinyl pyrolidone, and ficoll in Denhardt’s solution) tend to decrease nonspecific binding of the probe to the membrane, which is usually dependent on charge phenomena. Finally, components such as herring sperm DNA are designed to decrease nonspecific binding of repetitive elements in the probe to target DNA. Probes that contain repetitive elements can also be preannealed to a low-Cot value with sheared human DNA so that these sites in the probe are “protected” and cannot recognize repetitive DNA on the membrane-immobilized target DNA. This preannealing step blocks the repetitive elements in the probe so that only unique sequences of the probe are available to hybridize to DNA bound on the membrane. This decreases nonspecific binding when the probe is used for hybridization. Dextran can be included to increase the rate of hybridization. Usually the probe is incubated with a filter overnight to assure the specific hybridization of the probe to the filter-bound DNA to reach equilibrium.
After hybridization of the probe to filter-bound DNAs, excess nonspecifically bound probe is rinsed off by a series of incubations in large volumes of buffer. Initially, nonstringent washes are performed. These buffers are usually approximately 300 mM salt and near room temperature. These preliminary washes remove most excess radioactive probe. The nonstringent washes are followed by stringent washes. The stringent washes are conducted at elevated temperature, near the Tm of the probe. The buffer for a stringent wash contains about 15 mM salt, and the wash temperature is at 52° C to 68° C for 20 minutes. There are two to four changes of the stringent buffer. Under these conditions only tightly and specifically bound probe remains attached to the filter. Afterwards, the membrane with the specifically bound probe is wrapped in saran wrap or sealed in a plastic pouch, placed in a light-tight cassette on a piece of X-ray film (autoradiography), and left to expose the film for 1 to 2 days. Usually, two intensifying screens are placed in the cassette to shorten exposure time. To reduce reciprocity failure of the film, the exposure is normally carried out at -80° C. This low temperature reduces thermal decay of the first of the two interactions required for a latent image to form in the film. The image on the developed film identifies the hybridizing DNA bands. The comparison of cloned gene fragments with authentic human DNA can validate the cloning process and show whether the entire gene was cloned. Also, the Southern blotting process11 can show differences among individuals at particular genetic loci, which can be used in linkage analysis as discussed later, or in the identification of mutations that cause inherited diseases.
Besides the classic agarose gel electrophoresis method, other techniques of separating large fragments of DNA have been devised. Pulsed-field and field inversion gel electrophoresis allow separation of extremely large DNA fragments. These electrophoretic techniques are discussed later. Once these gels are run, a similar Southern blotting approach can be used to identify a specific large DNA fragment. These combined approaches have been useful in analyzing BAC and YAC clones, which contain large DNA inserts.
cDNA Libraries, Genomic Libraries, and Library Screening
Although library construction and screening are infrequently used today, these tools illustrate important concepts that are in application in high throughput formats today. Generally, the cloning process has been supplanted by a form of single molecule amplification. In essence, these old construction and screening methods employed a bacterial cell to perform the amplification process before PCR and other approaches became highly efficient. Library construction and screening are still necessary for species in which little fundamental knowledge is known or where sequencing information is incomplete. These techniques are described because they best illustrate most of the fundamental procedures of modern molecular biology. Within a given tissue, only a small fraction of the genes of the whole genome is expressed. In the retina, opsin mRNA makes up about 2% of the total mRNA, and interphotoreceptor retinoid-binding protein mRNA accounts for approximately 0.1%. Perhaps as few as 10,000 different mRNAs are expressed in the retina, whereas there are approximately 25,000 genes expressed in the body at different times. (Different splicing patterns of a gene may add considerable complexity to the spectrum of RNAs that are expressed spatially and temporally.) A cDNA library is a hopefully complete collection of DNA copies of these mRNAs that have been cloned in an appropriate vector. The process of constructing such a library is shown in Figure 19A.3. The key step is the conversion of RNA to DNA by the enzyme reverse transcriptase. Reverse transcriptase requires a double-stranded region to initiate the synthesis of DNA. A synthetic DNA oligonucleotide can serve as a primer for the reverse transcriptase. This primer anneals to the mRNA providing the necessary double-stranded region. In many cases, the primer used is oligo(dT). This primer can base-pair to a poly(A) stretch at the 3′ end of most mRNAs, and poly(A):oligo(dT) provides the double-stranded region that reverse transcriptase needs. The initial DNA copy of the RNA is converted to double-stranded DNA by the Klenow fragment of DNA polymerase I. Similar steps to prepare cDNA copies of mRNA are used for quantitative RT-PCR described later in the section on the “Polymerase Chain Reaction.” Also, similar steps are used to prepare a library for next generation sequencing of RNAs found in a given tissue, and this is referred to as RNA-Seq; see the section entitled “Next Generation Sequencing” later. Several different alternatives can be used to modify the ends of the cDNA to make it compatible with cloning vectors. Here we illustrate the use of tailing reactions with terminal deoxynucleotidyl transferase. The remaining reactions are similar to the subcloning strategy shown in Figure 19A.1. The main difference is that we are now treating a mixture of thousands of different cDNAs in the same way as we previously treated the single homogeneous DNA insert. Because of the greatly increased number of different inserts, the steps of ligation into the vector and transformation must be efficient to ensure that no mRNA molecule or its corresponding cDNA is lost from the library. Another way to minimize these losses is to make very large cDNA libraries, with 107 or more clones. Such a large library is redundant, having many copies of the same mRNAs, but these libraries should be relatively complete, hopefully with greater than 95% of all possible mRNAs represented in them. The ligation of the cDNA to the vector usually allows for only one cDNA per vector molecule. Thus, colony isolation and purification produces one pure cDNA from one pure bacterial colony or phage plaque. Although the clones in most cDNA libraries directly reflect the frequencies of various mRNAs in the tissue of origin, special techniques allow the construction of libraries containing sequences unique to a specific tissue or developmental stage (subtraction libraries) or with roughly equal representation of all mRNAs found in a tissue (normalized libraries).
To find a cDNA clone among the thousands or millions of other clones represented in a library requires ingenuity. One classic method to identify a cDNA clone coding for a specific protein is illustrated in Figure 19A.4. Antibodies produced against the protein for which a cDNA is sought may bind to antigens that are produced as a fusion protein that is expressed in E. coli. The fusion protein is encoded by the cDNA that has been inserted into an expression vector, here λgt11. (Parts of the fusion protein are encoded by the vector.) The antibody-antigen reaction can be detected by a color reaction, which generates a spot on a replica of the surface of a petri dish covered with plaques. The location of the recombinant phage that contains the cDNA we want to isolate is where a colored spot coincides with a plaque. Multiple rounds of plaque purification ensure that the clone is homogeneous. Several other schemes and strategies also yield the desired clones:
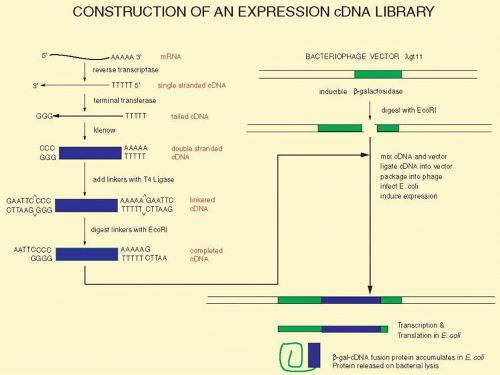 FIG. 19A.3 Construction of a cDNA library. To clone a large group of cDNAs from a given tissue, such as the retina, we begin with a few milligrams of RNA. Only approximately 0.5% to 5% of the total RNA represents mRNA; the bulk of the RNA is ribosomal and tRNA. Reverse transcriptase copies the mRNA into single-stranded DNA, cDNA. This is converted to double-stranded DNA by the Klenow fragment of DNA polymerase I. Linkers are ligated to the ends of the cDNA. When digested with a restriction enzyme, such as EcoR I, these give sticky ends compatible with similarly digested vector. The thousands of different cDNAs are mixed with an excess of the digested vector, and T4 ligase is added. In suitable conditions only one cDNA will be ligated into each vector molecule. The recombinant vector, λgtll with a cDNA, is packaged to reconstitute viable bacteriophage and can be grown on agar plates seeded with enough E. coli to form a uniform lawn of cells over the surface of the plate. Because of the design of the vector, the infected E. coli will produce some protein derived from the cDNA. This protein also contains some amino acid sequences from the vector, and the protein is a hybrid of bacterial β-galactosidase and the polypeptide from the cDNA. This is called a fusion protein. The group of bacteriophage resulting from the insertion of the individual cDNAs into the vector molecules is called a cDNA library. |
Expression of pooled cDNA clones followed by functional biologic tests of the expressed proteins. The pools are then broken down into smaller and smaller pools until a unique clone is identified.
The use of a degenerate oligonucleotide probe. By reversing the genetic code, we can obtain a set of potential oligonucleotides that might encode the protein for which we seek the cDNA. This strategy depends on the prior determination of at least some amino acid sequence of the protein that we want.
Hybrid-selection. Specific mRNAs bind to the filter-bound cDNA clones, and the specifically bound mRNAs can be eluted later in purified form. The resulting RNAs can be translated and analyzed.
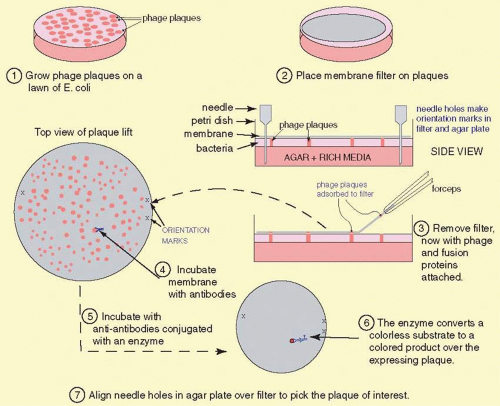 FIG. 19A.4 The cDNA library screening process. cDNA libraries contain millions of different bacteriophage particles. To find the one bacteriophage out of the millions that contain the cDNA of interest requires an efficient and rapid technique to simultaneously analyze (nondestructively) all of these different cloned molecules. The procedure begins with the library plated on Petri dishes. Typically up to 500,000 phages might be grown on each 10-cm plate. A nitrocellulose filter is placed on the top of the plate. This adsorbs some of the material on the surface of the dish, including bacteria, phage, and debris from lysed bacteria. This adsorbed material also includes some of the fusion protein expressed by bacterial cells before lysis kills an infected cell. This fusion protein leaks out of the bacterial cell, and some of the fusion protein will absorb onto the nitrocellulose filter where the plaque is located. For orientation purposes, marks are made in the filter and the Petri dish with a syringe needle. These are needed to align the processed filter and the master plate to pick out the phage plaque with the positive signal on the filter. To detect the positive plaque, we incubate antibodies raised against the protein for which we want the cDNA clone. These antibodies bind to the fusion protein containing antigenic determinants common between it and the protein. Excess antibodies are rinsed off, leaving only the antibodies bound to the specific fusion protein. Again, these are located on the filter positioned directly over the spot where the plaque producing the fusion protein is on the plate. Second antibodies (anti-antibodies) conjugated with an enzyme such as alkaline phosphatase are incubated with the filter. After rinsing off excess antibodies, a substrate, which produces a colored product, is added, and a colored spot develops on the filter corresponding to the plaque producing the fusion protein. We align the filter and the plate, and with a glass pipet excise the plaque(s) corresponding to the signal, the phage from this plug of agar are replated, and the procedure is repeated until the phage are 100% positive for the antibody reaction, indicating that the bacteriophage is pure. |
Technical advances made the analysis of large cDNA libraries possible. Next generation sequencing technology has become rapid enough that deep sequencing can be conducted in just a few hours, virtually eliminating the need to clone a cDNA library. DNA and protein databases (PDBs) are large enough so that the functions of most genes are known. Adams and colleagues were among the first to adopt this strategy. They employed brain tissue cDNA libraries and accumulated more than 2,500 unique expressed sequence tags (ESTs),14,15 and through the 1990s and early 2000s, the genomes of many species were (almost) completely sequenced with adequate coverage. Most genes and cDNAs in the retina and other eye tissues are now known. The IMAGE consortium16 is an example of a useful project that sequenced large numbers of cDNA clones from various tissues including retina, lens, cornea, optic nerve, and trabecular meshwork. These genes, along with their structures, expression, and functional information, and mRNA and genomic sequences, have been entered into the various online databases and genome browsers including several NCBI databases, the UCSC Genome Bioinformatics Site, and the Ensemble browser, which are cross-linked. In addition, genes expressed in specific ocular tissues are listed and archived at NEIBank.17,18,19,20,21,22 These databases provide physical and genetic maps of genes within specific chromosomal regions, for example, regions identified by linkage analysis and tissues. Oligonucleotides for the entire set of genes or subsets thereof have been attached to silicon chips and beads to form microarrays, providing a major advance in the analysis of polymorphic markers, sequence changes, and gene expression (see the section on Microarrays below).
The consequences for the ophthalmologist are that most eye-expressed genes have been discovered. Each of these genes and the variations within it are candidates for the cause of inherited eye diseases. This provides the potential for highly accurate diagnoses to be made. As these lesions are characterized and as the functions of these genes are discovered, the expectation is that potential therapies will be developed. Although it is beyond the scope of this article, gene therapy is in clinical trials for LCA223,24,25,26,27,28,29 and gene therapy for many other genetic eye diseases is expected in the near future.
Genomic libraries are constructed in much the same way as cDNA libraries except that the insert DNA originates from genomic DNA. Genomic DNA is isolated from any tissue from the body, either germline or somatic tissues. Because this DNA should be large, special care should be taken not to shear it during its isolation. For some applications, clones containing larger inserts are needed. Cosmid vectors (40 kb inserts), bacterial artificial chromosomes (BACs), and yeast artificial chromosomes (YACs) (150 kb to 1 Mb inserts), fulfill this need.
Positional cloning is a strategy used to find a specific genomic clone. Linkage analysis (described later in this chapter) provides a general location, usually to within approximately 1 to 5 million bases of the gene. To identify a causative gene, several techniques were applied. This approach, which used to be called “reverse genetics” or “positional cloning,” simply refers to a strategy to use the known chromosomal position of the disease locus to isolate the corresponding gene. This is discussed in detail below.
Polymerase Chain Reaction
Since its invention by Kerry Mullis30,31 in 1984, the PCR has become a cornerstone of molecular biology. PCR makes practical the analysis of trace amounts of patient material, and reliable results are available in a short time (an hour or so, to a few days). It amplifies a discrete sequence without the need to clone the DNA fragment. PCR techniques can amplify a sequence by millions of fold, allowing analysis of the genome of a single cell. When combined with other techniques, it allows sequence analysis, cloning, or almost any other enzymatic manipulation of the amplified sequence. It has made possible the concept of sequence tagged sites (STS) and single nucleotide polymorphisms (SNPs) described below. DNA specimens suitable for use in the PCR can be obtained from almost any tissue: blood, parts of histologic sections, buccal mucosa, hair follicles, anything with a nucleus, or in the case of a mitochondrially encoded gene, any tissue remnant with mitochondria. Analysis of ancient DNA samples, up to tens of thousands of years in age, became possible with the advent of PCR.
The basic technique for PCR is shown in Figure 19A.5. Amplification of sequences with PCR is a simple concept. Two specific oligonucleotides, the “primers,” are used that base-pair to opposite strands of a DNA sequence called the “template.” The primers are about 20 bases in length, anneal to opposite strands of the template, and are oriented 5′ to 3′ pointed inward. The primers are usually less than 10 kb apart. The primers allow a DNA polymerase to initiate synthesis of new DNA, which is a complementary copy of the original DNA strand. The primers are mixed with the template DNA (usually total genomic DNA containing the target sequence) in an appropriate reaction buffer with a heat-stable DNA polymerase isolated from thermophilic bacteria. The template DNA is denatured by heating the sample to 94° C, and the temperature is dropped to an “annealing temperature,” an experimentally optimized temperature at which the primers begin to anneal to the template DNA. This temperature is usually near the theoretical Tm, which can be calculated based on the DNA sequence. The Tm is the temperature at which 50% of a primer is base-paired to its complement and 50% remains single stranded in solution. Because the oligonucleotides are present in vast excess, they successfully compete with one template strand for the target site on the opposite strand. The oligonucleotide primers are extended or elongated, usually at 72° C, in a 5′ to 3′ fashion, copying the sequence of the target (aka, template) DNA. The reaction is conducted for about half minutes at each of the three temperatures. The cycle (consisting of three essential steps “denaturing,” “annealing,” and “elongating” in order) is repeated 30 or more times. Theoretically, each cycle doubles the number of target sequences, because newly synthesized DNA fragments can then act as templates for the primers. PCR is exponential until reagents (primers and dNTPs) for DNA synthesis in the reaction run out.
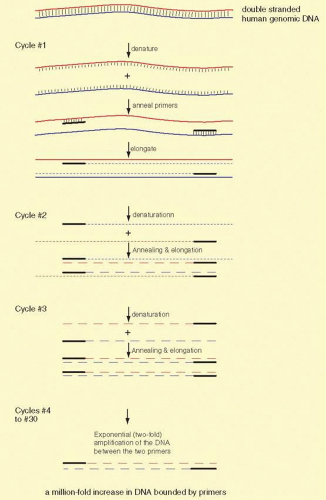 FIG. 19A.5 The PCR. Amplification of a small amount of DNA from any of several different tissue sources by PCR has proven to be an invaluable aid to modern molecular biology and genetics. The steps in the PCR are shown above. The reactions use several different temperatures to allow first denaturation (melting of DNA strands from their normal double-stranded state into single strands). The second step is to anneal synthetic primers (that bind the region to be amplified) to the melted template DNA. The third step is to elongate and copy the template strands into new DNA in a synthesis step. We cycle among the three steps at three different temperatures. Each temperature favors a different property: denaturation at 94° C, annealing at about 55° C, and elongation at 72° C. Usually 25 to 40 cycles are sufficient to synthesize enough DNA for easy visualization of the product by staining with ethidium bromide. In cycles beyond #3, the PCR accumulates the desired product in exponential fashion. The first three cycles accumulate some newly synthesized DNA strands that extend beyond the end of one or the other primer, but these are of little consequence at the end of the amplification. |
Because each primer provides the same beginning, all the amplified products have uniform ends. However, Taq polymerase adds an extra unpaired A. This property is used to subclone an amplified product into a vector with a complementary protruding T.32
The fundamental limitation of PCR is the requirement for sequence information on either side of the DNA sequence of interest. In certain circumstances, only sequence information from one end of the region of interest is needed, but for optimal results and in typical PCR conditions, it is best to have sequence from both ends of the region to be amplified. Because of the specificity and fidelity of PCR, this amplification reaction can replace far more tedious recombinant DNA techniques, including cloning, library screening, and Southern blotting techniques. The products of the PCR can be used to analyze and define gene defects and to define and use polymorphic DNA sequence variations. Analysis of the samples after PCR amplification is usually done by directly sequencing, or it can be analyzed by any of several electrophoretic techniques designed to exploit variations in the mobility of DNAs (discussed below). Finally, the amplified sequence can be subcloned and used in any way that any other cloned DNA fragment might be used.
Many creative embellishments have been coupled to the PCR. To quantify small amounts of a specific RNA found in tiny amounts of tissues or tumors, the PCR can be coupled to the reverse transcription of RNA. For example, specific cells laser-captured from histologic sections can serve as a source of RNA. The RNA is copied into cDNA by reverse transcriptase, and the cDNA is amplified by PCR, a process called real time PCR (RT-PCR). If fixed quantities of standards, either the RNA or DNA, are similarly treated, the amount of an mRNA can be accurately and precisely calculated. An example is shown in Figure 19A.6.
In an approach called RT-PCR, which cannot be disambiguated from reverse transcriptase (rt-PCR) except by context, or quantitative PCR (Q-PCR), the number of cycles required for the PCR product to accumulate to a critical threshold during the exponential phase of amplification is measured. For example, if one sample reaches the threshold (or Ct) two cycles before a second sample, it is interpreted to have four times (22, as each cycle doubles the number of copies) the level of the target DNA as the second sample. The level of product is usually detected either by measuring fluorescence of an intercalating dye such as SYBR green or by digestion of a reporter probe that has a fluorescent tag on one end and a quencher on the other. In the latter case, with each cycle a copy of the reporter hybridized to the target is digested by the 5′ to 3′ exonuclease activity of Taq polymerase, freeing the fluorescent tag and increasing the signal. Usually, the time to reach a threshold level is compared with that of a control transcript that is relatively constant from one sample to another, for example GAPDH, 18S, β-actin is commonly used as a normalizing control, called the ΔΔCt method. As the rate of increase in the product is proportional to the efficiency of the PCR reaction, it is important only to use primers with a high and similar efficiency (usually >99%, which can be checked by performing the test on serial dilutions of the sample). It is possible to correct for differences in efficiencies by including them in the calculation,33 although using a highly efficient reaction is still preferred. In addition, any mispriming or primer-dimer artifacts potentially will result in inaccurate results, so that assurance of a high quality, unique, and efficient PCR reaction for both unknowns and controls is critical for accuracy. One of the most useful applications of quantitative RT-PCR is in combination with reverse transcriptase, to measure mRNA levels and their changes within tissues or cells of interest, often as a confirmation or more accurate follow-up to microarray data. Other applications include delineating the copy number of a genomic sequence or in assays to genotype SNPs (see below). The nomenclature for reverse transcriptase RT-PCR is often cumbersome, and the reader beware: Carefully follow context and noted abbreviations in articles and texts.
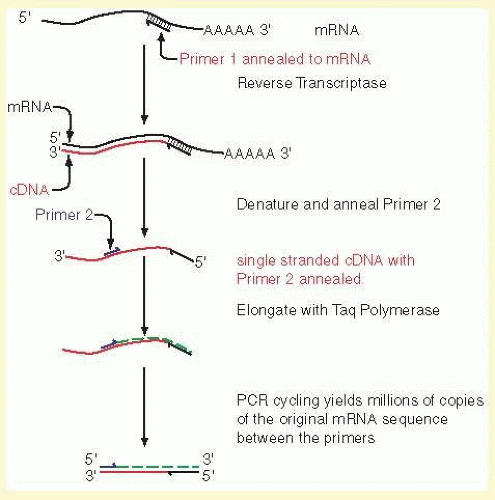 FIG. 19A.6 Reverse transcriptase coupled to PCR. One of the most important uses of the PCR is to measure the amounts of a specific mRNA. Changes in the accumulated levels of a specific mRNA can be highly diagnostic of disease processes, for example in the prognosis of breast cancer.35 To accurately and precisely measure the level of a specific mRNA, total RNA from a tissue is copied into cDNA with reverse transcriptase and a specific primer (Primer 1 in the illustration). A second specific primer (Primer 2) is used to initiate elongation of the cDNA with Taq polymerase or a related temperature-stable polymerase. A double-stranded cDNA results from these two steps, and the same primer pair is used to continue the PCR. Provided that the reaction is not cycled so many times that the substrates are depleted, the amount of PCR products is proportional to the starting concentration of the mRNA of interest. By carrying out simultaneous reactions with standard amounts of the specific mRNA, a calibration curve can be generated to calculate the absolute amounts of starting mRNA. This allows precise measurements of the changes in mRNAs in response to drug treatments, experimental manipulations, or disease courses. |
SNPs
SNPs are single-base sequence variations from one person to the next. They can be analyzed with PCR. Suitable oligonucleotides flanking a base change are used to prime the PCR. Usually the products are about 100 to 150 bp long. Multiple loci can be analyzed simultaneously, a process known as multiplexing. Once the target sequence is amplified, it can be analyzed in several ways. (1) The PCR sample can be digested with an appropriate restriction enzyme for the base change, subjected to gel electrophoresis, and visualized by staining with ethidium bromide or other dye that fluoresces only when bound to double-stranded DNA. This technique is shown in Figure 19A.7. (2) One primer contains a perfect match to one allele, but bears a single-base mismatch at the 3′ end with the other allele. This primer provides a specific amplification only when the perfectly matched allele is present (Fig. 19A.8). By analyzing PCR product accumulation after each cycle, typing of an individual can be carried out. The patient’s status as a double homozygote for one allele, a homozygote for the other allele, or a heterozygote can be accomplished (see Fig. 19A.9). High throughput SNP analyses are considered further several sections below.
A limitation of PCR is that the polymerase used sometimes misincorporates the wrong nucleotide, with an error rate of about 10-5. For example, Taq DNA polymerase does not have 3′-5′ exonuclease activity, and hence no proofreading capability. Thus, care must be taken when single products of PCR are subcloned and analyzed by DNA sequencing or restriction analyses. At least three clones must be analyzed to ensure that the correct sequence has been obtained. When the entire PCR product is analyzed directly, this low frequency of errors is of little importance. Several different thermostable polymerases are now available—some with proof reading capabilities, and Pfu, Vent, and Hot Tub polymerases have lower error rates than Taq polymerase.34
Microarrays
Northern blotting and reverse transcriptase PCR are powerful tools in the analysis of gene expression levels. These techniques are straightforward, fast, and easy provided that only a handful of genes need to be analyzed at one time. But what if an expression level analysis of many or even all genes needs to be conducted? Technology has been developed to analyze the abundance of thousands of mRNAs simultaneously. One approach, called microarray or GeneChip analysis, relies on the specificity of annealing a single mRNA type to a pure DNA sequence. Thousands of different DNA sequences are spotted individually onto a two-dimensional (2D) surface where each clone is bound irreversibly. This can be accomplished by spotting each cDNA clone onto a chemically modified glass microscope slide. Each spot contains picoliter volumes of a single pure cDNA. Another way to create the array of pure DNAs is to synthesize oligonucleotides directly onto the glass surface, using photolithographic processes similar to those employed for creating computer chips. Several commercially available chips prepared in this fashion represent at least one copy of every known gene and known splice variants as well, approaching the entire transcriptome of the human genome or that of other species. Once the array of the thousands of different cDNAs is created, the second step is to probe the array with labeled RNA from the sample of interest. Several alternatives are available to tag RNA. Usually this marker is a fluorescent tag, providing appropriate signal sensitivity. Often, two or more different probes are prepared. One probe is derived from an experimental condition and the second probe serves as a control or standard condition, untreated, mock, sham, or vehicle treated. The labeled probe is a mixture of thousands of different labeled RNAs. Each RNA differs in abundance from the next, and the abundance of each labeled RNA reflects its relative abundance in the sample. The probe is incubated on the surface of the chip or the beads in a conventional hybridization mix. Under these hybridization conditions, usually about 52° C and 6X SSC, each different labeled RNA will hybridize specifically to the fixed amount of DNA on of correctly mated spot or bead of the array. The amount of label bound to the spot reflects the abundance of the mRNA in the sample. Any unbound probe mRNA is removed by washing much as in Northern or Southern blotting. The array is “read” in an instrument capable of detecting the specific label being used in the experiment, basically a sensitive highresolution CCD-based photographic camera. The levels of each mRNA are compared in the experimental sample versus an identically processed control sample. Thus, in a single experiment, almost every gene can be measured for its level of expression.
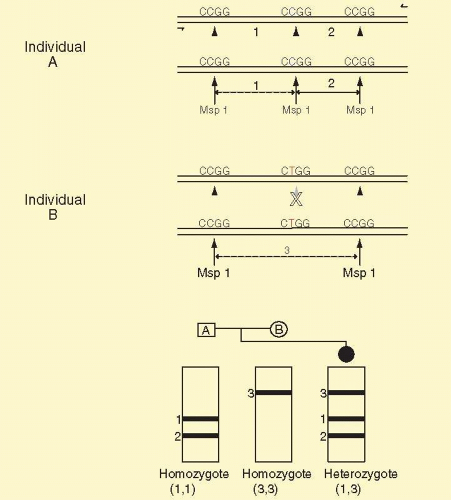 FIG. 19A.7 A DNA polymorphism detected by a restriction enzyme following PCR. Individual A is a homozygote for one allele. Individual B is a homozygote for the other allele. Individual A has a central Msp 1 site, CCGG, where as individual B has lost the site due to a single base change of C to T, changing the recognized CCGG sequence to CTGG. On electrophoresis, individual A has bands 1 and 2, whereas individual B has a single band #3, the size of which is the sum of the sizes of bands 1 and 2. Offspring of A and B are heterozygotes and have one of each of the alleles and have all three bands. On Southern blot analysis with a probe indicated by the black bar, only bands 1 and 3 are detected. Band 2 does not contain sequences to which the probe can hybridize. Thus, on autoradiography we will detect only band 1 in individual A, only band 3 in individual B, and bands 1 and 3 in individual C. |
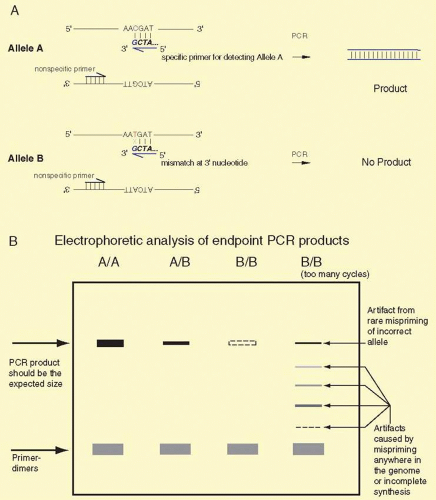 FIG. 19A.8 Allele-specific PCR by endpoint analysis. Panel A: Allele A and Allele B can be distinguished by PCR assay provided that an allele-specific primer (with a perfect match to one allele and a single-base mismatch at the other allele) is known. In the illustrated case, a 3′ terminal G matches perfectly to a C in the upper strand of Allele A, and the 3′ G mismatches with a T on the upper strand of Allele B. Under optimized conditions for the PCR, the reaction can be tuned to produce large amounts of PCR product from allele A with little or none from Allele B. Panel B: Electrophoretic analysis of PCR products from individuals who are homozygous for Allele A (A/A), heterozygous for Alleles A and B (A/B), and homozygous for Allele B (B/B). A heavy PCR band is expected for any A/A individuals, about half as much product is expected for heterozygous (A/B) individuals, and no product is expected from homozygous (B/B) individuals. The electrophoretic gel analysis allows the measurement of the size of the PCR product, and it should be the expected size. The product can be restriction digested to test whether the product has the anticipated restriction enzyme sites, and the product can be sequenced to further validate the sites. Several possible artifacts of the PCR process are illustrated in Panel B. Primer-dimers can occur if the primers can bind to each other. Because of the high concentrations of the primers in the PCR, there is a propensity for the primers to bind to each other even when just few bases near the 3′ ends of the primers match each other. The primer dimers are detected near the bottom of the gel corresponding to the sum of the lengths of the primers, usually about 40 base pairs. Increasing the annealing temperature and decreasing the concentration of the primers may reduce the amount of primer-dimers. The far right lane (labeled B/B [too many cycles]) illustrates several other potential PCR artifacts. These are usually most noticeable when the PCR is subjected to too many cycles. In most cases, with 10 ng genomic DNA, a PCR is complete by 25 to 30 cycles. In certain circumstances it may be necessary to run the reaction for more cycles, and under those conditions a series of artifacts may be detected. One artifact is that after too many cycles, reagents and substrates will become rate limiting and products may not be completely copied. These partial products can be detected at many intermediate sizes, from very small to nearly full size. Also, after being subjected to repeated heating, contaminants in the reagents may reduce the specificity of the annealing, and mispriming can occur. This may lead to the formation of a full-length PCR product, even in the presence of only Allele B DNA. Thus, the PCR must be optimized for the number of cycles to maximize the yield of the A/A product, minimize the amount of any B/B product, minimize primer-dimers, and minimize any incomplete products. The optimization process usually titrates the number of PCR cycles, annealing temperature, concentrations of primers, Mg++ ions, buffers, and type and amount of polymerase. Usually, several candidate primer pairs are tested. |
The utility of the approach is 2-fold: First, the analysis of genome expression is encyclopedic, as virtually all known genes are analyzed. Second, the work need not be hypothesis driven, and given the encyclopedic nature of the experiment an “unbiased fishing expedition” leads to useful, important, and testable hypotheses. It is arguably more important that gene expression signatures for disease outcomes can be obtained. That is, the microarray analysis may unlock hidden processes that the physician-scientist had not previously envisioned. The microarray results may radically change hypotheses about the mechanism(s) of drug action, disease etiology, and may uncover previously unknown metabolic or mechanistic pathways. Along these lines, Friend and colleagues35 employed microarray analyses to predict clinical outcomes among patients with breast cancer. They analyzed the gene expression patterns of thousands of mRNAs derived from biopsies of primary breast tumors. They obtained a “signature” (a pattern of expression from 70 different cDNA clones) from the overall collection of about 25,000 genes. This signature was strongly predictive of the length of time to metastasis in patients who were lymph node negative at the time of diagnosis. This “signature” outperformed traditional clinical classifiers that included histopathology grade, tumor size, angioinvasivenss, and estrogen receptor expression status. This signature is highly effective in identifying patients for whom adjuvant chemotherapy would have no benefit and prevents unnecessary treatment, which can cause harm in itself. An implication of the study was that a tumor’s decision to spread is cast early, while the tumor is very small. The same “signature” strategy is effective in uveal melanoma. Recent work from the Harbour and other laboratories36 has lead to the development of a signature for uveal melanoma. Patients can be classified into two major risk categories: class I tumors that have a very low risk of metastasis (and a good prognosis for survival) and class II tumors that have a very high risk of metastasis and a poor prognosis. The signature only depends on the levels of gene expression from a total of 12 genes. Because of the small number of genes, the diagnosis does not depend on the limitations of microarrays, instead it depends on the precision and accuracy of q-RT-PCR. A 12-gene signature (HTR2B, ID2, MTUS1, ECM1, ROBO1, SATB1, LTA4H, EIF1B, RAB31, FXR1, LMCD1, CDH1) allows biopsied tumors to be assigned accurately to the two major predictive classes. This signature strongly predicts metastatic death and offers a useful, definitive, though not terribly economical test in the clinic.36 Other predictors include mutations in BAP1, highly predictive of melanoma metastasis,37 monosomy of chromosome 3 found by several groups, and abnormalities on chromosomes 1p, 3, 6, and 8q detected by multiplex ligation-dependent probe amplification.38
Expectations are that in retinal and macular degenerations, even when the precise lesion remains unknown, similar microarray analyses might provide signatures of genes indicative of severe or rapid visual loss. The identified genes in the signature may provide analogous targets for drug therapy that might slow or reduce loss of visual function. Although it is clear that the patient’s retina should not be biopsied, other tissues can be, and the results from developing “signatures” should be helpful. Also, in animal models of retinal degenerations, across many diseases, we may identify common metabolic pathways that are susceptible to drug treatment.
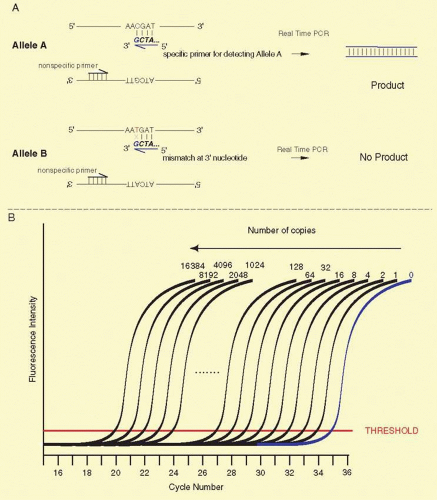 Fig. 19A.9 ASRT-PCR. Panel A: A single nucleotide mutation can be detected by allele-specific PCR, if the single nucleotide change is known in advance. One of the two primers is chosen so that its 3′ nucleotide contains the variant single nucleotide unique to one allele. In this illustration, a single nucleotide change from C to T is the only difference between Allele A and Allele B. The second PCR primer matches sequence at both alleles nearby (usually no more than 150 nucleotides away) and is identified on the figure as the “nonspecific primer.” Because of the one-base mismatch between the Allele A-specific primer and the Allele B sequence, Taq polymerase will not synthesize a new DNA copy. In the Allele A DNA sample, the polymerase efficiently synthesizes a new DNA strand because the 3′ base matches this allele perfectly. Panel B: RT-PCR. The anticipated results of 2-fold serial dilution of genomic DNA. The number of copies of genomic DNA is illustrated above selected curves. The plot shows the accumulation of newly synthesized DNA on the Y-axis. A fluorescent dye that binds to double-stranded DNA is included in the reaction, and when the dye is bound, it fluoresces much more intensely and the Y-axis reflects the relative fluorescence intensity. In every cycle, the amount of double-stranded DNA in the reaction doubles. This occurs until the amounts of substrates for new DNA synthesis begin to run out. The amount newly synthesized DNA plateaus as these substrates are depleted. The shape of the curve over the course of many cycles yields a characteristic sigmoidal shape. Whether there are few or many copies of the starting template DNA, the curves possess the same general sigmoidal shape. The key difference is the point where the initial upward inflection occurs. This threshold is characterized almost exclusively by the starting number of copies of the template. The threshold on the Y-axis is governed in part based on the sensitivity and reproducibility of the instrument being used. The more precisely and accurately that the instrument can detect low levels of dye binding to double-stranded DNA, the better. A calibration curve should be constructed by assaying serially diluted known standard amounts of template DNA. In such a calibration curve, for every 2-fold decrease in the amount of DNA, the cycle position at which a sample crosses threshold should change by about one PCR cycle to the right. Panel C: Expected results from Panel A. To distinguish homozygotes for Allele A, homozygotes for Allele B, and A/B heterozygotes, usually two ASRT-PCRs are run, one specific for Allele A and a second specific for Allele B. Shown here are the expected patterns for the Allele A specific reaction. A/A homozygotes are shown in blue, B/B homozygotes are shown in red, and A/B heterozygotes are shown in black. Typically A/A and A/B genotypes display a one cycle shift at threshold due to 50% less Allele A DNA in the heterozygote sample. The B/B homozygotes typically display a shift to the right by many cycles, and the shift should be consistent with data from the calibration curve for a sample containing less than one copy of Allele A. |
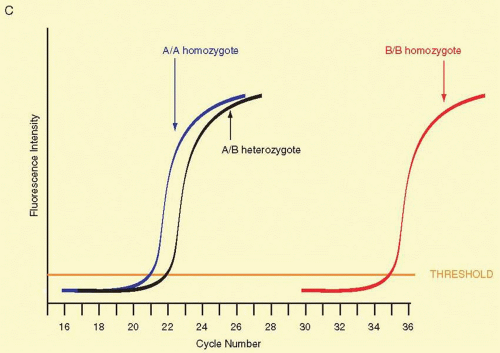 Fig. 19A.9 (continued) |
There are several potential problems with microarrays: (1) The labeling technique may selectively favor one mRNA over another thus distorting the mRNA expression pattern. (2) Low-abundance mRNAs may not be detected, either because the mRNA is not in the sample or because the tiny amount of the label when bound to the spot is below the level of detection. (3) Microarray analysis requires large amounts of starting mRNA. In some schemes, to make large amounts of probe, the mRNA is amplified by a reverse transcriptase RT-PCR step. This may cause a misrepresentation of one mRNA over another, because of different levels of efficiency in the RT or the PCR steps. (4) An important cDNA may not be present on the microarray. By accident, the gene cannot be analyzed even though the experimenter thought that the gene was there. (5) Artifacts in the cDNAs: Unwittingly, two cDNAs might be fused together and spotted onto the array. Thus, what should be two different signals are combined into one. (6) Surface effects of the chips: Most chips are flat 2D solid surfaces with the clone or oligonucleotide bound directly to the surface. There may be artifacts due to the mRNA not being able to bind to the DNA because of steric hindrance at the surface of the chip. Long cDNAs, long oligonucleotides, or the use of spacers can reduce this kind of artifact. Also, a 3D surface can allow for a solution-based hybridization and avoid the steric effects. (7) Mishybridization: The wrong mRNA may adhere to an incorrect DNA. Increasing the stringency of the chip washing conditions can reduce nonspecific binding. Also, the selection of probes that lack partial homologies can reduce misbinding. Mutating the DNA can help to identify improper hybridization. Stringent controls for the preparation of probes are the first line of defense against improper hybridization. (8) Dynamic range: Only a small amount of DNA is spotted onto an array, and it is possible that the mRNA is in very high concentration relative to the amount of DNA on the spot and saturates it. To circumvent this problem, it may be necessary to run the experiment with two different doses of the mRNA, a high-probe concentration and a low one. (9) mRNA splice variants: Many genes can be alternatively spliced, and different tissues may favor one splice variant over the another. A work around for this problem is to employ two different DNAs on the chip, one specific for one splice variant and a second specific for the other variant. (10) mRNA expression levels are useful, but oftentimes, the critical information may be the level of enzymatic activity or the amounts of protein present. mRNA microarrays measure steady state mRNA levels, not levels of protein, enzyme activity, or even the rate of transcription of RNA. Thus, it is critical to know exactly the question being asked to decide whether microarrays for measuring mRNA levels are the appropriate technique. The correlation between mRNA level and protein level is about 70%.39 (11) Replication: Because of the expense of microarrays, and because they cannot be reused, there is a temptation of cut corners on controls and numbers of replicates. The same scientific standards apply to microarray analyses as any other experiment. Because of the exceedingly large numbers of genes being analyzed, random coincidence may explain why some clones exhibit sought-after correlations with treatment conditions, a form of a false discovery rate (aka, FDR). (12) Last, there are potential problems with analysis techniques, data storage and documentation, and standardization among reporting formats so that results across platforms and labs can be compared. This is critical as in the past only a handful of genes and mRNAs were being studied at once, and the reader could easily compare results. However, now with about 25,000 genes being analyzed simultaneously, the reader must now rely on computers and databases to compare results across several publications. Despite this long list of problems, microarrays exhibit numerous advantages well outweighing the known difficulties. It is an approach designed to exploit information in the human genome sequence and is useful for basic and applied needs. Microarrays are also useful for studying DNA sequence changes, as is detailed in the section on DNA Sequencing.
Finally, microarrays are being supplanted by RNA-seq, which is based on next generation sequencing of libraries of cDNAs, and costs of RNA-seq have dropped to about $1.00 per Mb of sequence making this a cost-competitive as well as thorough alternative. With deep sequencing, this approach is fast becoming more accurate and precise than microarrays.
Proteomics and cDNA Cloning
A proteomics-based strategy has become popular for identifying a protein. The strategy is to learn the identity of the protein based on a combination of mass spectrometry and database searching. The proteomics approach usually begins with identification of a spot on a 2D protein gel that contains a protein of interest or a unique biologic property. Alternatively a peak is found by multidimensional chromatographic analysis. Often a protein is considered interesting by virtue of being differentially expressed in a developmental or disease state. Two dimensional gels separate proteins based on the isoelectric point (pI) and molecular weight. Once such a protein is excised from the 2D gel, it is digested with trypsin. The resulting proteolytic fragments are subjected to analyses in mass spectrometers. The first such analysis is usually matrix-assisted laser desorption ionization time-of-flight mass spectrometry. This analysis provides experimentally determined masses of each tryptic peptide of the protein to within 0.01%. The set of masses of the numerous tryptic fragments are a characteristic “fingerprint” of the protein and, in principle, can be used to identify it. A database of known and predicted proteins has been derived from a whole genome sequence. The masses of each set of tryptic peptides from each known or predicted polypeptide have been calculated from this PDB. The predicted set of masses from each protein in the database provides a “predicted fingerprint” to which the experimentally determined “actual fingerprint” is compared. We then ask whether the experimentally obtained “actual fingerprint” from the gel spot matches any of the thousands of “predicted fingerprints” in the database. Theoretically, one, and only one, protein should match perfectly, and this match provides us with the identity of the protein and the full sequences of the protein, mRNA, and gene.
There are some drawbacks and potential problems with this approach. First, a critical assumption is that the resolution of the 2D gel is sufficient to assure that only a single polypeptide is contained in the spot. Although 2D gel technology can resolve about 2,000 different proteins on a single gel, this may not be a sufficient resolution if contaminating proteins have nearly the same mass and pI as the protein of interest. Second, the abundance of the protein under consideration may be very low, and it may be necessary to spend substantial time and effort to obtain an enriched protein preparation such that the single spot of interest has no contaminants in it. Third, it is unlikely that every tryptic peptide is extracted from the gel spot. Thus, not every theoretical peptide mass will have a match to a peptide in the experimental data set. Next, it is inevitable that proteins from human skin and other sources will contaminate the experimental sample, creating extraneous peptide masses that can confound analyses. However, if we find many peptides matching within 0.01%, this agreement suggests that the unknown protein of interest has been identified. Scoring systems that assess the quality and extent of the matches help us to judge the probability that the identified match is authentic, and web-based utilities such as Protein Prospector perform these calculations. If the z-score is above 1.65, it is highly likely that the match is correct. Finally, much additional work is required to prove the putative identity. Sequencing the unknown protein by b- and y-daughter ion series from MS MS experiments40 is, at a minimum, a firm requirement to establish and validate the identity of the protein. Often, proteins are post translationally modified. Under these circumstances, the identification of the modifications may be made by additional MS methods.40
An essential point is that once the protein is identified, in many cases, a cDNA or genomic clone corresponding to the newly identified protein can be obtained merely by ordering the clone from repositories.
Sequence Analysis and Bioinformatics
To acquire the information that a gene contains, we need to determine the sequence of bases in it. Now, the entire human genome has been sequenced, providing us with a database of all the approximately 25,000 genes in the human body, a molecular anatomy of the human genome. The sequences of all this genetic material are now held in several commercial and public databases.
Although there are still some gaps and little of the normal variability of the genome has been assessed, the availability of this sequence has changed the way positional cloning is carried out. The genomes of many additional organisms are near completion too. These provide a vast warehouse of useful information that ultimately will be employed in (1) elucidating what each and every gene does, (2) diagnosing disease, and (3) designing treatments of many eye diseases.
New sequence entries are shared among databases, so submission of an entry to one database should assure that other databases receive a copy of the entry. It is no longer practical to analyze or compare sequences manually. This problem has resulted in the birth of the field of bioinformatics in which DNA sequences are stored and analyzed by software suited to the given task. Many program packages are available for use on desktops or laptops and in massively parallel arrays of processors, IE, cloud computing. Countless programs are available on the Web for sequence analysis.
An investigator might need to retrieve all sequences expressed in the photoreceptor. Appendix 19A.1 shows a summary of database entries at NCBI, which were retrieved from the database with the keyword “photoreceptor.” Although many entries are detected, other entries related to phototransduction are not listed. Thus, a search must be carefully constructed to avoid missing relevant sequences. A typical search result is shown in Appendix 19A.1. If the link to DNA sequences is clicked, besides the DNA sequence, header information, aka metadata, is supplied, making it easier to identify how the sequence was obtained and to find features within the sequences that may be biologically important. An example of eye diseases from NEIBank is shown in Appendix 19A.2. This partial printout shows abundant cDNAs found in the retina.
DNA Sequence Determination
Classically, two major methods were used for DNA sequence determination, and both techniques relied on the ability of electrophoresis in polyacrylamide gels under denaturing conditions to resolve DNA molecules differing in length by only one nucleotide. The electrophoresis technique can resolve DNAs differing by one base up to 1,200 nucleotides in length, but for practical considerations usually lengths up to about 900 nucleotides are analyzed before error rates increase unacceptably. Depending on throughput needs, the gel may be in the form of a thin slab of cross-linked polyacrylamide formed between two plates of glass or, alternatively, thin capillary tubes are filled with linear polyacrylamide, and these serve to fractionate a set of DNA molecules. The latter is more amenable to high throughput analyses but requires a substantial cost in instrumentation. The former was the original method of choice but requires more setup and hands-on time.
The two DNA sequencing principles are the Maxam and Gilbert41 approach, exploiting partial chemical degradation of DNA molecules, and that of Sanger and co-workers,42 making use of enzymatic reactions that synthesize DNAs of various lengths. Both techniques produce a nested set of related DNA molecules. These sets of DNAs begin at a common end and are identical in sequence except they differ in size by one nucleotide increments at the other end. The synthetic steps of the Sanger method are illustrated in Figure 19A.10. A template DNA is copied by a DNA polymerase that must initiate synthesis from a short oligonucleotide primer (usually 15 to 20 bases) that hybridizes (anneals or forms base pairs) with part of the template DNA. The enzyme requires the four deoxynucleotides, appropriate buffers, and Mg++ ions for the synthetic reaction to take place. Sanger’s key idea was the incorporation of a mixture of dideoxynucleotides and deoxynucleotides into the growing chains of DNA. The absence of a 3′ hydroxyl group in the dideoxynucleotide prevents the chain from elongating any further, terminating its growth once a dideoxynucleotide is incorporated. This termination generates a DNA chain of a distinct length. By mixing appropriate ratios of a deoxycytosine triphosphate and its corresponding dideoxynucleotide, dideoxycytosine triphosphate, a spectrum of DNA chains is produced with all chains starting at one spot (determined by the location of the primer) but with some chains terminating at each cytosine in the sequence. Separately, three other syntheses are carried out for each other pair of deoxynucleotide and dideoxynucleotide. This produces a full set of DNA fragments all starting at the same point but ending at each base position of the DNA fragment being sequenced. Because of the small amounts of material being synthesized, a chemical label or tag is incorporated into the DNA during synthesis. For small-scale projects, the usual tag is radioactivity. This allows the DNA to be detected by autoradiography. The isotope most commonly used for DNA sequencing is 35S; it emits a β-particle that interacts with the emulsion of X-ray film placed on the top of the sequencing gel, and we read the resulting image of the gel on the autoradiogram. Current automated systems using fluorescent-labeled nucleotides now allow rapid and highly efficient sequencing of large amounts of DNA, and hundreds of automated fluorescence-based sequencers were used to sequence the human, mouse, and numerous other genomes.
The principle of chemical degradation sequence determination is to partially degrade DNA in four separate reactions. Each reaction is specific for a different base. DNA is first labeled with a radioactive tag at one end and then subjected to the four separate degradation reactions. The reactions break the DNA at one specific base per strand. Excess nonradioactive carrier DNA is included in the reactions so that only partial degradation of the radioactive DNA occurs, ensuring that chain cleavage is random along the length of the DNA chain. The degraded chains form nested sets of molecules differing in length by only one base, and the products can be analyzed by acrylamide gel electrophoresis. Otherwise, the analysis of the products of the Sanger and the Gilbert method is very similar.
Sequences larger than a typical 600-base reading are obtained by assembling overlapping sequence readings. The overlapping readings can be obtained using a different primer, subcloning different DNA fragments, or using another trick, such as transposing a primer annealing site into other parts of the DNA insert. The redundancy inherent in overlapping sequence readings contributes to the accuracy of the completed sequence. To further heighten the quality and reliability of the sequence information, the sequence of each strand of the DNA is determined. Each strand complements the other; that is, an A on the first strand always forms a base pair with a T on the complementary strand, and C pairs with G on the other strand. Mistakes in interpreting gel readings or other ambiguities (sequence artifacts) from one strand usually do not occur at the corresponding position of the other strand. On occasion, the accurate determination of certain sequences remains troublesome, for example, regions very high in G + C content, but several methods have been devised to read these areas. These include the use of different polymerases, higher temperatures, and nucleotide analogs to aid in the sequencing elongation reaction. Also, higher temperature during electrophoresis and inclusion of more potent denaturation agents in the acrylamide gels can help to prevent unusual structures in the DNA that may cause incorrect mobility in the gel or capillary. Last, a switch from the Sanger to the chemical degradation chemistry may aid in determining the sequence. Sequences should be well in excess of 99.9% accurate.
High Throughput Sequencing
The development of new technologies for high throughput or next generation DNA sequencing have allowed large amounts of DNA sequence to be generated quickly and efficiently, and at a reasonable cost. These approaches are particularly useful in procedures such as whole genome or whole exome sequencing, RNA-Seq or serial analysis of gene expression in which large numbers of cDNAs are partially sequenced to provide gene expression data, detection of low-level somatic mutations, and metagenomics (sequence of complex mixtures of DNAs from materials such as gut flora or sea algae mixtures). These approaches essentially have changed the current paradigm in positional cloning and are straining current bioinformatics capabilities. It should be noted that while most platforms provide an accuracy of at least 99.99%, this still results in a large number of false reads given the extremely large number of bases typically sequenced. In addition, high-throughput sequencing is often preceded by a hybridization capture step for exomes or a specific area of the genome, which can lead to loss of some desired target sequences. Most high-throughput sequencing approaches require an initial in vitro cloning step to increase the sequencing signal. This is most frequently accomplished by emulsion PCR, in which individual DNA molecules ligated to adapter oligonucleotides are isolated with beads (or directly on a slide) coated with DNA primers homologous to the adapters in aqueous droplets within an oil emulsion. When PCR is carried out, the beads become coated with clonal copies of the DNA fragment and are then immobilized before the actual sequencing reaction is carried out. There are four primary approaches that are currently feasible, each with advantages and disadvantages.
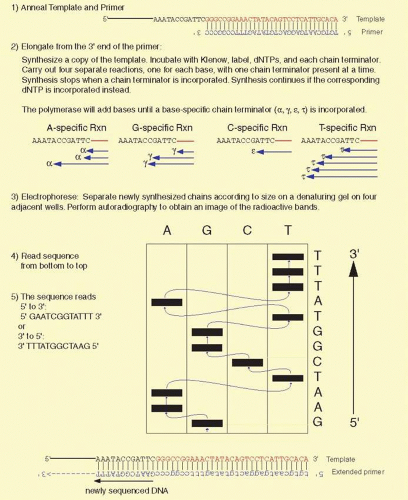 Fig. 19A.10 DNA sequence analysis by the chemical synthesis method of Sanger. All genetic information is encoded in the sequence of bases of DNA. The method developed by Sanger and colleagues is outlined above. A pure source of template DNA and a pure primer that anneals to the template are required. Synthetic reactions make copies of the template DNA. Panel A: An amount of dideoxynucleotide is included in each of four separate reactions to terminate the newly synthesized DNA chains. In the figure, the terminators are represented by the Greek letters α γ σ and , which represent dideoxyadenosine, dideoxycytosine, dideoxyguanosine, and dideoxythymine, respectively. In each reaction, the ratio of terminator to normal deoxynucleotide is tuned so that for each reaction adequate amounts of terminated chains from 1 to approximately 900 bases in size are synthesized. These chains also are radioactively (Panel A) or fluorescently labeled (Panel B) during this synthesis step. We resolve these chains by running a urea-polyacrylamide gel, which is capable of resolving DNA molecules differing in size by only one base. In Panel A, we load the gel with the four different reactions side by side. After electrophoresis for a few hours, we obtain an image of the radioactive bands by autoradiography. The pattern of bands looks like a ladder. The bands at the bottom are the shortest DNA molecules, and we “read” the DNA sequence by starting at the bottom of the gel and stepping up one band at a time, shifting from one of the four lanes to the next, moving to the immediately higher band. The direction of synthesis is always 5′ to 3′, and the order from bottom to top of the gel is consequently also 5′ to 3′.Panel B represents results from dye-terminator sequencing in which each chain terminator is labeled with a different fluorophore. The four reactions can be loaded onto a single capillary, and the results are read by recording the fluorescent color at each position in the nucleotide sequence. |
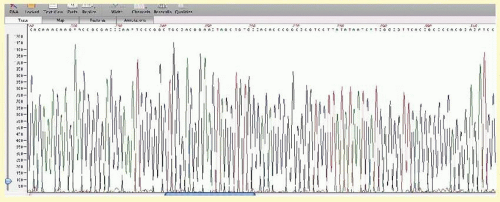 Fig. 19A.10 (continued) |
A massively parallel pyrosequencing approach is instituted in the 454 sequencing system, now marketed by Roche Diagnostics as the GS FLX+ system. Each bead is placed in a well of microfluidic plate with a set of sequencing reagents including DNA polymerase, ATP sulfurylase, and luciferase. DNA nucleotides are then sequentially added to the wells, and when the nucleotide complementary to the next strand on the DNA template is added, it is incorporated, with subsequent stimulation of luciferase that is detected by a fiber optic CCD camera. Addition of multiple nucleotides (e.g., if two adjacent adenines are present in the template) results in a proportionally larger signal, accurate up to about six nucleotides. The cycle is then repeated for another round of sequencing. This can provide read lengths of up to 1,000 bases with a mode read length of approximately 700 bp, similar to Sanger sequencing. Throughput is up to 700 Mb in 106 reads per run in 23 hours.
A form of massively parallel sequencing by synthesis first developed by Sydney Brenner and his colleagues has been incorporated into the Solexa sequencing system marketed by Illumina as the Highseq 2000. This approach uses a reversible terminator approach in which four fluorescently labeled and blocked primers are added to the sequencing reaction, and the resulting fluorescence is detected before the 3′ terminal blocker (with the fluorescent dye) is removed and the next cycle of sequencing is carried out. Reads of up to 200 bp are possible, with up to 6 × 10⁹ paired end reads giving a throughput of 600 Gb in 11 days.
A ligation-based sequencing system first developed by George Church and his coworkers is the basis for the Applied Biosystems SOLiD sequencing system. Pentanucleotide primers with the first two nucleotides uniquely specified hybridize initially to the adaptor sequence and then to the DNA fragment to be sequenced. After ligation, the two nucleotides are identified by a fluorescent tag attached to the 5′ end on the pentanucleotide, after which the fluorescent tag is removed and another cycle is initiated. Because of the redundancy in the system, each nucleotide in the target DNA is assayed twice, in two sequential elongation steps, offset from each other by a single nucleotide. As five rounds of ligation are performed, the read length is 35 bases. This gives a throughput of over 20 Gb a day in the newest applications.
Finally, the Ion Torrent system by Life Technologies uses a semiconductor detection system to detect the release of a hydrogen ion when a nucleotide is incorporated into a DNA strand. As each well in a sequencing chip is in turn flooded with each nucleotide, release of the hydrogen ion results in a pH change that is detected by the semiconductor underlying the well. This allows sequencing reads of 200 bp, with throughput of up to 1 Gb each 2 hours, depending on the chip used. As with pyrosequencing, runs of a single base produce an increased size of the signal, accurate to at least five bases.
Alternative Sequencing Methods
Other methods38 for DNA sequencing have been suggested, and four of these are worthy of some consideration here. Common attributes of the three include the analysis of single molecules of DNA, obviating the need to amplify or clone DNA prior to sequence analysis, and none of the three require chemical degradation or synthesis to acquire a nested set of DNA molecules. Atomic force microscopy is one of these methods. Because the four bases of DNA are shaped slightly differently, an atomic force microscope trace of a fragment of DNA theoretically can be used to decode the sequence.43 The technique currently resolves DNA of about 10 bp lengths,44,45 not sufficient for sequence analysis. Progress has been made to enable haplotyping of alleles.46 The second method employs a lipid bilayer containing a pore of hemolysin in it. DNA is driven through the pore by an electric field. Ideally, as each base passes through the pore, there should be a slight fluctuation in current characteristic of the base that is passing at that instant. The sequence could be read by monitoring these small current changes with time.47 As yet, only short homopolymeric sequences can be differentiated.
The third method is called sequencing by hybridization (SBH). It relies on the hybridization of very short probes to a single-stranded DNA molecule. The probes currently are tetramers labeled with a fluorescent tag. On average, any given tetramer will hybridize to DNA every 256 nucleotides, but due to the vagaries of any sequence, the interval between each complementary binding site of the tetramer varies, just as the pattern of restriction sites generates different-sized DNA fragments. The approach uses the fluorescent hybridization signal to indicate a yes or no signal for a given sequence48 or a measurement signal of the position of one hybridization event to the next along the single-stranded template. There are several variants of SBH. We will not go into the details of any except to say that the approaches all have virtues and are relatively fast but are not as developed or currently practical as other second or third generation sequencing methods.
DNA Sequencing Chips using Single Molecule Nanopores
In nanopore sequencing, a single strand of DNA is drawn through a nanometer-sized pore. As each base of the DNA passes through the pore, it is sensed and then read a base at a time. The chief advantage of nanopore sequencing is that after DNA isolation and purification no processing is required. There is no need to digest or fragment the DNA, to amplify the DNA, or to label the DNA before analysis, which should reduce sequencing costs. Approaches based on nanopore sequencing have relied proteins such as hemolysin to form the pore and require a trick to read the base as it passes through the pore. Besides the protein pore lipid-bilayer approach to nanopore sequencing, other chemical and physical nanopores are being developed. For example, IBM designed artificial nanopores created with solid-state semiconductor chip technology.
A challenge of nanopore-based sequencing is to slow down and control the passage of an individual DNA molecule as it passes through the nanopore. An ongoing problem is that the DNA zips through the pore so quickly that numerous bases pass through before any individual one is accurately detected or read. With IBM’s approach, control of this movement through a nanopore is done with thin alternating approximately 2 nm layers of electrodes and insulators, a de facto transistor, through which a 3-nm hole or pore passes. Three electrodes trap DNA in order to read the DNA sequence, ratcheting the DNA along one base at a time. Because of the interrogation method of each base, it can be tested multiple times in a single pore, moving a base back and forth across the sensor, allowing highly accurate base-calling and error correction. This improves read length and aids in the assembly of long contigs.
Other solid-state nanopores are made of graphene, a sheet of carbon one atom thick. Because such membranes are so thin, only a single base ought to be present within the pore at any one time, making detection sensitive and accurate.49 A layer of titanium oxide on the top of the graphene may allow DNA to pass through a pore more readily and reduce noise in detecting a given base.50
Despite some disadvantages of these new DNA sequencing approaches, they all exhibit desirable features, and in the long run they may vastly reduce the time and expense of current DNA sequencing techniques. They offer the promise of “personal sequencing” in which a single individual’s genome could be completely analyzed to test for a host of genetic diseases and hereditary risk factors or traits. Many areas of the genome are currently difficult to sequence because they cannot be cloned. Others are difficult to sequence because present-day polymerases stall in attempting to pass through these DNA stretches. Other regions contain many repeats that are difficult to piece together by current short-read sequence-overlap assembly methods. The four methods discussed here largely circumvent these common sequencing problems, and the new approaches should enhance the quality of the human and model genomes and their databases.
A final point is that the cost of DNA sequencing is continuing to drop (Fig. 19A.11). Current estimates are about $5,000 for a single human genome but the expectation of the $1,000 or $100 genome seems plausible and realistic in the near future, perhaps in the next year or two. Present-day approaches can take weeks or months to assemble a whole genome, but the goal of next gen sequencing is the “15-minute run” by massively parallel sequencing. This will be game changing diagnostically. There are concerns that the infrastructure of sequence analysis, bioinformatics, genetic counseling, and bioethics may not yet be up to the challenge of the anticipated data flood, but this future is upon us.
Stay updated, free articles. Join our Telegram channel

Full access? Get Clinical Tree


