Magnetic Resonance Imaging of the Orbit
Jan W. Kronish
Mark J. Lucarelli
Lindell R. Gentry
Richard K. Dortzbach
The evaluation and management of patients with orbital disease have improved significantly in the past three decades as a result of the technologic advances in diagnostic imaging techniques. In the 1970s, computed tomography (CT) quickly became the method of choice for orbital imaging and largely replaced previously available investigative techniques that were relatively uninformative or potentially dangerous, such as plain films, polytomography, orbitography, venography, and arteriography. Although CT provides excellent anatomic information, it also has significant shortcomings, including a lack of tissue specificity and potential adverse effects from the use of ionizing radiation. Standardized echography of the orbit was developed a few years later and can determine the dynamics and acoustic reflectivity of lesions; however, this ultrasonographic technique has limitations, particularly in the study of diseases of the orbital apex, bony orbit, and periorbital structures.
In the early 1980s, magnetic resonance imaging (MRI) was introduced as a new and innovative technique that provides anatomic and physiochemical information. This technique had previously been used for many years in basic science research of enzymatic reactions and molecular structure using spectroscopy. It was not until 1973 that Lauterbur published the first two-dimensional image produced by MRI techniques, and 1977 when the first medical image, one of a human finger, was revealed by Mansfield.1,2,3,4 Since that time, the improvement of equipment, advances in computer technology, and increasing investigative interest in clinical applications have resulted in the development of an imaging technique of great potential for the assessment of pathophysiologic states in humans.
Magnetic resonance (MR) images are obtained by placing a patient within a strong and highly uniform static magnetic field. The tissue being examined contains numerous hydrogen atoms consisting of one proton, neutron, and electron. The hydrogen atoms behave like small dipole magnets within the magnetic field and become aligned with the magnetic field. Radiofrequency (RF) waves tuned to the Larmor frequency of hydrogen are then applied to the tissue, and these nuclei absorb a portion of the RF energy to enter a state of excitation. The RF pulse is then turned off, allowing the hydrogen nuclei to return to their normal state of equilibrium by giving up energy to the environment (relaxation). The rate, degree, direction, and pattern of resonant energy emission by the relaxing protons can be localized, quantitated, and transformed into diagnostic images.5 Unlike CT images, which are based on differential radiographic absorption, MR images depend on the proton density (hydrogen ion content) and proton relaxation dynamics that are representative of the tissue’s physical and chemical properties.5,6
MRI can provide anatomically detailed images of the orbit that are comparable and, in many cases, superior to high-resolution CT scans. Recent technical developments, including orbital surface coils, fat suppression techniques, fast gradient-echo pulse sequences, and MR contrast agents, allow this noninvasive modality to provide excellent spatial and contrast resolution of the orbital soft tissues with direct multiplanar imaging.7,8,9 In addition, MR spectroscopy, used to evaluate tissue metabolic dynamics at a biochemical level, has tremendous potential in the study of orbital diseases and their response to treatment.5,10
This chapter is organized to provide readers first with a basic background of the physical principles of MRI. An understanding of the “language” associated with this modality, its operating parameters, and its limitations is important for clinicians who consider using this diagnostic method. We then present the MRI findings of the normal orbit and various orbital diseases, based on the experience of the authors and the current literature. Finally, a comparison of MRI with other imaging techniques and future potential applications are discussed.
PHYSICAL PRINCIPLES OF MAGNETIC RESONANCE IMAGING
FUNDAMENTAL PRINCIPLES
The nucleus of an atom contains protons (positive charge) and neutrons (no charge), and each of these elementary particles spins on its own axis. Because of a relationship between electricity and magnetism, the electric charge and spin of these particles produce a small local nuclear magnetic field. In nuclei with an even mass number (an even number of protons and neutrons), the spinning particles are paired and their magnetic properties cancel. However, in nuclei with an odd mass number, such as hydrogen, sodium, and phosphorus, these spinning particles produce a net magnetic moment. Such nuclei behave as magnetic dipoles and respond to external magnetic fields (Fig. 1).1,5,11,12,13,14
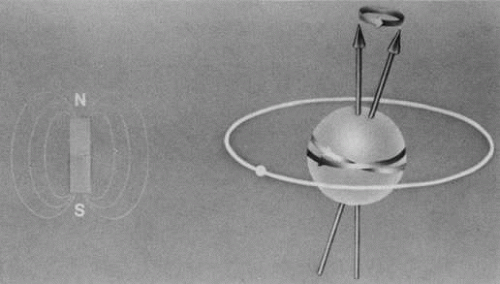 Fig. 1. A hydrogen atom contains a proton that spins on its own axis and an electron in orbit around the nucleus. The rotating nucleus behaves as a magnetic dipole, similar to the bar magnet illustrated on the left. The magnetic moment of the nucleus, denoted by the arrows, is determined by the sum of its magnetic forces. (Dortzbach RK, Kronish JW, Gentry LR: Magnetic resonance imaging of the orbit. Part I. Physical principles. Ophthal Plast Reconstr Surg 5:152, 1989) |
Hydrogen, which contains a single proton, has the largest magnetic moment of all stable atomic nuclei and is highly prevalent throughout biologic tissues. For these reasons, hydrogen forms the basis for MRI and exemplifies its principles. In nature, the magnetic moments of the hydrogen nuclei in biologic tissues are randomly oriented and therefore exhibit no net magnetic effect (Fig. 2). When these nuclei are placed in a strong static magnetic field, such as that produced in an MRI unit, they line up parallel or antiparallel to the field. Slightly more align parallel to the main magnetic field, because this is a lower energy state, and produce a net magnetic vector in this direction (Fig. 3).1,5,8
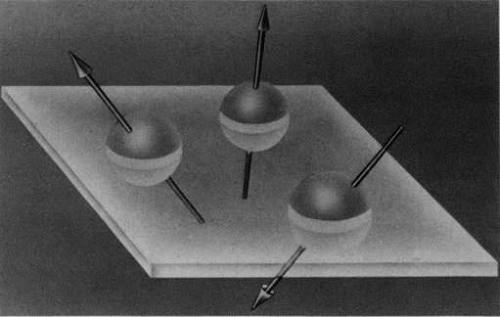 Fig. 2. The magnetic moments of hydrogen nuclei are randomly oriented in nature. (Dortzbach RK, Kronish JW, Gentry LR: Magnetic resonance imaging of the orbit. Part I. Physical principles. Ophthal Plast Reconstr Surg 5:152, 1989) |
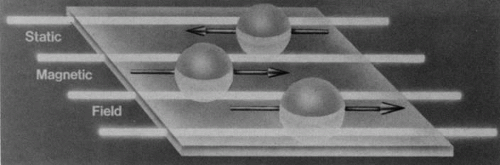 Fig. 3. A net magnetic vector is produced by the nuclei that align parallel to a strong stane magnetic field. (Dortzbach RK, Kronish JW. Gentry LR: Magnetic resonance imaging of the orbit. Part I. Physical principles. Ophthal Plast Reconstr Surg 5:153, 1989) |
RADIOFREQUENCY WAVES
When a properly tuned pulse of RF energy is applied to the tissues in the static magnetic field, the nuclei absorb energy and can shift from parallel to antiparallel alignment (Fig. 4). The energized nuclei are said to “resonate” as they flip to a higher energy state. The duration and amplitude of the RF pulse determine the degree of change of the magnetic moment of each nucleus and the direction of the net magnetic vector. When the RF pulse is turned off, the nuclei “relax” and return to the equilibrium state with the net magnetic vector again parallel in alignment to the direction of the static magnetic field (Fig. 5). The energy released as the nuclei realign at the lower energy state is received as an RF signal by a receiver RF coil, and this signal is processed by a computer to generate an image.1,5,8,12,14
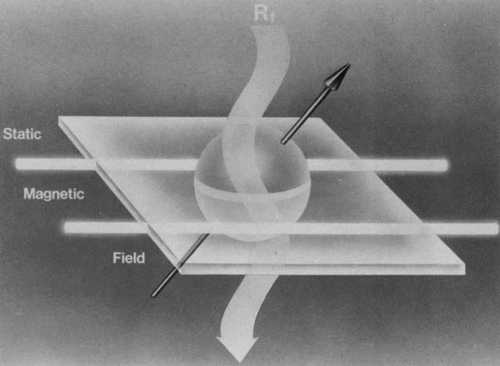 Fig. 4. A radiofrequency (RF) wave applied perpendicular to the static magnetic field is depicted by the undulating arrow directed downward. This RF energy is absorbed by the nuclei, causine them to till out of parallel alignment to an antiparallel orientation and to “resonate” at a higher energy level. (Dortzbach RK. Kronish JW, Gentry LR: Magnetic resonance imaging of the orbit. Part I. Physical principles. Ophthal Plast Reconstr Surg 5:153, 1989) |
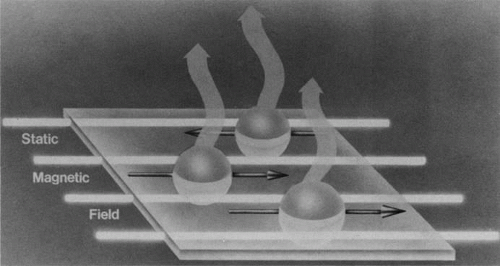 Fig. 5. When the radiofrequency (RF) wave is turned off, the excited nuclei realign parallel to the static magnetic field. The excess energy released as the nuclei “relax” to a lower energy stare is emitted as an RF signal. (Dortzbach RK, Kronish JW, Gentry LR: Magnetic resonance imaging of the orbit. Part I, Physical principles. Ophthal Plast Reconstr Surg 5:153, 1989) |
GRADIENT COILS
The spatial encoding information required for imaging the MR signal is achieved by use of gradient coils. These coils surround the patient’s body in the MRI unit and select the plane (axial, coronal, sagittal, or oblique) to be studied (Fig. 6). A gradient magnetic field is applied by these coils perpendicular to the specified tissue section and isolates the desired plane’s RF signal. These signals are further localized by additional manipulation of the magnetic fields parallel to the tissue section into multiple-volume units called voxels (Fig. 7). Each voxel represents a group of hydrogen nuclei with a unique sum of frequencies and phases. A computer reconstructs the signals from these individual three-dimensional voxels into corresponding pixels that compose the two-dimensional image of that plane. The intensity, or whiteness, of each pixel is proportional to the strength of the RF energy obtained from the corresponding voxel.5,15
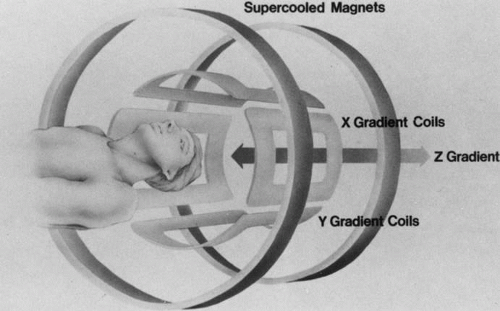 Fig. 6. X, Y, and Z gradient coils surround the area being studied and correspond to the planes chosen to be imaged. (Dortzbach RK, Kronish JW, Gentry LR: Magnetic resonance imaging of the orbit. Part I. Physical principles. Ophthal Plast Reconstr Surg 5:153, 1989) |
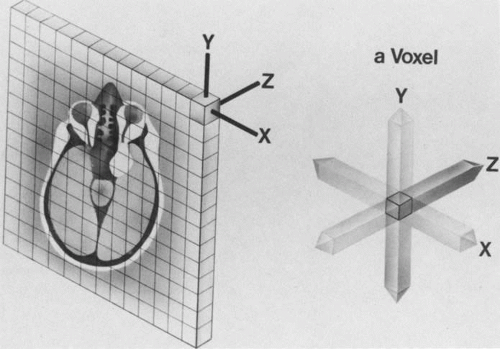 Fig. 7. A thin slice of the area to be studied is divided evenly into multiple 3D voxels. The distinct radiofrequency signal emitted from these voxels determines the intensity of the corresponding pixels, which compose the total image of the slice. (Dortzbach RK, Kronish JW, Gentry LR: Magnetic resonance imaging of the orbit. Part I. Physical principles. Ophthal Plast Reconstr Surg 5:154, 1989) |
SPATIAL RESOLUTION
Spatial resolution in MRI refers to the discrimination between two points in the image and is dependent on the number and size of pixels; thus, a larger number of smaller pixels in a given field of view yields better spatial resolution. For examinations of the orbits that involve a relatively small area, the field of view can be diminished, thereby reducing the pixel size and improving spatial detail. A reduction of the slice thickness of the plane under study (represented by voxel volume) also improves anatomic delineation by limiting partial volume effects. However, a decrease in the field of view, pixel size, or slice thickness may also adversely affect image quality by causing a concomitant reduction in the signal-to-noise ratio (SNR). Therefore, a compromise of the appropriate parameters must be chosen by the MRI operator to achieve the best image quality for a particular area to be studied.5,15,16
CONTRAST RESOLUTION
To distinguish between different anatomic structures as well as pathologic processes, disparate tissues must differ sufficiently in contrast. Contrast resolution is defined as the relative signal difference between two adjoining anatomic structures. Inherent properties of different tissues make MRI a powerful tool because their individual rates of relaxation in a magnetic field result in excellent contrast resolution on MR images. The intrinsic biologic properties that are used as parameters for imaging include the T1 relaxation time constant, the T2 relaxation time constant, the concentration of hydrogen (proton density), and the rate of flow of moving fluids in tissues. Extrinsic parameters used by the MRI operator to further improve tissue contrast include pulse sequences, contrast agents, and fat suppression techniques. Each of these parameters is discussed hereafter.5,8,16
Intrinsic Factors
T1 RELAXATION TIME
Tl relaxation time is the time required for the energized nuclei to give up the excess energy that was acquired from the RF pulse (high-energy state) and re-establish equilibrium (low-energy state) with the main magnetic field. The excess energy is released by these excited nuclei to the surrounding molecular environment, or lattice, and results in T1 relaxation, also called spin-lattice relaxation time. In different biologic tissues, hydrogen has a Tl ranging from a few hundred milliseconds to a couple of seconds. This range exists because local tissue factors affect the ability of specific protons to give up energy to the surrounding tissues. For example, hydrogen atoms attached to the carbon atoms of fat molecules relax much more rapidly than those attached to the oxygen atoms of water molecules. Viscosity, concentration, temperature, and molecular environment of the hydrogen atoms in the tissues also affect the T1 relaxation time. On a T1-weighted orbital image, fat, which has a very short T1 relaxation time, yields a high-intensity signal; the rectus muscles, which have an intermediate T1, yield an intermediate-intensity signal; and the vitreous, which has a long T1, yields a low-intensity signal (Fig. 8).5,8,16
 Fig. 8. T1-weighted image shows the excellent contrast resolution of the soft tissues of the orbit. Note the contrast between the high-intensity (bright) signal of orbital fat and intermediate signal of the extraocular muscles and optic nerves. The lens, vitreous, and sclera can also be easily distinguished. The air in the ethmoidal sinuses emits no signal and therefore appears dark (arrow-head). The left lateral orbital wall also appears dark because of the low proton density and free-water content of cortical bone (short arrows). The bone marrow in the right orbital rim is depicted by a bright signal as a result of its fat contents (long arrow). (Dortzbach RK, Kronish JW, Gentry LR: Magnetic resonance imaging of the orbit. Part II. Clinical applications. Ophthal Plast Reconstr Surg 5:161, 1989) |
T2 RELAXATION TIME.
Application of a 90° RF pulse brings the excited nuclei into phase so that the net vector of their magnetic moments is directed perpendicular to the static magnetic field. Shortly thereafter, the magnetic moments of the nuclei spread out and point in different directions, leading to a loss of phase coherence and a resultant decay in signal intensity amplitude. The T2, or spin-spin relaxation time, is the rate of decrease in the signal of these excited nuclei as a result of the interaction and transfer of energy to unexcited adjacent nuclei. T2 ranges from a few milliseconds to a few hundred milliseconds and, for a given tissue, is always less than the Tl relaxation time. T2-weighted orbital images are easily recognized by a high-intensity signal from the vitreous (Fig. 9).5,8,16
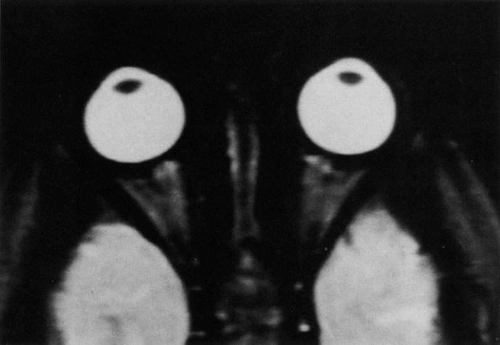 Fig. 9. T2-weighted image of the orbits does not delineate normal anatomic details well. The lens can be visualized in the bright vitreous. (Dortzbach RK, Kronish JW, Gentry LR: Magnetic resonance imaging of the orbit. Part II. Clinical applications. Ophthal Plast Reconstr Surg 5:161, 1989) |
PROTON DENSITY
If enough time is allotted between RF excitations, all of the protons eventually relax and the signal is no longer primarily dependent on the previously mentioned time constants. Images obtained with these parameters are called proton density weighted. These images usually show less contrast resolution than T1- and T2-weighted images because the difference in hydrogen concentration (proton density) of soft tissues is relatively small.5,16
FLOW OF PROTONS
Blood vessels with rapidly flowing blood usually appear as regions of low intensity in contrast to the surrounding tissues. This phenomenon is explained by the fact that excited protons in the blood within the imaging slice that received the RF pulse pass outside the slice before their signal is detected by the RF receiver coils (Fig. 10). By the time the slice is imaged, the replacement blood, which has not received the RF energy stimulus, does not yield a signal, and consequently the blood vessel appears dark.5,17
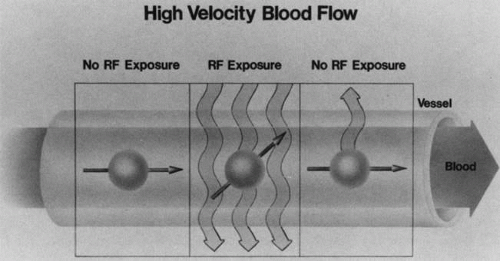 Fig. 10. The lumina of blood vessels containing rapidly flowing blood appear dark because the excited protons in the blood leave the imaging slice before the emitted signal can be detected. This phenomenon is illustrated by dividing a blood vessel into three frames. The nucleus in the central frame energized by the radiofrequency (RF) signal passes out of the imaging plane into the right frame before it relaxes and emits a signal. In the left frame, the hydrogen nucleus is not exposed to the RF waves and therefore cannot give a signal as it enters the imaging plane in the central frame. Therefore, no signal is detected in the blood vessel, which consequently appears dark, (Dortzbach RK, Kronish JW, Gentry LR: Magnetic resonance imaging of the orbit, Part I, Physical principles. Ophthal Plast Reconstr Surg 5:156, 1989) |
Extrinsic Factors
PULSE SEQUENCES
Varying the amplitude, power, and timing of successive RF pulses can alter MRI soft tissue contrast. This technique, known as pulse sequencing, allows the MRI operator to selectively weight the signal contributions of disparate tissues to enhance image contrast. Numerous pulse sequences as well as innumerable variations have been developed by MRI vendors to optimize visualization of different orbital tissues, each of which has different strengths and limitations. Some of the major types of pulse sequences include saturation recovery (SR), also known as partial saturation; inversion recovery (IR); and conventional spin echo (SE), fast spin echo (FSE), and gradient echo (GE). SR images are primarily weighted for Tl and proton density and produce detailed images of normal anatomy. The IR pulse sequence is a T1-weighted sequence that provides excellent contrast resolution but requires a longer imaging time. The conventional SE technique can be used to obtain high quality T1-, T2-, or proton density–weighted orbital scans. This pulse sequence, however, requires relatively long imaging times and has almost been completely replaced by the FSE pulse sequence. The latter can provide similar types of contrast weighting as SE at about one-fourth the imaging time. It is the most common pulse sequence currently used to evaluate pathologic conditions of the orbit. FSE scans utilize a similar TR interval but acquire a “train” of eight to 16 echoes from each excitation. T1-weighted scans are generated from the early group of echoes and T-2-weighted scans from the later group of echoes. FSE images can be weighted toward Tl, T2, or proton density, depending on the selected time parameters. The repetition time (TR), which is the time interval between subsequent RF pulses, and echo delay (TE), which is the time interval between the RF excitation and detection of the signal emitted from relaxing protons, are time parameters that can be altered in any pulse sequence to accentuate differences in the intrinsic responses of tissues being imaged. Gradient-echo pulse sequences are especially useful for rapidly obtaining images of the orbit. Normally, a spin-echo image is generated using at least two RF pulses: a 90° excitation pulse and a refocusing 180° pulse. The latter is used to produce the echo which, in turn, is used to form the image. Alternatively, an echo can be formed by the application of a transient magnetic field gradient after the 90° pulse. Gradient echoes can be produced much more rapidly but are more susceptible to artifacts. Fast, fairly high-quality orbital images that are T1-, T2-, or proton density weighted can be obtained using gradient echoes and RF pulses that are shorter (5° to 60°) in duration than the typical 90° pulses used in SE imaging. These pulse sequences bear different names depending on the specific MRI vendor and specific pulse sequence parameters (GRASS, SPGR, FLASH, FISP, MPGR, etc.).5,8,12,13,14,16,18,19
CONTRAST AGENTS
Contrast agents composed of paramagnetic or superparamagnetic materials can alter tissue properties to improve the MRI detection and characterization of certain pathologic lesions. Gadolinium diethylenetriaminepentaacetic acid (Gd-DTPA), the only paramagnetic agent currently approved in the United States for clinical applications, shortens the relaxation times of adjacent protons (hydrogen nuclei) and results in a bright signal on T1-weighted images. Gadolinium, like most heavy metals, is toxic in its nonchelated form but is safe when strongly bound to DTPA, which serves to eliminate its biologic toxicity. It is administered intravenously and is generally considered safer than iodinated radiographic contrast materials used for CT scans and arteriograms. It has little immunologic, systemic, and renal toxicity.20 Gd-DTPA has been shown to effectively detect disruption of the blood–brain barrier and delineate orbital tumors, such as meningiomas, gliomas, hemangiomas, and metastases (see Lacrimal Gland Tumors and Inflammatory and Lymphoproliferative Lesions in the section on Orbital Diseases). It also appears promising in identifying areas of altered circulation due to inflammation, ischemia, soft tissue injury, and neoplasia.7,8,21,22
FAT SUPPRESSION TECHNIQUES
MR images are produced by signals arising primarily from protons attached to either lipids or water. The protons from water and lipid resonate at slightly different frequencies. Spatial encoding of the x and y coordinates of the MR image from a given pulse sequence requires both phase and frequency information to properly map the signal information to its respective pixel. A well-known phenomenon, chemical shift artifact, is produced when water and fat protons lie in close proximity to each other. Because of the slight difference in the resonate frequencies of the adjacent fat and water protons, they are spatially mismapped in the frequency-encoded direction of the MR image, producing a dark artifactual band on one side of the interface and a bright band on the other side. This results in loss of anatomic detail in MR images of body parts, such as the orbit, that contain both lipid and water. Numerous techniques have been devised to suppress fat signals and improve visualization of lesions that develop in areas of high fat content, such as the orbit (see Intraocular Tumors, below). Three basic methods are in current use: T1-adependent suppression (e.g., short inversion time inversion recovery [STIR]), frequency-selective methods (e.g., chemical shift selective imaging [CHESS]), and phase-dependent methods (e.g., Dixon, Chopper methods).8,22,23,24
MAGNETIC RESONANCE ANGIOGRAPHY AND VENOGRAPHY
The MR angiography (MRA) technique uses fast gradient-echo scans to provide a noninvasive alternative for evaluating the carotid bifurcations and intracranial vessels. The time-of-flight MRA sequence is most commonly used and consists of a series of very thin, flow-sensitized, two-dimensional images that are acquired and subsequently reconstructed into a three-dimensional data set. The three-dimensional data can be rotated into any imaging plane by the computer software, providing images in multiple angiographic projections. MRA has recently become a fixture for noninvasive vascular imaging of the brain, face, and orbit. Advancements in spatial resolution and reduction in examination time has led to routine use of MRA for initial evaluation of vascular abnormalities such as aneurysms, arteriovenous malformations, and vascular tumors.25,26,27 The spatial resolution, however, remains inferior to that of conventional angiography. Angiography is still required for detection of aneurysms less than 2 to 3 mm since these are not reliably detected by MRA. Magnetic resonance venography (MRV) is considered the study of choice for evaluation of cerebrovascular veno-occlusive diseases, such as dural venous or cavernous sinus thrombosis.28
MAGNETIC RESONANCE IMAGING SYSTEMS
MAGNETIC RESONANCE IMAGING UNITS
The largest component of an MRI unit is the magnet, which has a central internal bore into which patients are placed. Superconductive magnets are the most common type of magnet used for medical imaging to generate a uniform magnetic field of sufficient strength. They are cooled by liquid helium and nitrogen to reduce electrical resistance, and most operate between 0.5 and 3 tesla (T). (The tesla is a unit of magnetic field strength. One tesla is approximately 16,000 times greater in magnitude than the earth’s magnetic field.29) Although clinical images can be obtained with much weaker magnets (e.g., 0.2 T), the image quality increases and acquisition time shortens with greater field strengths. Also, spectroscopy and imaging of elements other than hydrogen require high-magnitude magnetic fields.5,15,29,30
Gradient coils are located within the bore of the magnet, and transmitter/receiver RF coils are positioned within the gradient coils. The remainder of the MRI unit is set up similarly to a CT scanner. Patient-handling equipment and gantry are found in the room containing the magnet, and a separate room houses the diagnostic stations and the control panel for the operator. Computers are linked to the system for image reconstruction, analysis, display, and storage.15
SURFACE COILS
Surface coils are RF receiver coils that are exclusively designed for specific areas of study. The smallest diameter coil possible is chosen for the selected region to be imaged and is placed close to that surface in order to reduce the transmission of signals emitted from surrounding tissues not of interest. The SNR from the area of study thus is effectively increased, allowing thinner slices and improved spatial resolution. The primary advantage of a surface coil is improved SNR; the primary disadvantages are limited depth of view and varying signal intensity over the field of view.5,6,8,16,30,31 An orbital coil (Fig. 11) or head coil may also be chosen for high-resolution orbital imaging.
Stay updated, free articles. Join our Telegram channel

Full access? Get Clinical Tree


