Purpose
To study the mean choroidal thickness and volume of the macula in eyes with angioid streaks using swept source optical coherence tomography (OCT) in the 1050-nm wavelength range.
Design
Prospective case series.
Methods
The macular area of 39 eyes of 23 patients with angioid streaks and of 20 normal eyes of 20 matched controls (Group 1) was studied with a swept source OCT prototype system. Eyes with angioid streaks were classified into 1 of 4 groups: those without choroidal neovascularization (CNV) (Group 2); those with CNV that had no history of treatment (Group 3); those with CNV that had previously received only anti–vascular endothelial growth factor treatments (Group 4); and those with CNV that had previously received photodynamic therapy (Group 5). Using a raster scan protocol with 512 × 128 A-scans, we produced a macular choroidal thickness map (6 × 6 mm 2 ).
Results
There were no significant differences in age, axial length, or refractive error among the 5 groups. Mean choroidal thickness of the macula in Group 2 (218.9 ± 46.8 μm) was as great as that in Group 1 (218.8 ± 69.2 μm). However, the macular choroidal thickness in Group 3 (119.7 ± 49.2 μm), Group 4 (140.1 ± 64.9 μm), and Group 5 (144.0 ± 52.6 μm) was significantly less than that of Group 1 ( P < .05). There were no statistical differences between Groups 3 through 5. In each group, the choroid of the nasal quadrant was significantly thinner compared to that in other quadrants ( P < .05).
Conclusions
The choroid in eyes with angioid streaks without CNV was as thick as that in normal controls, but was significantly thinner in eyes with angioid streaks that had developed CNV.
Pseudoxanthoma elasticum is a rare multisystem disorder associated with a mutation in the ABCC6 gene. Pseudoxanthoma elasticum causes progressive fragmentation and calcification of elastic fibers in connective tissue, resulting in pathologic changes that are most pronounced in the dermis, blood vessels, and Bruch membrane. Characteristic fundus changes of pseudoxanthoma elasticum are peau d’orange, areas of chorioretinal atrophy, and angioid streaks. Angioid streaks are irregular crack-like dehiscences in the Bruch membrane that often allow the ingrowth of choroidal neovascularization (CNV) through Bruch membrane defects. CNV secondary to angioid streaks occurs in 72% to 86% of eyes, is bilateral in more than 70% of cases, and often occurs at a younger age than does the CNV of age-related macular degeneration (AMD). Because CNV secondary to angioid streaks is often refractory to treatment, it leads in many cases to poor vision if the CNV involves the macular area.
Recently, the choroid, which is a structure with one of the highest blood flows in the body, has been reported to be involved in the pathogenesis of various ocular diseases, including AMD, polypoidal choroidal vasculopathy, central serous chorioretinopathy, Vogt-Koyanagi-Harada disease, and myopic chorioretinal degeneration. In angioid streaks, although the Bruch membrane is thought to be most affected, previous reports have suggested that the choroid is also involved in the pathogenesis of CNV. Today, optical coherence tomography (OCT) is used to measure retinal thickness and to detect morphologic changes in various retinal diseases. However, commercially available OCT equipment visualizes the entire choroid only in eyes with high myopia because of low penetration and high backscattering at the level of the retinal pigment epithelium (RPE). So, to date, little in vivo information is available on the choroidal changes associated with angioid streaks.
Since Spaide and associates introduced enhanced depth imaging OCT based on spectral-domain OCT technology, many investigators have studied the choroidal thickness in eyes with various pathologies. Although normal choroidal thickness in the macula varies with region and can vary even more in pathologic conditions, in most of these studies the choroidal thickness was measured at the foveal center or, sometimes, at several measurement points. This is because enhanced depth imaging requires the averaging of 50 to 100 B-scans of an identical location of interest, hindering us from high-density scanning. With the advances in OCT technology, the recent generation has used swept source laser technology, which has the advantage of a high-speed scanning rate and low-sensitivity roll-off vs depth compared to spectral-domain OCT. With the use of a light source at the 1-μm wavelength region, swept source OCT allows for a high-contrast, high-penetration image of the entire choroid. Based on these advantages, swept source OCT at a longer wavelength allows us to obtain a 3-dimensional (3D) high-contrast image of the choroid.
In the study described herein, we scanned the macular area of eyes with angioid streaks associated with pseudoxanthoma elasticum using swept source OCT at 1050 nm with a 3D raster scan protocol, and produced a choroidal thickness map of the macular area. By applying the grid used by the Early Treatment Diabetic Retinopathy Study (ETDRS) to this map, the mean choroidal thickness and volume in each sector was measured and compared with those of normal subjects.
Patients and Methods
This prospective study consisted of 39 eyes of 23 patients with angioid streaks secondary to pseudoxanthoma elasticum. The macular area of these 39 eyes was examined with a swept source OCT prototype system at Kyoto University Hospital between September 2010 and November 2011. The diagnosis of pseudoxanthoma elasticum was based on systemic manifestations, fundus examination, and fluorescein angiography, and the diagnosis was confirmed by characteristic histopathologic abnormalities in a skin biopsy.
All subjects underwent a thorough ocular examination, including autorefractometry (ARK1; Nidek, Gamagori, Japan), best-corrected visual acuity measurement with a 5-meter Landolt chart, axial length measurement using ocular biometry (IOLMaster; Carl Zeiss Meditec, Jena, Germany), slit-lamp examination, intraocular pressure measurement, dilated color fundus photography (TRC50LX; Topcon Corp, Tokyo, Japan), and prototype swept source OCT examination. All eyes with angioid streaks underwent simultaneous fluorescein angiography and indocyanine green angiography using Spectralis HRA+OCT (Heidelberg Engineering, Heidelberg, Germany). Eyes with poor images attributable to opaque media (eg, cataracts or vitreous hemorrhage) or to unstable fixation were excluded from the study.
Eligible eyes with angioid streaks were classified into 4 groups based on the presence of CNV and the previous treatment of the CNV: eyes with angioid streaks without CNV (Group 2), eyes with CNV secondary to angioid streaks that had no history of treatments (Group 3), eyes with CNV secondary to angioid streaks that had previously received only anti–vascular endothelial growth factor (VEGF) treatments with no history of photodynamic therapy (PDT) (Group 4), and eyes with CNV secondary to angioid streaks that did have a history of PDT (Group 5). Data obtained from the 4 groups with angioid streaks were compared with data obtained from 20 healthy eyes (20 subjects) of controls, matched for age, axial length, and refractive error (Group 1). Exclusion criteria for these 20 controls included history or evidence of chorioretinal or vitreoretinal diseases, including AMD, diabetic retinopathy, central serous chorioretinopathy, epiretinal membrane, and macular dystrophy, or a history of intraocular surgery. Subjects with systemic diseases or conditions that might affect retinal or choroidal thickness were also excluded.
Swept Source OCT System and Scan Protocols
The prototype swept source OCT system (Topcon Corp) used in the current study has been reported previously. In brief, this swept source OCT system uses a light source of a wavelength-sweeping laser centered at 1050 nm with 100 000-Hz repetition rate. Axial and transverse resolutions were 8 μm and 20 μm in tissue, respectively. Swept source OCT imaging operated at the 1-μm wavelength region was conducted at ∼1 mW on the cornea, which is well below the safe retinal exposure limit established by the American National Standards Institute.
Swept source OCT examinations of the eligible subjects were performed by trained examiners after pupil dilation. A 3D imaging data set was acquired on each subject by using a raster scan protocol of 512 (horizontal) × 128 (vertical) A-scans per data set (total 65 536 axial scans/data set) in 0.8 seconds. Each 3D raster scan covered a 6 × 6-mm 2 area centered on the fovea, which was confirmed by internal fixation and by a fundus camera built into the swept source OCT system. To reduce speckle noise, each image was enhanced by weighted moving average of 3 consecutive original images.
In each subject, 50 averaged horizontal and vertical scan images in 12-mm transverse scan length were obtained as well. The 50 single images, where each image consisted of 1024 A-scans, were registered and averaged by software to create an averaged single image. The vertical scan was centered on the fovea while the horizontal scan was centered on the midpoint between the fovea and optic disc.
Choroidal Thickness and Volume Measurement Protocol
The choroidal thickness was measured as the distance between the outer border of the RPE and the chorioscleral border. In areas where the RPE was defective, the Bruch membrane was considered as an inner border of the choroid. In each image of the 3D data set, lines of both RPE and the chorioscleral border were determined manually by a trained observer in a masked fashion. Automated built-in calibration software determined the distance between these 2 lines. The measurement points per image consisted of 512 points with an interval of ∼12 μm. From the 128 images of each 3D data set, a choroidal thickness map of 6 × 6-mm 2 area was created. After the choroidal thickness map was obtained, the ETDRS grid was applied to the map.
We compared data on the mean choroidal thickness and volumes of the ETDRS grid between the 5 study groups and also compared these values within each group. Using the averaged OCT images, we also performed measurement of retinal thickness and of choroidal thickness at the center of the fovea. Retinal thickness was defined as the distance between the vitreoretinal interface and RPE.
Statistical Analysis
Statistical analysis was performed using SPSS statistical software (version 16; SPSS Inc, Chicago, Illinois, USA). All values are presented as mean ± standard deviation. The data were analyzed using 1-way analysis of variance with Tukey’s post hoc analysis to compare mean choroidal thickness and volume at different regions. To compare the thickness and volume data in each group, 2-way analysis of variance was used. P values less than .05 were considered to be statistically significant.
Results
In the current study, 39 eyes (23 patients, 14 men and 9 women) with angioid streaks secondary to pseudoxanthoma elasticum, ranging in age from 57 to 80 years (mean: 65.4 ± 7.4 years), were examined. Mean refractive error was −1.19 ± 2.15 diopters (range: −5.5 to +1.75 diopters). Mean axial length was 23.83 ± 1.39 mm (range: 22.15 to 26.54 mm). Eyes with angioid streaks were classified into 4 groups: those with angioid streaks but with no CNV (Group 2, n = 6); eyes with CNV secondary to angioid streaks with no history of treatments for their CNV (Group 3, n = 7); eyes with CNV secondary to angioid streaks with a history of only anti-VEGF treatments for their CNV (Group 4, n = 11); and eyes with CNV secondary to angioid streaks with a history of PDT (Group 5, n = 15). Table 1 shows the ocular characteristics of each group. All eyes in Group 4 received anti-VEGF treatments for CNV, with the mean number of injections being 3.4 ± 2.1. Eyes in Group 5 received 2.9 ± 1.9 PDT treatments and 3.1 ± 3.9 anti-VEGF treatments. There were no differences in age, axial length, or refractive error between the 5 groups.
| Group 1 Normal Eyes | Group 2 AS Without CNV | Group 3 AS With CNV and No History of Treatment | Group 4 AS With CNV and a History of Only Anti-VEGF Treatments | Group 5 AS With CNV and a History of PDT | P Value | |
|---|---|---|---|---|---|---|
| Number of eyes | 20 | 6 | 7 | 11 | 15 | |
| Sex (male/female) | 10/10 | 4/2 | 4/3 | 8/3 | 8/7 | |
| Age (years) | 67.4 ± 13.2 | 66.0 ± 6.8 | 65.1 ± 7.1 | 65.6 ± 7.8 | 66.7 ± 9.9 | .960 |
| Axial length (mm) | 23.5 ± 1.3 | 23.3 ± 1.0 | 23.6 ± 1.1 | 23.9 ± 1.5 | 23.4 ± 1.8 | .949 |
| Refractive error (diopters) | −0.51 ± 2.96 | 0.01 ± 1.02 | 0.11 ± 1.93 | −1.38 ± 2.50 | −2.20 ± 1.90 | .134 |
| Visual acuity (logMAR) | 0.01 ± 0.21 | −0.14 ± 0.05 | 1.02 ± 0.32 a | 0.45 ± 0.61 a | 0.80 ± 0.45 a | <.001 |
| Foveal retinal thickness (μm) | 204.4 ± 35.5 | 194.0 ± 12.6 | 260.3 ± 119.5 | 209.9 ± 97.8 | 154.4 ± 64.3 | .027 |
| Foveal choroidal thickness (μm) | 254.8 ± 76.0 | 244.7 ± 51.0 | 142.0 ± 67.9 a | 144.0 ± 79.8 a | 124.8 ± 54.2 a | <.001 |
| Mean choroidal thickness within a circle of 1.0-mm diameter (μm) | 238.7 ± 75.0 | 239.0 ± 45.4 | 117.4 ± 55.9 a | 144.1 ± 69.8 a | 130.5 ± 52.8 a | <.001 |
| Mean choroidal thickness within a circle of 3.0-mm diameter (μm) | 233.0 ± 72.4 | 232.7 ± 49.7 | 116.5 ± 52.4 a | 139.0 ± 68.9 a | 137.7 ± 57.6 a | <.001 |
| Mean choroidal thickness within a circle of 6.0-mm diameter (μm) | 218.8 ± 69.2 | 218.9 ± 46.8 | 119.7 ± 49.2 a | 140.1 ± 64.9 b | 144.0 ± 52.6 b | <.001 |
| Choroidal volume within a circle of 1.0-mm diameter (mm 3 ) | 0.187 ± 0.059 | 0.188 ± 0.036 | 0.092 ± 0.044 a | 0.113 ± 0.056 a | 0.102 ± 0.041 a | <.001 |
| Choroidal volume within a circle of 3.0-mm diameter (mm 3 ) | 1.646 ± 0.512 | 1.644 ± 0.351 | 0.823 ± 0.370 a | 0.982 ± 0.487 a | 0.973 ± 0.407 a | <.001 |
| Choroidal volume within a circle of 6.0-mm diameter (mm 3 ) | 6.183 ± 1.957 | 6.185 ± 1.323 | 3.381 ± 1.389 a | 3.959 ± 1.853 b | 4.070 ± 1.487 b | <.001 |
| CNV (active/inactive) | — | — | 4/3 | 5/6 | 1/14 | |
| Treatment | ||||||
| Number of anti-VEGF treatments | 0 | 0 | 0 | 3.4 ± 2.1 | 3.1 ± 3.9 | |
| Number of PDT treatments | 0 | 0 | 0 | 0 | 2.9 ± 1.9 |
a P < .01, compared with Group 1.
Choroidal Structure
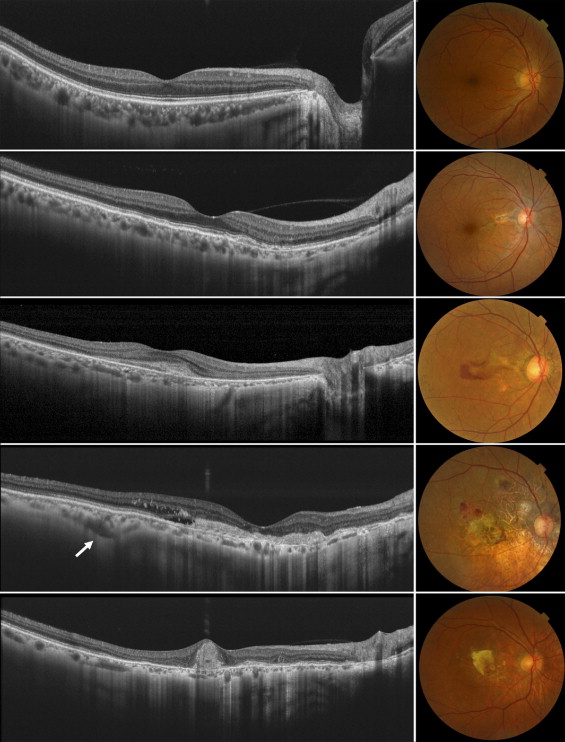
The swept source OCT system operated at 1050-nm wavelength range enables visualization of the clear structure of the posterior pole as well as allowing deeper penetration into the choroid. Multi-averaged scans of 12 mm in length revealed structures of the retina and choroid, which allowed precise identification in all eyes of the chorioscleral border beyond the vascular arcade ( Figure 1 , Left). Figure 2 shows typical cases of each group. In eyes with angioid streaks without CNV (Group 2), the choroid was well preserved and was as thick as that of healthy controls (Group 1). Multi-averaged scans of the current OCT system often show a layer of medium-diameter blood vessels (Sattler’s layer) and an outermost layer of the choroid consisting of larger-diameter blood vessels (Haller’s layer). However, the choroid in eyes with CNV secondary to angioid streaks was remarkably thin with a disorganized configuration of choroidal vessels (Groups 3–5), regardless of a history of treatment. In eyes with CNV secondary to angioid streaks that had a history of PDT (Group 5), choroidal thickness was reduced not only in the macular area, where the PDT was performed, but also beyond the vascular arcade.
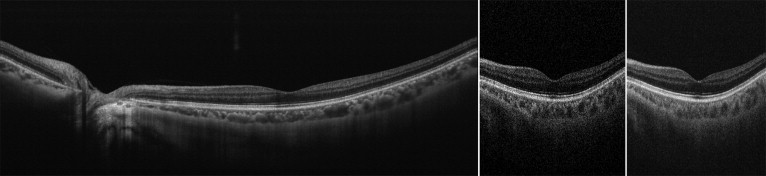
Mean Choroidal Thickness and Volume
Using a raster scan protocol with 512 × 128 A-scans, 3D imaging data of the 6 × 6-mm 2 area were acquired. By weighted moving average, each image had quality sufficient to allow delineation of both the outer border of the RPE and the chorioscleral border, even in eyes with retinal pathology ( Figure 1 , Middle and Right; Supplemental Videos 1 and 2 , available at AJO.com ). Based on 128 images of the 3D data set, a choroidal thickness map of the 6 × 6-mm 2 area centered on the fovea was created for each eye. In the current study, the mean choroidal thickness in the macula (within the outer circle of the ETDRS grid) was 218.8 ± 69.2 μm in Group 1, 218.9 ± 46.8 μm in Group 2, 119.7 ± 49.2 μm in Group 3, 140.1 ± 64.9 μm in Group 4, and 144.0 ± 52.6 μm in Group 5. Mean macular choroidal thickness in Group 2 was as great as that in Group 1 ( Figure 3 ) . However, mean macular choroidal thickness in Groups 3 through 5 was significantly less than that in Group 1 ( P < .05, respectively) ( Figure 4 ) . There were no statistical differences between Groups 3 and 5.
Choroidal Volume
Macular choroidal volume (within the outer circle of the ETDRS grid) was 6.183 ± 1.957 mm 3 in Group 1, 6.185 ± 1.323 mm 3 in Group 2, 3.381 ± 1.389 mm 3 in Group 3, 3.959 ± 1.853 mm 3 in Group 4, and 4.070 ± 1.487 mm 3 in Group 5. In Groups 3 through 5, choroidal volume of the macula was significantly reduced compared with that of Group 1 ( P < .05, respectively). There were no statistical differences between Groups 3 through 5. Table 2 shows the choroidal volume in each sector of the ETDRS grid. In most sectors, choroidal volume in Groups 3 through 5 was significantly less than that of Group 1, respectively.
| Sector | Mean Choroidal Volume (mm 3 ) | ||||
|---|---|---|---|---|---|
| Group 1 Normal Eyes | Group 2 AS Without CNV | Group 3 AS With CNV and No History of Treatments | Group 4 AS With CNV and a History of Only Anti-VEGF Treatments | Group 5 AS With CNV and a History of Photodynamic Therapy | |
| Central area ( P value a ) | 0.187 ± 0.059 | 0.188 ± 0.036 (1.000) | 0.092 ± 0.043 (.001) | 0.113 ± 0.056 (.002) | 0.102 ± 0.041 (<.001) |
| Inner superior ( P value a ) | 0.375 ± 0.114 | 0.402 ± 0.081 (.947) | 0.186 ± 0.080 (.001) | 0.232 ± 0.119 (.005) | 0.229 ± 0.098 (.001) |
| Inner nasal ( P value a ) | 0.354 ± 0.118 | 0.331 ± 0.084 (.990) | 0.150 ± 0.615 (<.001) | 0.203 ± 0.117 (.004) | 0.164 ± 0.080 (<.001) |
| Inner inferior ( P value a ) | 0.368 ± 0.113 | 0.352 ± 0.097 (.989) | 0.182 ± 0.104 (.003) | 0.207 ± 0.108 (.002) | 0.228 ± 0.113 (.003) |
| Inner temporal ( P value a ) | 0.369 ± 0.119 | 0.371 ± 0.073 (1.000) | 0.212 ± 0.092 (.007) | 0.226 ± 0.097 (.003) | 0.249 ± 0.090 (.006) |
| Outer superior ( P value a ) | 1.301 ± 0.379 | 1.361 ± 0.322 (.984) | 0.753 ± 0.296 (.007) | 0.887 ± 0.422 (.018) | 0.873 ± 0.289 (.006) |
| Outer nasal ( P value a ) | 0.939 ± 0.375 | 0.826 ± 0.218 (.878) | 0.384 ± 0.192 (.002) | 0.554 ± 0.384 (.014) | 0.473 ± 0.220 (.001) |
| Outer inferior ( P value a ) | 1.111 ± 0.394 | 1.173 ± 0.414 (.983) | 0.659 ± 0.300 (.046) | 0.713 ± 0.324 (.029) | 0.805 ± 0.347 (.085) |
| Outer temporal ( P value a ) | 1.185 ± 0.378 | 1.197 ± 0.231 (1.000) | 0.770 ± 0.286 (.033) | 0.806 ± 0.278 (.021) | 0.946 ± 0.280 (.139) |
Stay updated, free articles. Join our Telegram channel

Full access? Get Clinical Tree


