Purpose
To investigate the microperimetric correlations of autofluorescence imaging and optical coherence tomography (OCT) in dry age-related macular degeneration (AMD).
Design
Retrospective, observational, cross-sectional study.
Methods
Consecutive patients with dry AMD underwent a complete ophthalmologic examination, including best-corrected visual acuity (BCVA), blue fundus autofluorescence (FAF), near-infrared autofluorescence, and spectral-domain (SD)-OCT with integrated microperimetry.
Results
A total of 58 eyes of 29 patients (21 women; mean age 73 ± 9 years) were included. Mean BCVA was 0.28 ± 0.3 logarithm of the minimal angle of resolution (logMAR). Overall, 2842 points were analyzed as regards FAF and near-infrared autofluorescence patterns, the status of inner segment/outer segment (IS/OS) interface, and retinal sensitivity. We observed a good correlation between the FAF and near-infrared autofluorescence patterns for all the points graded (increased FAF/near-infrared autofluorescence, Pearson rho = 0.6, P = .02; decreased FAF/near-infrared autofluorescence, Pearson rho = 0.7, P = .01; normal FAF/near-infrared autofluorescence, Pearson rho = 0.7, P = .01). Mean retinal sensitivity was significantly reduced in cases of decreased FAF (4.73 ± 2.23 dB) or increased FAF (4.75 ± 2.39 dB) compared with normal FAF (7.44 ± 2.34 dB) ( P = .001). Mean retinal sensitivity was significantly reduced in case of decreased near-infrared autofluorescence (3.87 ± 2.28 dB), compared with increased near-infrared autofluorescence (5.76 ± 2.44 dB) ( P = .02); mean retinal sensitivity in case of increased near-infrared autofluorescence was significantly reduced compared with normal near-infrared autofluorescence (7.15 ± 2.38 dB) ( P = .002). On SD-OCT, there was a high inverse correlation between retinal sensitivity and rate of disruptions in IS/OS interface (Pearson rho = −0.72, P = .001).
Conclusion
A reduced retinal sensitivity consistently correlates with decreased FAF/near-infrared autofluorescence and a disrupted IS/OS interface. Increased near-infrared autofluorescence may represent a useful method for detection of retinal abnormalities early in dry AMD development.
Age-related macular degeneration (AMD) is the leading cause of irreversible blindness among individuals older than 50 years. The dry form of the disease is characterized by the presence of drusen, pigment abnormalities (focal hyperpigmentation or hypopigmentation of the retinal pigment epithelium [RPE]), and geographic atrophy (GA) of the macula. Stereoscopic color fundus photography has represented the gold standard in evaluating the severity and progression of AMD in major epidemiologic eye disease studies, such as the Age-Related Eye Disease Study (AREDS). However, color fundus photography presents limitations in the evaluation of dry AMD attributable to the inter-patient variability of fundus pigmentation, media opacities, the variability of drusen appearance, the presence of small satellites of atrophy, and the impossibility to detect 3-dimensional anatomic information of retinal abnormalities. Blue fundus autofluorescence (FAF) has recently gained popularity to image dry AMD. FAF generated with short-wavelength excitation is dominated by RPE lipofuscin, a complex mixture of fluorophores that are by-products of the visual cycle, and accumulate in the RPE after phagocytosis. Lipofuscin fluorescence occurs between 500 and 750 nm with a peak emission of ∼630 nm. Dry AMD is characterized by a loss of FAF, because of the loss of lipofuscin contained within the RPE. It is generally admitted that change in FAF during degeneration is characterized by a progression from normal to increased, and then decreased, FAF. In fact, increased FAF likely indicates areas of increased phagocytosis with lipofuscin formation. Spots of reduced FAF might represent reduced or absent phagocytosis with reduced lipofuscin production and melanin activity in RPE cells, thus indicating advanced degeneration before GA development. The complete absence of FAF corresponds to areas with complete RPE loss in GA. Limitations of blue FAF are the difficulty of obtaining good-quality images in the presence of advanced cataracts, and, when using the scanning laser ophthalmoscope (SLO), macular xanthophylls that absorb the excitation light and block FAF from the underlying RPE. Fundus autofluorescence excited in the near-infrared at 805 nm has been recently proposed as a useful imaging modality in the evaluation of dry AMD. There are strong data to assume that the main origin of the near-infrared autofluorescence signal is derived from melanin, a fluorophore in the RPE cells and the choroid.
Point-to-point correlation between fundus autofluorescence features and functional impairment may provide further insights into the development and progression of dry AMD. Recently, using microperimetry, Parisi and associates and Dinc and associates have demonstrated a significantly decreased retinal sensitivity in eyes with early and late AMD.
Spectral-domain optical coherence tomography (SD-OCT) technology improves resolution, compared to time-domain OCT. SD-OCT scans show bands that seem to correspond to the anatomic layers of the human retina, and allow seeing details of photoreceptor layer, including a distinct hyperreflective line representing the inner segment/outer segment (IS/OS) interface.
In this study we investigated the functional correlates of autofluorescence imaging of the fundus (FAF and near-infrared autofluorescence) and SD-OCT features in patients with dry AMD. To the best of our knowledge, no other studies have analyzed the correlation, point-to-point, between changes on blue fundus autofluorescence and near-infrared autofluorescence, and functional impairment on microperimetry.
Methods
All consecutive patients with dry AMD that presented at the University Eye Clinic of Creteil between January 2011 and June 2011 were included in this retrospective study. Inclusion criteria were age >50 years, presence of soft indistinct drusen combined with RPE changes in the macular area, and geographic atrophy as manifestation of AMD defined as any sharply demarcated area of apparent absence of the RPE, larger than 175 μm, with visible choroidal vessels with no signs of choroidal neovascularization (CNV), intraretinal or subretinal fluid, or hemorrhage. Exclusion criteria were presence of CNV, any prior treatment (such as laser photocoagulation, photodynamic therapy, intravitreal injections of steroids, or anti–vascular endothelial growth factor), and high myopia (>6 diopters).
All patients underwent a complete ophthalmologic examination that included best-corrected visual acuity (BCVA) using standard Early Treatment of Diabetic Retinopathy Study (ETDRS), fundus examination, color fundus photography, fundus autofluorescence imaging (FAF and near-infrared autofluorescence) (Spectralis HRA+OCT; Heidelberg Engineering, Heidelberg, Germany), and SD-OCT (Spectral OCT/SLO; OPKO-OTI, Miami, Florida, USA).
Also, in all patients, the functional changes secondary to dry AMD were evaluated by microperimetry (Spectral OCT/SLO; OPKO-OTI). Spectral OCT/SLO and microperimetry techniques have been previously described elsewhere. In brief, the Spectral OCT/SLO combines simultaneous high-resolution cross-sectional OCT imaging of retinal layers with en face fundus imaging of the retina using the scanning laser ophthalmoscope. The light source of the Spectral OCT/SLO is a superluminescent diode, with a 40-nm bandwidth centered at 830-nm wavelength, and the spectrometer captures 28 000 A-scans/second; this speed allows acquisition of up to 128 longitudinal OCT scans in 2 seconds. During the microperimetry, the patient was instructed to maintain fixation on the central target and to push the handheld button every time a stimulus was seen. Once the patient’s fundus was aligned and focused properly, the operator designated which vessel to track and adjusted the location of the stimulus pattern to the area of interest. A square test pattern, the “square 7 × 7” (49 points), was used to test the patients. It incorporates the following features: Goldman III stimulus size, 200−millisecond stimulus duration, and a 1500−millisecond interval between stimuli presentation and a 4−2 strategy. The system automatically tracks fundus localization according to the retinal vessel alignment to ensure accurate stimuli placement, and testing pauses automatically if the patient is unable to maintain good fixation. At the end of the test, each of the 49 tested retinal points receives a numerical value, representing the threshold sensitivity at that point on the retina. The microperimetry values are expressed in numerical units, ranging from 0 to 20 (low to high sensitivity, respectively).
Image Analysis
A standardized imaging protocol was performed in all patients, which included acquisition of near-infrared autofluorescence (excitation λ = 787 nm; emission λ > 800 nm; field of view, 30 × 30 degrees; image resolution, 768 × 768 pixels), fundus autofluorescence and fluorescein angiography (excitation λ = 488 nm; emission λ > 500 nm; field of view, 30 × 30 degrees; image resolution 768 × 768 pixels). With confocal image acquisition, light from a conjugate plane of interest is detected by the image sensor, permitting suppression of light from planes anterior and posterior to the plane of interest and resulting in high-contrast fundus images. Using automated eye tracking and image alignment based on confocal scanning laser ophthalmoscope (cSLO) images, the software allows averaging a variable number of single images in real time (ART [Automatic Real Time] Module; Heidelberg Engineering).
For each study eye, 1 combined cSLO FAF and near-infrared autofluorescence ART image (up to 100 single images) was selected for further analysis and exported as a bitmap to image-analysis software (Photoshop 7.0; Adobe Systems Inc, Mountain View, California, USA). To acquire separate cSLO FAF and near-infrared autofluorescence images, each image file was cropped in half; 2 separate files were saved, and individual brightness and contrast settings were optimized for each file. The optimization process consisted of improving image brightness by stretching the pixel histogram using the entire range of available pixel values (0−255). Image contrast was manually adjusted so that the visualization of the details was subjectively maximally enhanced.
The microperimetry sensitivity map was then overlaid onto the FAF and near-infrared autofluorescence images using image-analysis software (Photoshop 7.0; Adobe Systems Inc). For every single retinal point tested with the microperimetry on each eye, the FAF pattern (“increased” compared to background FAF; “decreased” compared to background FAF; “normal” compared to background FAF) and near-infrared autofluorescence pattern (“increased” compared to background near-infrared autofluorescence; “decreased” compared to background near-infrared autofluorescence; “normal” compared to background near-infrared autofluorescence) were graded. Independent grading of FAF and near-infrared autofluorescence images was carried out by 2 trained retinal specialists (G.Q. and R.F.). An intergrader reliability analysis using the kappa statistic was performed to determine consistency among raters. In case of disagreement, arbitration grades were awarded by a different retinal specialist (E.H.S.) and these results were taken as final.
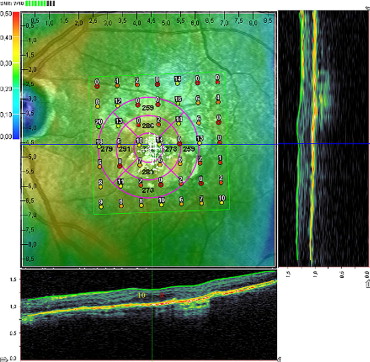
Also, using the standard software of Spectral OCT/SLO, which allows examination of OCT horizontal and vertical cross sections at any specific point on the 3-dimensional fundus maps by adjustment of the horizontal and vertical cursor lines ( Figure 1 ) , microperimetry test results were superimposed on SD-OCT scans and retrospectively analyzed in each patient. For each of the 49 points of square 7 × 7 test pattern, the status of IS/OS interface was determined and was graded as either intact (present or continuous) or disrupted (absent or discontinuous) by 2 trained retinal specialists (G.Q. and R.F.). In case of disagreement, arbitration grades were awarded by a different retinal specialist (E.H.S.) and these results were taken as final.
Statistical calculations were performed using the Statistical Package for Social Sciences (version 17.0, SPSS Inc, Chicago, Illinois, USA). Generalized estimating equations were used to account for the correlation between eyes. Differences in mean sensitivity for the points graded as decreased FAF/near-infrared autofluorescence, increased FAF/near-infrared autofluorescence, and normal FAF/near-infrared autofluorescence were analyzed using Student t test. Correlation between FAF and near-infrared autofluorescence patterns, between retinal sensitivity and the FAF and near-infrared autofluorescence pattern, between IS/OS status and FAF/near-infrared autofluorescence patterns, and between retinal sensitivity and the status of IS/OS interface in every single retinal point tested with the microperimetry was calculated using the Pearson correlation coefficient (rho). The relationship between each of the 20 possible numerical values of retinal sensitivity (range, 0−20) and corresponding status of IS/OS interface was assessed in order to evaluate whether a lower microperimetry value correlated with a higher probability to find IS/OS interface disruption. The mean sensitivities on microperimetry (average of all 49 tested points) and the percentage of IS/OS disruptions detected on SD-OCT in all 49 tested points were calculated for each patient. Moreover, a horizontal SD-OCT scan centered on the fovea was used for the evaluation of the status of IS/OS interface, which was then correlated with FAF/near-infrared autofluorescence patterns and BCVA converted to the logarithm of the minimal angle of resolution (logMAR). The chosen level of statistical significance was P < .05.
Stay updated, free articles. Join our Telegram channel

Full access? Get Clinical Tree


