Purpose
To determine the proportion of luminal and stromal areas of normal choroids in the optical coherence tomographic (OCT) images obtained by enhanced depth imaging (EDI)-OCT.
Design
A prospective, masked, observational cross-sectional study.
Methods
setting : This study was performed at the Kagoshima University Hospital, Japan. study population : One hundred and eighty right eyes of 180 healthy volunteers (106 women; mean age of 55.9 years) without ocular pathology. observational procedures : The EDI-OCT images of the posterior choroid 7500 μm from the optic disc in the horizontal plane were converted to binary images. The total cross-sectional choroidal area, luminal area, and stromal area of the choroid were measured. main outcome measures : Correlations between clinical factors and each choroidal structure and ratio of luminal/stromal areas were determined. The correlations of each choroidal structure and the age, sex, axial length (AL), and refractive errors were calculated.
Results
The mean total cross-sectional choroidal area was 1.84 mm 2 (luminal area 1.21 mm 2 and stromal area 0.63 mm 2 ). Multivariate analysis (standardized partial regression coefficient) showed that age (−0.723, P < .001) was significantly correlated with the reduced area of the choroid, and the correlation was greater than that for the AL (−0.408, P < .001). The ratio of luminal/stromal area was significantly reduced in eyes with longer ALs (−0.531, P < .001), and the strength of the correlation was greater than that of age (−0.389, P < .001).
Conclusions
Although both the luminal and the stromal areas decrease with increasing age and with longer ALs, the degree of decrease and areas affected were not the same.
The choroid plays an important role in maintaining the structure and function of the retinal pigment epithelium (RPE) and retina. In addition, accumulating evidence indicates that the choroid plays an important role in the pathogenesis of various retinal diseases. One of the methods used to study normal and diseased choroids in more detail is optical coherence tomography (OCT). Since the introduction of enhanced depth image (EDI)-OCT, the choroid has become an important field for researchers of ocular diseases. This is because quantitative morphologic data on the choroid can be easily collected noninvasively. This advantage has made the information on the choroid more applicable to diagnosing and treating patients. For example, the EDI-OCT images showed that the choroidal thickness could predict the responsiveness of the retina and choroid to anti–vascular endothelial growth factor (VEGF) drugs. Nevertheless, there is still need for obtaining additional information on the morphology and physiology of the choroid.
The morphology of the normal retina is well organized into layers so that it is relatively easy to detect pathologic changes by alterations of the individual layers. The choroid, on the other hand, is composed mainly of vessels and stroma without a well-organized structure. This makes it more difficult to differentiate abnormal from normal choroid in the OCT images. Nevertheless, there have been several studies that assessed the vascular structure of the normal choroid in the OCT images that were helpful in detecting structural changes of the choroid affected by different diseases. However, the methods used required custom-made software, which limited their general use. Because the reproducibility of the results by independent investigators is essential for applying the findings to patients, an easier and quantitative method that is easily accessible to any investigator is necessary.
We recently reported on a new method to differentiate and quantify the choroidal luminal area from the stromal area using an open access software named ImageJ with a detailed protocol. This method can be used by any researcher with easy accessibility. We used this method to determine the overall size of the choroid in the submacular region, and also determined the proportion of luminal to stromal areas in this region. The validity of this method was confirmed by our finding that there was a decrease in the choroidal thickness with increasing age, as has been reported. In addition, the repeatability was shown to be very high.
However, it has not been determined whether the decrease is in the luminal or stromal or both areas. In addition, the demographic factors associated with the decrease have not been determined. Thus, the purpose of this study was to determine the luminal area and the stromal area of the choroid of normal eyes. The areas were measured in the enhanced depth imaging spectral-domain OCT (EDI-SD OCT) images, and the effects of age, axial length, and sex on the cross-sectional choroidal area and luminal/stromal areas were determined.
Patients and Methods
This was a prospective, masked, observational cross-sectional study of 180 eyes of 180 volunteers that was conducted with approval of the Ethics Committee of Kagoshima University Hospital (Kagoshima, Japan) and registered with the University Hospital Medical Network (UMIN)-clinical trials registry (CTR). The registration title is “UMIN000012310, Choroidal structure on OCT images for healthy eyes” (November 16, 2013). A detailed protocol is available at http://www.kufm.kagoshima-u.ac.jp/∼op/gairai/RCstructurestudy.html . All examinations were done at Kagoshima University Hospital, and the data analysis was done at Kagoshima University and Kyushu University. Written informed consent was obtained from all the subjects after an explanation of the procedures to be used and possible complications, and all of the investigative procedures conformed to the tenets of the Declaration of Helsinki.
Prior to the measurements, all of the eyes had a comprehensive ocular examination, which included slit-lamp examinations of the anterior segment of the eye and ophthalmoscopic examinations of the fundus. The intraocular pressure was measured with a pneumotonometer (CT-80; Topcon, Tokyo, Japan), and the axial length was measured with the AL-2000 ultrasound instrument (Tomey, Tokyo, Japan). The best-corrected visual acuity (BCVA) was measured after determining the refractive error with an Auto Kerato-Refractometer (RM8900; Topcon). The right eye of each volunteer was examined.
The eligibility criteria were: age 18 years or older and eyes normal by ophthalmoscopy and OCT. The exclusion criteria included eyes with known ocular diseases such as glaucoma, diabetic retinopathy, presence of systemic diseases such as hypertension and diabetes, high myopia of more than −6.0 diopter (D), prior intraocular surgery or injections, and eyes in which the ocular fundus could not be observed because of media opacities. No eye was excluded owing to poor OCT image quality because of poor fixation.
Choroidal Images Measured by Spectral-Domain Optical Coherence Tomography
The choroidal images were obtained by EDI-OCT as described in detail in our earlier report. The scans were 7 horizontal lines of 30 × 10 degrees through the center of the fovea made with a Heidelberg Spectralis OCT (Spectralis; Heidelberg Engineering, Heidelberg, Germany) instrument. Each image was obtained using the eye tracking system, and 100 scans were averaged. All eyes were examined without mydriasis. Each eye was measured 2 times within 1 hour, and the OCT images were processed by 2 independent examiners (S.S. and M.T.). Because there are significant diurnal fluctuations of the OCT, all examinations on a single patient were done within 1 hour on the same day from 11:00 AM to 1:00 PM.
The methods used to record the normal choroid and image processing were proven to have a high reproducibility and repeatability ; nevertheless, the inter-rater agreement was done for every subject in this study to confirm the reliability of the measurements.
Evaluation of Choroidal Area, Luminal Area, and Stromal Area by Binarization Technique
Our preliminary study showed that the sampling of a small area tended to have a large diversity of the ratio of luminal/stromal area: for example, if an anomalous vascular structure was included in the image, such as a tangential slice of a vessel, it would increase the stromal area strongly. Thus, the examined area was determined for a large 7500-μm-width area. After recording of the EDI-SD OCT images, the best image was displayed on a computer screen and evaluated by 3 masked graders independently (H.K., H.T., and M.S.). When 2 or more graders determined that the choroidal image was clearly distinguishable, the image was deemed acceptable and used for the following analyses.
The upper margin of the region of interest (ROI) was the RPE line and the lower margin was the chorioscleral border in the EDI-SD OCT images. The nasal margin was the edge of the optic nerve head and the temporal margin was 7500 μm temporal from the edge of the optic nerve head. The distance was determined by the auto adjust function embedded in the OCT instrument.
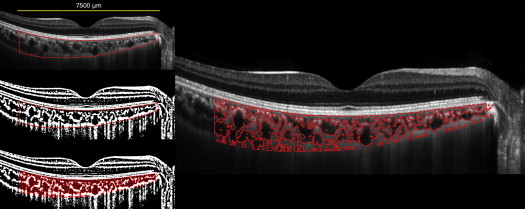
The binarization of the choroidal area in the OCT image was done by a modified Niblack method as reported ( Figure 1 ). Briefly, the OCT image was analyzed by ImageJ (ImageJ version 1.47, National Institutes of Health, Bethesda, Maryland, USA; available at http://imagej.nih.gov/ij/ ). An ROI was selected and set by the ROI manager in the OCT image. Then, 3 choroidal vessels with lumens larger than 100 μm were randomly selected by the oval selection tool of the tool bar, and the average reflectivity of these areas was determined by the software. The average brightness was set as the minimum value to minimize the noise in the OCT image. Then, the image was converted to 8 bits and adjusted by the auto local threshold of Niblack. The binarized image was reconverted to an RGB image, and the luminal area was determined using the threshold tool. After the data for the distance of each pixel were added, the total choroidal area, luminal area, and stromal area were automatically calculated. The light pixels were defined as the stromal choroid or choroidal interstitial area and the dark pixels were defined as the luminal area. A more detailed protocol is described in our earlier report. The inter-rater agreement was examined for each case by 2 examiners (S.S., M.T.).
Statistical Analyses
All statistical analyses were performed with a commercial analytical package (SPSS statistics 19 for Windows; SPSS Inc, IBM, Somers, New York, USA). The inter-rater correlation coefficients were calculated using a 2-way mixed-effects model for measurements of absolute agreement. The correlations between the total cross-sectional choroidal area, the luminal area, the stromal area, the luminal/stromal ratio, and the age, axial length, and refractive error were determined by Spearman correlation analyses. To examine the effect of false correlations, partial correlation coefficients and stepwise regression were also calculated. The differences of the baseline characteristics in relation to the sex were compared with the Mann-Whitney U test. A P value of <.05 was considered to be statistically significant.
Results
Among the 209 individuals examined from November 16, 2013 to March 31, 2014, 74 men and 106 women met the inclusion criteria, and only their right eye was used for the analyses. The other 29 eyes were excluded: 12 eyes owing to myopia more than −6 D, 6 eyes with prior ocular surgery, 3 eyes with ocular diseases such as glaucoma or retinal vein occlusion, and 3 eyes with severe diabetes retinopathy. Six other eyes were excluded because of poor OCT image quality owing to media opacities. Some of the eyes had more than 1 reason for exclusion. The demographic information of the participants is presented in Table 1 .
| Mean ± SD | Range | |
|---|---|---|
| Age (y) | 55.9 ± 18.8 | 22–90 |
| Sex (m/f) | 74/106 | – |
| Axial length (mm) | 24.1 ± 1.3 | 21.9–27.7 |
| Refractive error (D) | −1.23 ± 2.32 | −6.0 to 3.5 |
| LogMAR BCVA | −0.02 ± 0.22 | −1.1 to 1.1 |
| IOP (mm Hg) | 12.8 ± 2.5 | 7–21 |
| Total choroidal area (mm 2 ) | 1.84 ± 0.68 | 0.56–3.75 |
| Luminal area (mm 2 ) | 1.21 ± 0.48 | 0.39–2.51 |
| Stromal area (mm 2 ) | 0.63 ± 0.20 | 0.17–1.24 |
The mean ± standard deviation of the age was 55.9 ± 18.8 years with a range of 22–90 years, and the mean refractive error (spherical equivalent) was −1.23 ± 2.3 D. The mean axial length was 24.1 ± 1.3 mm and the mean IOP was 12.8 ± 2.5 mm Hg. The mean best-corrected visual acuity (BCVA) was −0.02 ± 0.22 logarithm of the minimal angle of resolution (logMAR) units.
Univariate Analysis
Cross-sectional choroidal areas
The mean cross-sectional choroidal area was 1.84 ± 0.68 mm 2 with a range of 0.56–3.75 mm 2 . The luminal area was 1.21 ± 0.48 mm 2 with a range of 0.39–2.51 mm 2 , and the stromal area was 0.63 ± 0.20 mm 2 with a range of 0.17–1.24 mm 2 ( Table 1 ).
The inter-rater agreement of the measurements on the images was significantly high for the cross-sectional choroidal area, with intraclass correlation coefficient (ICC) of 0.990 with a confidence interval (CI) of 0.984–0.993 and coefficient of variation (CV) of 0.37. For the luminal area, the ICC was 0.990, CI was 0.986–0.993, and the CV was 0.40; and for the stromal area the ICC was 0.970, the CI was 0.957–0.978, and the CV was 0.32.
Effect of age
The cross-sectional choroidal area decreased significantly with increasing age (R = −0.55, P < .001, Spearman rank sum test). The luminal area (R = −0.53, P < .001, Spearman rank sum test) and the stromal area (R = −0.58, P < .001, Spearman rank sum test) also decreased significantly with increasing age. Importantly, the ratio of luminal to stromal area also decreased significantly with increasing age, indicating that the area of the vascular lumen decreased more than the stromal area with increasing age (R = −0.18, P = .019, Spearman rank sum test; Figure 2 ).
Effect of axial length
The correlations between the axial length and the cross-sectional choroidal area, stromal area, and luminal area were not significant. However, the ratio of the luminal to stromal area decreased significantly with increasing axial length (R = −0.25, P = .001; Figure 3 ).
Effect of refractive error
The refractive error was not significantly correlated with the cross-sectional choroidal area (R = −0.12, P = .12), luminal area (R = −0.10, P = .19), or the ratio of luminal to stromal area (R = 0.06, P = .40). However, the refractive error was significantly correlated with the stromal area (R = −0.15, P = .04).
Effect of sex
The mean age of the women was 60.3 ± 18.6 years, which was significantly older than that of men at 49.7 ± 17.3 years ( P < .001, Mann-Whitney U test). The axial length was significantly longer in men, at 24.8 ± 1.2 mm, than in women, at 23.7 ± 1.1 mm ( P < .001, Mann-Whitney U test). However, the area of the choroid was 1.92 ± 0.66 mm 2 in men, which was not significantly greater than the 1.78 ± 0.68 mm 2 in women ( P = .16, Mann-Whitney U test). The size of the luminal area was 1.27 ± 0.48 mm 2 in men and 1.17 ± 0.48 mm 2 in women, and the size of the stromal area was 0.66 ± 0.19 mm 2 in men and 0.61 ± 0.21 mm 2 in women ( P = .17 for both, Mann-Whitney U test). The ratio of luminal to stromal area was 1.90 ± 0.26 in men and 1.88 ± 0.26 in women ( P = .66, Mann-Whitney U test).
Interactions of Demographic Factors (Partial Correlation Analysis)
Because each of the demographic factors is probably related to another, the interactions between each factor were examined. Our analyses showed that the age and axial length were significantly correlated (R = −0.51, P < .001). The age and refractive error were also significantly correlated ( R = −0.56, P < .001). Thus, the correlations between axial length and the choroidal parameters were examined by excluding the effect of age using partial correlation coefficients. The results showed that the axial length was significantly and negatively correlated with the total choroidal area (R = −0.41, P < .001), luminal area (R = −0.42, P < .001), stromal area (R = −0.42, P < .001), and the luminal to stromal ratio (R = −0.41, P < .001).
The correlations between the age and choroidal parameters were examined after excluding the effects of the axial length by partial correlation coefficients. The results showed that the age was significantly and negatively correlated with the total choroidal area (R = −0.62, P < .001), luminal area (R = −0.61, P < .001), stromal area (R = −0.63, P < .001), and the luminal to stromal ratio (R = −0.36, P < .001).
Multivariate Analysis
Both the age and axial length were significantly and negatively correlated with the cross-sectional choroidal area, luminal area, and stromal area by multivariate analyses ( Table 2 ). Standardized partial regression coefficient showed that age (−0.707 to −0.739) had a greater effect on any of these areas than axial length (−0.350 to −0.426). On the other hand, the ratio of luminal to stromal area was significantly correlated with the axial length, age, and sex, with women having a lower ratio. Standardized partial regression coefficient showed that the axial length (−0.531) was the factor most significantly correlated with the reduction of the ratio of luminal to stromal area, followed by age (−0.389) and sex (−0.153) ( Table 3 ).


