Purpose
To evaluate in vivo epithelial thickness in dry eye by anterior segment optical coherence tomography.
Design
Observational, retrospective case-control study.
Methods
Two age-matched groups of female subjects, 70 eyes each, age ≈ 55 years, were studied in clinical practice setting: a control (unoperated, no ocular pathology) and a dry eye group (clinically confirmed dry eye, unoperated and no other ocular pathology). Corneal epithelium over the entire cornea was topographically imaged via a novel anterior segment optical coherence tomography (AS-OCT) system. Average, central, and peripheral epithelial thickness as well as topographic epithelial thickness variability were measured.
Results
For the control group, central epithelial thickness was 53.0 ± 2.7 μm (45-59 μm). Average epithelium thickness was 53.3 ± 2.7 μm (46.7-59.6 μm). Topographic thickness variability was 1.9 ± 1.1 μm (0.7-6.1 μm). For the dry eye group, central epithelial thickness was 59.5 ± 4.2 μm (50-72 μm) and average thickness was 59.3 ± 3.4 μm (51.4-70.5 μm). Topographic thickness variability was 2.5 ± 1.5 μm (0.9-6.9 μm). All pair tests of respective epithelium thickness metrics between the control and dry eye group show statistically significant difference ( P < .05).
Conclusions
This study, based on very user-friendly, novel AS-OCT imaging, indicates increased epithelial thickness in dry eyes. The ease of use and the improved predictability offered by AS-OCT epithelial imaging may be a significant clinical advantage. Augmented epithelial thickness in the suspect cases may be employed as an objective clinical indicator of dry eye.
Dry eye is a multifactorial disease of the tears and ocular surface that results in symptoms of discomfort, visual disturbance, and tear film instability with potential damage to the ocular surface. It is accompanied by increased osmolarity of the tear film and inflammation of the ocular surface.
Dry eye is responsible for significant population morbidity and is a common clinical problem for eye clinicians. Besides the significant symptoms and toll on quality of life, it may present significant challenges in refractive surgery patient assessment. As reported in the peer-review literature, its manifestations may range from episodic and mild condition to chronic and severe disease: the disorder can be presented with any or many symptoms of visual disturbance and blurred vision, eye discomfort, irritation, foreign body sensation, ocular surface damage, redness, excess tearing, and photosensitivity.
Epidemiologic review studies estimate the prevalence of dry eye disease between 4% and 33%, largely depending, among other factors, on the diagnosis mode, the geographic locale, age, and sex, being most prominent in the middle-aged (over age 45 years) female populace.
Several clinically available modalities may facilitate in vivo measurement of corneal epithelium, including high-frequency scanning ultrasound biomicroscopy (HF-UBM), anterior segment optical coherence tomography (AS-OCT), and confocal microscopy through focusing (CMTF). In the clinical practice, epithelial evaluation is limited by the resolution and the variability of the ocular surface tests.
In pursuit of an objective, repeatable, and quantitative clinical test that may aid in the differential diagnosis of dry eye, we introduce the concept of corneal epithelial thickness as a possible tool in dry eye assessment. We report herein initial clinical results regarding 3-dimensional corneal epithelial thickness mapping in dry eye corneas with a newly commercially available anterior segment optical coherence tomography system.
Materials and Methods
This observational, retrospective case-control study received approval by the Ethics Committee of our Institution (LaserVision.gr Eye Institute), and was adherent to the tenets of the Declaration of Helsinki. Written informed consent was obtained from each subject for imaging and dry eye assessment at the time of the first clinical visit.
Group Formation, Inclusion/Exclusion Criteria
The “control” group (n = 70 eyes, 35 patients) consisted of female patients with unoperated, normal eyes with no ocular pathology other than refractive error, and no dry eye condition, confirmed by a complete ocular clinical evaluation.
The “dry eye” group (n = 70 eyes, 35 patients) consisted of female patients with clinically confirmed dry eye, otherwise unoperated and with no other ocular pathology, save for possible refractive error. Both groups consisted of female patients because in our practice they compose, in a 10:1 ratio, the dry eye population compared to male subjects that we encounter (unpublished data). Dry eye was diagnosed via tear-film breakup time (TBUT) measurement (dry considered if under 5 seconds) and Schirmer basic lacrimation test (dry considered if under 5 mm). Exclusion criteria were anterior basement membrane and other corneal dystrophies, and/or rheumatic diseases.
No patient with reported previous use of contact lens or with recent dispensing of artificial tear drops was enrolled in this study in either group.
Imaging Instrumentation
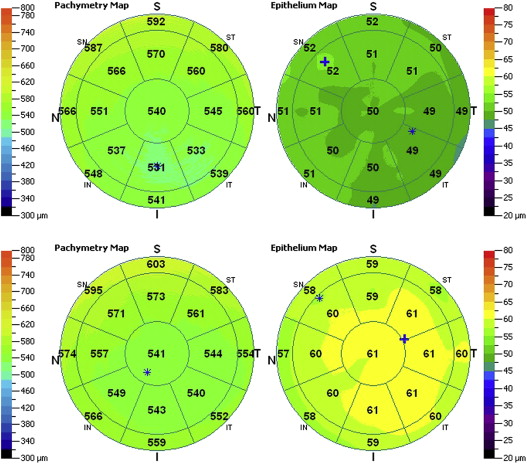
The Fourier-domain AS-OCT system RTVue-100 (Optovue Inc, Fremont, California, USA), running on software version A6 (9,0,27), was employed in the study. Data output included total corneal and corneal epithelial thickness maps over the 6-mm-diameter corneal area (representative examples from both groups shown in Figure 1 ). The settings were L-Cam lens, 8 meridional B-scans per acquisition, consisting of 1024 A-scans each, with axial resolution of 5 μm. Following correct fixation and centering, acquisition time was in the order of few seconds per scan. Four individual acquisitions were performed in each case on the same day. All measurements were obtained by the same investigator prior to any tear-film breakup time measurement and Schirmer lacrimation test.
Data Acquisition and Analysis
For each eye we measured and analyzed statistically within the central 5-mm zone the average, superior, and inferior epithelial thickness, as well as topographic thickness variability, as reported by the standard deviation of the 17 sectors’ (shown in Figure 1 ) local thickness measurements. Average epithelium thickness was computed for each case within the 5-mm zone as the average of the 17 sectors’ local thickness measurements.
Linear regression analysis was performed to seek possible correlations of epithelial thickness. Descriptive statistics (average, minimum, maximum, standard deviation), comparative statistics and linear regression analysis, and receiver operating characteristic (ROC) curve analysis were performed with statistics tools provided by Minitab version 16.2.3 (MiniTab Ltd, Coventry, UK) and SPSS version 21.0 (IBM Corporation, New York, New York, USA).
Results
Mean age at the time of examination for the control group was (average ± standard deviation) 47.5 ± 15.6 years, ranging from a minimum of 35 to maximum of 70 years of age. Mean age for the dry eye group was 50.8 ± 16.9 years, ranging from 36-69 years. The mean age of the control group was not significantly different from the mean age of the dry eye group ( P = .235).
Regarding the dry eye group, mean Schirmer test value, expressed in mm wetting of the paper after 5 minutes (following topical anesthesia), was 2.4 ± 1.8 mm (range 0.6-4.2 mm). For the same group, the tear-film breakup time was 3.5 ± 1.5 seconds (range 2-5 seconds).
The AS-OCT system’s software output produced full corneal thickness as well as epithelium thickness maps, extending to a 6 × 6-mm corneal area. Examples of such maps from each group are shown in Figure 1 . Epithelial thickness comparison between the control and the dry eye groups, specifically central thickness, minimum thickness, maximum thickness, and average, is illustrated in Figure 2 .
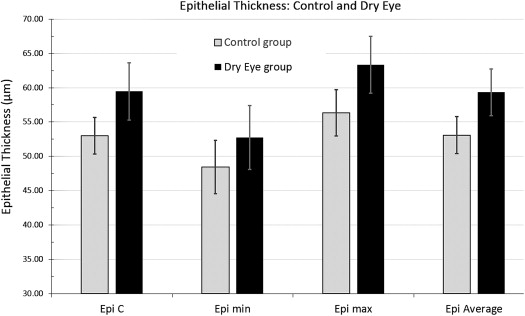
As shown in Table 1 , on average, for the control group, central epithelial thickness was 53.0 ± 2.7 μm, ranging from a minimum of 45 to a maximum of 59 μm. Minimum thickness was on average 48.4 ± 3.9 μm, ranging from 37-55 μm, and maximum thickness was 56.3 ± 3.4 μm, ranging from 49-65 μm, Average epithelial thickness was 53.1 ± 2.7 μm, with a range from 46.70-59.60 μm.
| CCT | Min CT | Epi C | Epi Min | Epi Max | Epi Stdev | Epi Average | |
|---|---|---|---|---|---|---|---|
| Control | |||||||
| Average | 540.7 | 532.5 | 53.0 | 48.4 | 56.3 | 1.8 | 53.1 |
| Stdev | ±23.4 | ±22.9 | ±2.7 | ±3.9 | ±3.4 | ±1.1 | ±2.7 |
| Max | 573 | 565 | 59 | 55 | 65 | 6.2 | 59.6 |
| Min | 494 | 489 | 45 | 37 | 49 | 0.7 | 46.7 |
| Dry eye | |||||||
| Average | 551.1 | 540.0 | 59.5 | 52.7 | 63.4 | 2.5 | 59.3 |
| Stdev | ±21.3 | ±19.5 | ±4.2 | ±4.6 | ±4.1 | ±1.5 | ±3.4 |
| Max | 578 | 570 | 72 | 61 | 77 | 6.9 | 70.5 |
| Min | 513 | 507 | 50 | 37 | 54 | 0.9 | 51.4 |
For the dry eye group, central epithelial thickness was 59.5 ± 4.2 μm, ranging from minimum 50 to maximum 72 μm. Minimum thickness was, on average, 52.7 ± 4.6 μm, ranging from 37-61 μm, and maximum thickness was 63.4 ± 4.1 μm, ranging from 54-77 μm. Average epithelial thickness was 59.3 ± 3.4 μm, with range from 51.4-70.5 μm.
All pair tests of the respective epithelium thickness metrics between the control and dry eye groups show statistically significant differences ( P < .05).
The topographic thickness variability, measured on each eye as the standard deviation of the 17 sectors shown in Figure 1 , was 1.9 ± 1.1 μm (range 0.7-6.1 μm) for the control group and 2.5 ± 1.5 μm (range 0.9-6.9 μm) for the dry eye group.
ROC analysis was performed for the average (as well as central) epithelium thickness as a predictor. As shown in Table 2 , with the area under the curve of 0.93, true positives and true negatives were 58 and 61, respectively, while false positives and false negatives were 12 and 9, respectively.
Stay updated, free articles. Join our Telegram channel

Full access? Get Clinical Tree


