Purpose
To describe the minimum inhibitory concentration (MIC) of fungal isolates to natamycin and voriconazole, and to compare these MICs to previous ocular susceptibility studies.
Design
Experimental laboratory study using isolates from a randomized clinical trial.
Methods
The Mycotic Ulcer Treatment Trial I was a randomized, double-masked, multicenter trial comparing topical natamycin and voriconazole for fungal keratitis treatment. Susceptibility testing to natamycin and voriconazole were performed according to Clinical and Laboratory Standards Institute methods. The relationship between organism and MIC was assessed. A literature review was performed to compare results to previous ocular susceptibility studies.
Results
Of the 323 patients enrolled in the trial, MICs were available for 221 (68%). Fusarium (n = 126) and Aspergillus species (n = 52) were the most commonly isolated organisms. MICs to natamycin and voriconazole were significantly different across all genera ( P < .001). The MIC median (MIC 50 ) and 90th percentile (MIC 90 ) for natamycin were equal to or higher than voriconazole for all organisms except Curvularia species. Compared to other organisms, Fusarium species isolates had the highest MICs to voriconazole and Aspergillus flavus isolates had the highest MICs to natamycin. Our results were similar to previous reports except that the voriconazole MIC 90 against Aspergillus species was 2-fold higher and the natamycin MIC 90 against Aspergillus fumigatus was 4-fold higher in our study.
Conclusion
In this large susceptibility study, Fusarium isolates were least susceptible to voriconazole and A flavus isolates were least susceptible to natamycin when compared to other filamentous fungi. In the future, susceptibility testing may help guide therapy if performed in a timely manner.
Fungal keratitis is a leading cause of visual impairment worldwide. It is endemic in tropical areas, such as south India, where up to half of all infectious keratitis cases are caused by fungus. Filamentous fungi, especially Fusarium species, are the predominant cause of fungal ulcers in tropical regions and are thought to be particularly virulent. Currently, fungal keratitis treatment is largely empirical, with no consensus on the role of susceptibility testing in guiding treatment decisions. Natamycin has long been considered the standard of care for filamentous fungal keratitis and is the only topical ophthalmic antifungal approved by the US Food and Drug Administration. However, newer azoles, including voriconazole, are reported to have good in vitro activity against most isolates from fungal ulcers, though there is mixed evidence regarding activity against Fusarium species.
Antifungal susceptibility studies frequently use systemic isolates or focus on yeast. There are limited reports on filamentous fungi, likely because of the absence of established minimum inhibitory concentration (MIC) clinical breakpoints, which classify isolates as susceptible, intermediate, or resistant to an antimicrobial agent. Susceptibility studies investigating natamycin are also limited, as natamycin is used primarily for treating fungal keratitis. The ocular studies that are present often have small sample sizes or focus on one particular genus or species. Here, we report the in vitro activity of natamycin and voriconazole against filamentous fungal isolates collected as part of a large, randomized comparative trial on fungal keratitis treatment, and investigate the association between organism and MIC. Our relatively large sample size of isolates provides more precision in the estimation of the MIC median (MIC 50 ) and 90th percentile (MIC 90 ) than previously available. For comparison purposes, we also performed a literature review to identify ocular susceptibility studies on filamentous fungi using similar antifungals.
Methods
The Mycotic Ulcer Treatment Trial I (MUTT I) was a randomized, double-masked trial comparing clinical outcomes of filamentous fungal keratitis in patients receiving 5% topical natamycin (Natacyn; Alcon, Fort Worth, Texas, USA) vs 1% topical voriconazole (VFEND IV; Pfizer, New York, New York, USA). Detailed methods for MUTT I have been reported previously. In brief, we enrolled 323 patients with fungal keratitis who had presenting visual acuity of 0.3 logMAR (20/40) to 1.3 logMAR (20/400) at the Aravind Eye Care System (Madurai, Pondicherry, and Coimbatore) in India. The dosing schedules were identical in both treatment arms and consisted of 1 drop to the affected eye every 1 hour while awake for 1 week, then every 2 hours while awake until 3 weeks from enrollment. Continuation of the masked treatment was then at the discretion of the physician. For ethical reasons, physicians were allowed to add or change medications if deemed medically necessary. The MUTT I trial obtained informed consent from all patients, adhered to the Declaration of Helsinki, and received prospective Institutional Review Board (IRB) approval at Aravind, Dartmouth, and the University of California San Francisco (UCSF). MUTT is registered at Clinicaltrials.gov ( NCT00996736 ).
Microbiology
Detailed microbiological methods have been described previously. In brief, corneal scrapings were obtained from all patients who were eligible for the trial, and Gram stains and potassium hydroxide (KOH) wet mounts were performed. Eligible patients were required to have a KOH wet mount positive for fungus and a Gram stain negative for bacteria at enrollment. Fungal cultures were determined to be positive if there was growth on 2 or more media, or if there was moderate to heavy growth on 1 medium. Fungal identification was performed using gross and microscopic characteristics, as described previously.
All samples with a positive fungal culture had susceptibility testing to natamycin and voriconazole performed according to standardized methods outlined in the Clinical and Laboratory Standards Institute (CLSI) document M38-A2. Briefly, broth microdilutions were performed for susceptibility testing using dimethyl sulfoxide (DMSO) as the drug diluent for voriconazole and natamycin. Aspergillus flavus ATCC20430 was included as a quality control isolate. MIC was defined as the lowest concentration that exhibited a 100% visual reduction in turbidity when compared with the control tube for natamycin at 48 hours, and an 80% reduction in turbidity for voriconazole. Only natamycin and voriconazole were tested since these were the treatments used in the clinical trial.
Statistical Analyses
Differences in clinical characteristics between isolates with MIC values and those without were analyzed using Student t test for continuous variables, χ 2 test or Fisher exact test for categorical variables, and log-rank test for time to reepithelialization. Multiple comparisons were corrected for using the Holm method in R 3.0.0 (R Foundation for Statistical Computing, www.R-project.org , Vienna, Austria). The lowest antibiotic concentration that inhibits bacterial growth is termed the MIC, and concentrations that inhibit 50% (MIC 50 ) or 90% (MIC 90 ) were estimated using the PERCENTILE function in Microsoft Excel (Microsoft Inc, Redmond, Washington, USA) and verified by hand to ensure accuracy. The MIC 90 was estimated for organisms with at least 9 observations, the smallest number where extrapolation would not be necessary. The 95% confidence intervals (CI) for the MIC 50 and MIC 90 were estimated as bootstrap percentile confidence intervals in Mathematica 8 (Wolfram, Champaign, Illinois, USA) for genus and species with at least 9 observations. Differences in MIC across groups of organisms were analyzed with 1-way analysis of variance (ANOVA). For each genus and species, the MIC to natamycin was compared with the MIC to voriconazole using Wilcoxon signed rank test. All statistical analyses were conducted using Stata 10.0 (StataCorp, College Station, Texas, USA) unless otherwise specified.
Literature Search for Prior Susceptibility Studies
To identify studies reporting MIC data for ocular isolates tested against natamycin and voriconazole, searches were conducted in Web of Science (all dates up to September 27, 2013) and PubMed (all dates up to September 28, 2013) using the topic search terms (corneal ulcer or keratitis) and (fungal or fungus or fungi) and (susceptibility or susceptibilities). Titles and abstracts were screened to exclude ineligible studies. Eligible studies included those that used ocular fungal isolates and reported MICs, MIC 50 , MIC 90 , or MIC range for Aspergillus genus, A flavus , A fumigatus, Fusarium genus, or F solani against natamycin, voriconazole, or amphotericin B using CLSI protocols (M38-P, M38-A, or M38-A2). Excluded studies included review articles; studies using only systemic isolates, bacterial or parasitic isolates, or animal samples; non-English-language studies; and articles without an accessible web link. In addition, the bibliographies of included studies were searched to identify additional studies.
Results
Of the 323 samples from 323 patients enrolled in the trial, 256 samples (79%) had a positive fungal culture, and 221 (68%) had MIC results available and were included in the analysis. The 35 isolates that were fungal culture positive but missing MIC values had difficult growth during susceptibility testing. Identification of these 35 isolates revealed 13 (37%) unidentified hyaline organisms, 12 (34%) unidentified dematiaceous organisms, 3 (9%) Curvularia species, 2 (6%) Fusarium species, 2 (6%) Aspergillus species, 1 (3%) Alternaria species, 1 (3%) Exserophilum species, and 1 (3%) Lasodiplopia species. Table 1 shows the clinical characteristics of isolates with MIC values compared to those without. No statistically significant differences were seen in the baseline characteristics between the 2 groups. Among isolates with MIC values present, the most common genus was Fusarium (n = 126, 57%), followed by Aspergillus (n = 52, 24%).
| Characteristics | Isolates With MIC Values (N = 221) | Isolates Without MIC Values (N = 102) | P Value a |
|---|---|---|---|
| Treatment arm, n (%) | .50 | ||
| Natamycin | 108 (49) | 54 (53) | |
| Voriconazole | 113 (51) | 48 (47) | |
| At presentation: | |||
| Age (y), median (IQR) | 46 (38 to 55) | 48 (40 to 60) | .21 |
| Sex, n (%) | .06 | ||
| Male | 133 (60) | 50 (49) | |
| Female | 88 (40) | 52 (51) | |
| Duration of symptoms (days), median (IQR) | 5 (3 to 9) | 7 (3 to 10) | .29 |
| Trauma, n (%) | 111 (50) | 50 (50) | .87 |
| Ocular surface disease, n (%) | 3 (1) | 0 (0) | .55 |
| Systemic inflammatory disease, n (%) | 14 (6) | 8 (8) | .64 |
| Fungal culture positive, n (%) | 221 (100) | 35 (34) | ND |
| Visual acuity (logMAR), mean (SD) | 0.71 (0.39) | 0.66 (0.38) | .29 |
| Infiltrate/scar size (mm), mean (SD) | 3.35 (1.15) | 3.26 (1.26) | .56 |
| Clinical outcomes: | |||
| 3-month visual acuity (logMAR), mean (SD) | 0.53 (0.64) | 0.37 (0.52) | .03 |
| 3-month scar size (mm), mean (SD) | 3.71 (1.66) | 3.33 (1.80) | .08 |
| Corneal perforations, n (%) | 41 (19) | 11 (11) | .08 |
| Epithelial defect healed, n (%) b | 136 (62) | 71 (70) | .16 |
| Time to reepithelialization (days), median (IQR) b | 15.5 (7 to 21) | 9.5 (2.5 to 21) | .15 |
a Used Holm method to correct for multiple comparisons. The adjusted significance level threshold started at P ≤ .004.
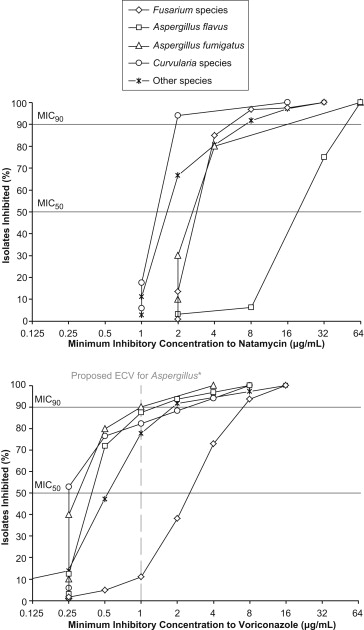
The MIC 50 and MIC 90 for natamycin were equal to or higher than those for voriconazole for all organisms except Curvularia species, which had a higher MIC 90 for voriconazole ( Table 2 ). For Aspergillus isolates, the MICs for natamycin were significantly higher than those for voriconazole ( P < .001). In particular, A flavus isolates had the highest MICs to natamycin relative to other organisms ( Figure , Top panel). Fusarium isolates had the highest MICs to voriconazole compared to other organisms ( Figure , Bottom panel).
| Organism | N | Natamycin (μg/mL) | Voriconazole (μg/mL) | ||||
|---|---|---|---|---|---|---|---|
| MIC 50 (95% CI) b | MIC 90 a (95% CI) b | MIC Range | MIC 50 (95% CI) b | MIC 90 a (95% CI) b | MIC Range | ||
| Identified hyaline | 178 | 4 | 32 | 1 to 64 | 2 | 8 | 0.25 to 16 |
| Fusarium species | 126 | 4 (4 to 4) | 8 (4 to 8) | 2 to 32 | 4 (4 to 4) | 8 (8 to 16) | 0.25 to 16 |
| Aspergillus species | 52 | 32 (16 to 32) | 64 (32 to 64) | 1 to 64 | 0.5 (0.5 to 0.5) | 2 (1 to 4) | 0.25 to 8 |
| A flavus | 32 | 32 (32 to 32) | 64 (32 to 64) | 2 to 64 | 0.5 (0.5 to 0.5) | 2 (1 to 4) | 0.25 to 8 |
| A fumigatus | 10 | 4 (2 to 4) | 64 (4 to 64) | 2 to 64 | 0.5 (0.25 to 0.5) | 1.3 (0.5 to 4) | 0.25 to 4 |
| A niger | 2 | 5 | ND | 2 to 8 | 3 | ND | 2 to 4 |
| A terreus | 3 | 16 | ND | 8 to 16 | 0.5 | ND | 0.5 to 0.5 |
| Other | 5 | 4 | ND | 1 to 32 | 0.5 | ND | 0.5 to 2 |
| Unidentified hyaline | 4 | 4 | ND | 2 to 8 | 0.75 | ND | 0.03 to 8 |
| Identified dematiaceous | 34 | 2 | 2 | 1 to 16 | 0.5 | 2 | 0.25 to 8 |
| Curvularia species | 17 | 2 (2 to 2) | 2 (2 to 16) | 1 to 16 | 0.25 (0.25 to 0.5) | 4 (0.5 to 8) | 0.25 to 8 |
| Exserohilum species | 8 | 2 | ND | 1 to 2 | 1 | ND | 0.5 to 2 |
| Alternaria species | 2 | 2 | ND | 2 to 2 | 1 | ND | 1 to 1 |
| Bipolaris species | 4 | 2 | ND | 2 to 2 | 0.25 | ND | 0.25 to 1 |
| Lasiodiplodia species | 3 | 2 | ND | 2 to 2 | 0.5 | ND | 0.5 to 2 |
| Unidentified dematiaceous | 3 | 4 | ND | 2 to 4 | 1 | ND | 0.25 to 2 |
| Other species | 2 | 2 | ND | 2 to 2 | 8.25 | ND | 0.5 to 16 |
| Total | 221 | 4 | 32 | 1 to 64 | 2 | 8 | 0.03 to 16 |
| P value | <.001 c | <.001 c | |||||
a MIC 90 estimated for genus or species with at least 9 isolates, the smallest number where extrapolation would not be necessary.
b Estimation of 95% CI only performed for genus or species with at least 9 isolates.
c Analysis of variance test (ANOVA) comparing MIC values among genera.
Based on our search criteria, 21 studies were found to have explored in vitro antifungal susceptibility patterns to natamycin, voriconazole, or amphotericin B using ocular Fusarium or Aspergillus isolates ( Table 3 ). These studies used different methods to report MIC (MIC 50 , MIC 90 , and range) and demonstrated variable MICs. The natamycin and voriconazole MIC 50 and MIC 90 found in our study for Fusarium isolates were within the range of published values for F solani and for all Fusarium species. Among Aspergillus species, our natamycin MIC values for A flavus were consistent with previous study results, but the MIC 90 for A fumigatus was 4-fold higher than previous reports. Our voriconazole MIC 90 against A spergillus species exceeded values reported in the ophthalmic literature by 2-fold.
| Study a | Species (Number of Isolates) | Natamycin (μg/mL) | Voriconazole (μg/mL) | Amphotericin B (μg/mL) | ||||||
|---|---|---|---|---|---|---|---|---|---|---|
| MIC 50 | MIC 90 | MIC Range | MIC 50 | MIC 90 | MIC Range | MIC 50 | MIC 90 | MIC Range | ||
| Debourgogne et al, 2012 | F solani (48) | – | – | – | – | 8 | 1 to 16 | – | 2 | 0.13 to 2 |
| Edelstein et al, 2012 | F solani (1) | – | – | 16 | – | – | 8 | – | – | 4 |
| Giaconi et al, 2006 | Fusarium spp (1) | – | – | – | – | – | 8 | – | – | – |
| Homa et al, 2013 | Fusarium spp (60) | 8 c | >64 c | 2 to >64 | 64 c | >64 c | 0.13 to >64 | 16 c | >64 c | 0.13 to >64 |
| F solani (43) | 8 c | >64 c | 2 to >64 | 64 c | >64 c | 0.13 to >64 | 8 c | 64 c | 0.13 to >64 | |
| F non- solani (17) | 8 c | >64 c | 2 to >64 | 64 c | >64 c | 16 to >64 | 16 c | >64 c | 4 to >64 | |
| Iqbal et al, 2008 | Fusarium spp (92) | – | – | 4 to 16 | – | – | 0.5 to >8 | – | – | 0.5 to >8 |
| F solani (57) | 8 | – | 4 to 16 | >8 | – | 8 to >8 | 2 | – | 0.5 to >8 | |
| F non- solani (35) | – | – | 4 to 8 | – | – | 0.5 to >8 | – | – | 1 to 4 | |
| Kondori et al, 2011 | Fusarium spp (5) | – | – | – | – | – | 0.25 to >8 | – | – | – |
| F solani (1) | – | – | – | – | – | >8 | – | – | – | |
| F non- solani (4) | – | – | – | – | – | 0.25 to 1 | – | – | – | |
| Lalitha et al, 2007 | Fusarium spp (38) | 8 | 16 | – | 2 | 4 | – | 4 | 4 | – |
| Lalitha et al, 2008 | Fusarium spp (41) | 4 | 4 | 2 to 8 | – | – | – | – | – | – |
| Lalitha et al, 2012 | Fusarium spp (44) | 4 | 8 | 2 to 16 | 4 | 16 | 2 to 16 | – | – | – |
| Li et al, 2008 | Fusarium spp (38) | 4 | 16 | 2 to 16 | – | – | – | 4 | 4 | 2 to 16 |
| Oechsler et al, 2013 | F solani (NAT 44, VRC 15, AMB 43) | 4.8 | 4.8 | 2.4 to 9.6 | 16 | 16 | 4 to ≥16 | 2 | 2 | 1 to ≥16 |
| F non- solani (NAT 14, VRC 12, AMB 14) | 2.4 | 4.8 | 2.4 to 4.8 | 4 | 4 | 2 to ≥16 | 2 | 2 | 1 to 2 | |
| Ozdemir et al, 2012 | Fusarium spp (9) | – | – | – | 4 c | 8 c | 1 to 8 | 1 c | 2 c | 0.5 to 2 |
| F solani (2) | – | – | – | 4 c | – | 4 to 8 | 1 c | – | 1 to 2 | |
| F non- solani (7) | – | – | – | 4 c | – | 1 to 4 | 0.5 c | – | 0.5 to 2 | |
| Pradhan et al, 2011 , d | Fusarium spp (15) | – | – | 4 to 8 | – | – | – | – | – | – |
| Shapiro et al, 2010 | Fusarium spp (23) | 8 | 16 | 4 to 16 | – | – | – | – | – | – |
| Sponsel et al, 2002 2 , b | F solani (1) | – | – | 32 | – | – | – | – | – | 2 |
| Taylan et al, 2012 | F solani (1) | – | – | – | – | – | 8 | – | – | 0.5 |
| Tu et al, 2007 | F solani (1) | – | – | – | – | – | 8 | – | – | 4 |
| Wang et al, 2009 | Fusarium spp (71) | – | – | – | – | – | – | 0.5 | 1 | 0.06 to 1 |
| Xie et al, 2008 | F solani (34) | – | – | – | – | – | – | 1 | 2 | – |
| Total range | Fusarium spp | 4 to 8 | 4 to >64 | 2 to >64 | 2-64 | 4 to >64 | 0.13 to >64 | 0.5 to 16 | 1 to >64 | 0.06 to >64 |
| F solani | 4.8 to 8 | 4.8 to >64 | 2 to >64 | 4-64 | 8 to >64 | 0.13 to >64 | 1 to 8 | 2 to 64 | 0.13 to >64 | |
| F non- solani | 2.4 to 8 | 4.8 to >64 | 2 to >64 | 4-64 | 4 to >64 | 0.25 to >64 | 0.5 to 16 | 2 to >64 | 0.5 to >64 | |
| Kondori et al, 2011 | Aspergillus spp (29) | – | – | – | – | – | 0.13 to 8 | – | – | – |
| A fumigatus (23) | – | – | – | – | – | 0.13 to 8 | – | – | – | |
| Lalitha et al, 2007 | Aspergillus spp (41) | 32 | >32 | – | 0.25 | 0.5 | – | 2 | 4 | – |
| Lalitha et al, 2008 | Aspergillus spp (59) | – | – | 1 to 64 | – | – | – | – | – | – |
| A flavus (32) | 32 | 64 | 8 to 64 | – | – | – | – | – | – | |
| A fumigatus (18) | 4 | 4 | 1 to 4 | – | – | – | – | – | – | |
| Lalitha et al, 2012 | Aspergillus spp (17) | 32 | 32 | 2 to 32 | 1 | 1 | 0.13 to 2 | – | – | – |
| A flavus (11) | 32 | 32 | – | 1 | 1 | – | – | – | – | |
| A fumigatus (5) | 4 | 8 | – | 0.5 | 0.5 | – | – | – | – | |
| Manikandan et al, 2013 | A flavus (74) | 128 | 128 | 4 to 128 | 0.5 | 1 | 0.25 to 1 | 2 | 8 | 0.5 to 16 |
| A fumigatus (14) | 4 | 16 | 4 to 64 | 0.5 | 0.5 | 0.1 to 1 | 0.5 | 1 | 0.25 to 1 | |
| Nayak et al, 2011 | A flavus (64) | – | – | – | – | – | – | 3.12 | 12.5 | 0.03 to 25 |
| A fumigatus (43) | – | – | – | – | – | – | 3.12 | 3.12 | 0.03 to 12.5 | |
| Pradhan et al, 2011 , d | Aspergillus spp (24) | – | – | 2 to 32 | – | – | – | – | – | – |
| A flavus (13) | – | – | 8 to 32 | – | – | – | – | – | – | |
| A fumigatus (9) | – | – | 2 to 8 | – | – | – | – | – | – | |
| Shapiro et al, 2010 | Aspergillus spp (24) | 32 | 64 | 8 to 64 | – | – | – | – | – | – |
| A flavus (18) | 32 | 64 | 16 to 64 | – | – | – | – | – | – | |
| A fumigatus (1) | – | – | 8 | – | – | – | – | – | – | |
| Wang et al, 2009 | Aspergillus spp (15) | – | – | – | – | – | – | 1 | 1 | 0.25 to 1 |
| Xie et al, 2008 | A flavus (9) | – | – | – | – | – | – | 2 | 4 | – |
| A fumigatus (9) | – | – | – | – | – | – | 1 | 2 | – | |
| Total range | Aspergillus spp | 32 | 32 to 64 | 1 to 64 | 0.25 to 1 | 0.5 to 1 | 0.13 to 8 | 1 to 2 | 1 to 4 | 0.25 to 1 |
| A flavus | 32 to 128 | 32 to 128 | 4 to 128 | 0.5 to 1 | 1 | 0.25 to 1 | 2 to 3.12 | 4 to 12.5 | 0.03 to 25 | |
| A fumigatus | 4 | 4 to 16 | 1 to 64 | 0.5 | 0.5 | 0.1 to 8 | 0.5 to 3.12 | 1 to 3.12 | 0.03 to 12.5 | |
Stay updated, free articles. Join our Telegram channel

Full access? Get Clinical Tree


