Purpose
To employ magnetic resonance imaging (MRI) to seek evidence of compartmental lateral rectus atrophy consistent with a lesion involving selective denervation of only 1 of the 2 neuromuscular compartments of the lateral rectus.
Design
Prospective observational case-control series.
Methods
At a single institution, surface coil coronal MRI was obtained at 312 μm resolution in quasi-coronal planes 2 mm thick throughout the orbit in 20 normal volunteers and 18 patients with unilateral lateral rectus palsy fixated monocularly on a target placed in central gaze. Maximum cross sections and posterior volumes of the superior and inferior lateral rectus compartments were computed and correlated with clinical findings.
Results
Twelve patients with lateral rectus palsy demonstrated symmetric, highly significant 40% reductions in maximum cross sections and 50% reductions in posterior volumes from normal for both compartments ( P < 10 −6 for all comparisons). Six patients with lateral rectus palsy had similar significant but asymmetric reductions in those measures only for the superior compartment of the affected lateral rectus ( P < 10 −4 for all comparisons), with insignificant 20%-30% reductions for the inferior compartment ( P > 0.2 for all comparisons).
Conclusions
A subset of patients with clinical lateral rectus palsy may have palsy limited to the superior compartment. Paralytic esotropia may be caused by lateral rectus superior compartment palsy despite an intact lateral rectus inferior compartment. This finding is consistent with evidence supporting independent innervation of the 2 lateral rectus neuromuscular compartments.
Histologic reconstruction demonstrates compartmental segregation of intramuscular motor innervation of mammalian horizontal rectus extraocular muscles, including those of humans. Prior to entering their target muscles, both the abducens nerve and oculomotor nerve divide into superior and inferior branches that innervate minimally overlapping neuromuscular compartments that remain vertically segregated over the entire anteroposterior length of each muscle. Differential innervation of the horizontal rectus muscle compartments appears to contribute to ocular counter-rolling. Since there is substantial mechanical independence of the parallel muscle and tendon fibers, the broad insertions allow the superior and inferior compartments to exert forces displaced sufficiently from the horizontal globe meridian to generate substantial torsional and vertical torques, in much the same manner as surgical transposition of the tendon insertion perpendicular to its path imparts cyclovertical action to the transposed extraocular muscle.
Segregated innervation of horizontal rectus muscles suggests the potential existence of a differential response to pathologic injury of nerve branches innervating the 2 functional compartments. Despite proximity of vertical neuromuscular compartments, a compressive lesion, demyelinating disease, microvascular insult, trauma, or other pathology of the abducens or oculomotor nerve might selectively or differentially denervate only 1 compartment, sparing the other. For the lateral rectus muscle in particular, historically considered to mediate only abduction, selective compartmental palsy might introduce vertical and/or torsional deficits in addition to the classic paralytic esotropia, findings that could confuse the clinical presentation and invite the erroneous diagnosis of a concurrent cyclovertical muscle palsy or skew deviation. Indeed, cyclovertical deviations have been reported frequently to distort the Listing’s law relationship to ocular torsion in “central” forms of lateral rectus palsy. This interpretation, however, and the belief that loss of fusion could create vertical and excyclotorsional misalignments in isolated lateral rectus palsy, preceded recognition of compartmental innervation of extraocular muscles.
High-resolution magnetic resonance imaging (MRI) has been used in prior studies of extraocular muscle contractility, both in normal subjects and in subjects with cranial nerve palsies. These studies consistently demonstrate an increase in maximum cross-sectional area, a shift of the image plane of maximum cross section posteriorly, and an increase in posterior extraocular muscle volume during contraction, changes in functional anatomy diminished or ablated by palsy of the innervating cranial nerve. Using careful technique, MRI resolution is sufficient to detect compartmental changes in extraocular muscle morphology corresponding to contractile state, and thus has the potential to detect partial paresis of the extraocular muscle belly differentially affecting distinct neuromuscular compartments. This study used MRI to seek evidence of asymmetric compartmental atrophy in patients with clinical lateral rectus palsy.
Methods
This study was conducted at a single institution as a prospective observational case-control series. Participants gave written informed consent to a protocol conforming to the Declaration of Helsinki and approved by the Institutional Review Board at the University of California, Los Angeles. All data collection was Health Insurance Portability and Accountability Act compliant. Twenty normal, orthotropic paid volunteer adults were recruited by advertisement. Each control underwent comprehensive eye examination to verify normal acuity, ocular motility, stereoacuity, and ocular anatomy. From 1996 to 2012, 18 patients with unilateral chronic lateral rectus palsy were recruited prospectively through an ongoing study. Each patient with strabismus underwent a similar examination. Ductions were scaled from 0 (normal) to −4 (just able to reach central gaze from adduction). Fundus torsion was determined either using the double Maddox rod or by objectively determining the angle between the fovea and the center of the optic disc, as measured with a +90 refractive diopter condensing lens at the slit lamp as the patient foveated a rotating slit beam whose angle was adjusted until the beam intercepted both the fovea and the center of the optic disc.
High-resolution T1- or T2-weighted fast spin echo MRI was performed on each participant with a 1.5-T General Electric Signa (Milwaukee, Wisconsin, USA) scanner using techniques detailed elsewhere, including use of a dual-phased surface coil array (Medical Advances, Milwaukee, Wisconsin, USA) to improve signal-to-noise ratio and a fixation target to avoid motion artifacts. Magnetic resonance imaging surface coils used in this project were not approved by the US Food and Drug Administration for this purpose. Participants were scanned supine with the head stabilized. During imaging, subjects fixated a fine optical fiber 2 cm distant and illuminated from its distal end by a red light–emitting diode. The fiber was positioned to keep the scanned eye as close to central gaze as possible.
Initially, low-resolution craniotopic images of both orbits were obtained simultaneously at 3 mm thickness with 780 μm in-plane resolution. Low-resolution images were used to place sets of 18-20 contiguous, 2-mm-thick quasi-coronal images in a plane perpendicular to the long axis of each orbit using a 256 × 256 matrix over an 8-cm field of view, yielding 312 μm in-plane resolution.
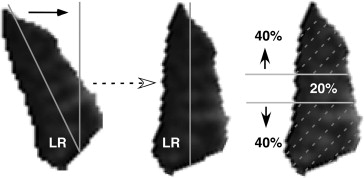
Digital MRI images were quantified using both the program ImageJ64 (W. Rasband, National Institutes of Health, Bethesda, Maryland, USA; http://rsb.info.nih.gov/ij/ , 1997-2009) and custom image analysis programs developed using the MatLab platform (MathWorks, Boston, Massachusetts, USA; 2011) employing techniques described in detail elsewhere. In summary, beginning as far posteriorly in each orbit as the lateral rectus belly could be distinguished, each lateral rectus was manually outlined and saved as a file that included only the lateral rectus belly. The lateral rectus image was then processed in MatLab by first rotating the entire image to align the vertical axis of the muscle with scanner vertical ( Figure 1 , Left), and then calculating the areas of the superior and inferior lateral rectus compartments by separately counting the pixels in the superior 40% and inferior 40% of the vertical extent of the muscle ( Figure 1 , Right), neglecting the middle 20% of the muscle with potential intermingled innervation.
Cross-sectional areas were measured for the superior and inferior compartments in all image planes. Then, the compartmental areas of the 4 contiguous image planes from 8-14 mm posterior to the globe–optic nerve junction, the most posterior image planes that were available in every subject, were multiplied by the 2-mm slice thickness and summed to compute the posterior partial volume for each lateral rectus compartment. Two morphometric measures were analyzed: the single-plane maximum cross-sectional area for the mid-orbital region (6-12 mm posterior to the globe) and the posterior partial volume. The superior and inferior compartmental areas and posterior partial volumes were then scaled as fractions of those measures for each entire muscle. For each measure, the relative proportion of the superior compartment was plotted against the relative proportion in the inferior compartment to assess possible clustering that would indicate asymmetric compartmental lateral rectus atrophy.
Results
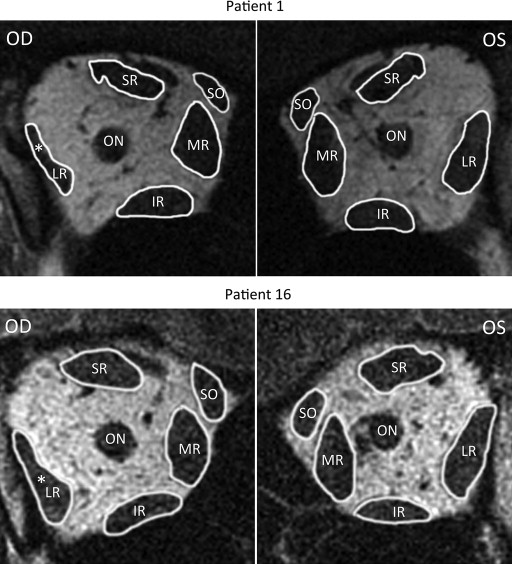
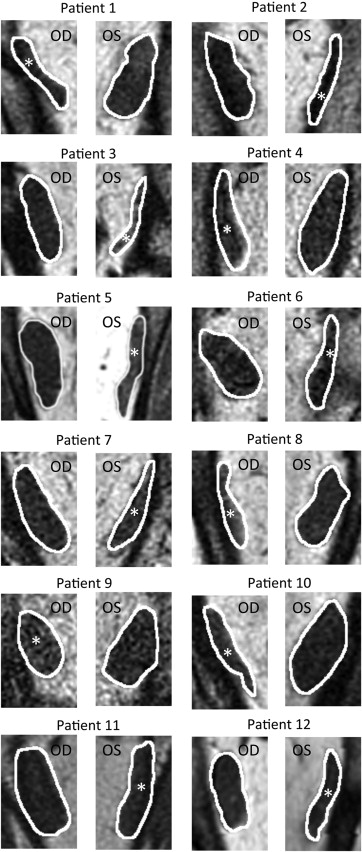
Quasi-coronal MRI provided detailed lateral rectus cross sections throughout the orbit and, as expected, confirmed reduced size of the lateral rectus belly in all 18 patients with lateral rectus palsy. The patients clearly segregated into 2 groups based exclusively on the differences in the 2 morphometric measures. Figure 2 illustrates MRI of the entire orbit contrasting palsied and unaffected lateral rectus muscles of 2 representative patients. In 12 cases, the entire lateral rectus cross section was uniformly atrophic, as illustrated for the right orbit image in Figure 2 for Patient 1, and for cropped lateral rectus images in all 12 cases in Figure 3 . These 12 patients were considered to have complete lateral rectus palsies. As shown in Table 1 , the superior and inferior compartments of the paretic lateral rectus exhibited an average decrease in size nearly identical for both maximum cross-sectional area (42.1% vs 42.9%) and posterior partial volume (49.3% vs 46.9%).
| Patient | Maximum Cross Section (mm 2 ) | Posterior Volume (mm 3 ) | ||
|---|---|---|---|---|
| Sup Compartment | Inf Compartment | Sup Compartment | Inf Compartment | |
| 1 | 54.7% | 45.5% | 58.1% | 45.8% |
| 2 | 38.2% | 33.8% | 60.0% | 60.0% |
| 3 | 61.9% | 67.8% | 60.8% | 73.1% |
| 4 | 42.7% | 39.0% | 50.1% | 37.0% |
| 5 | 45.1% | 33.6% | 48.8% | 32.2% |
| 6 | 55.2% | 56.7% | 65.9% | 68.7% |
| 7 | 16.2% | 21.8% | 31.6% | 24.2% |
| 8 | 39.5% | 59.2% | 58.1% | 60.4% |
| 9 | 21.9% | 20.3% | 30.2% | 29.7% |
| 10 | 55.9% | 63.5% | 52.5% | 59.1% |
| 11 | 21.9% | 34.5% | 35.3% | 33.5% |
| 12 | 51.8% | 38.6% | 40.9% | 39.4% |
| Average | 42.1% | 42.9% | 49.3% | 46.9% |
| t test | 0.00000004 | 0.0000002 | 0.000000006 | 0.0000002 |
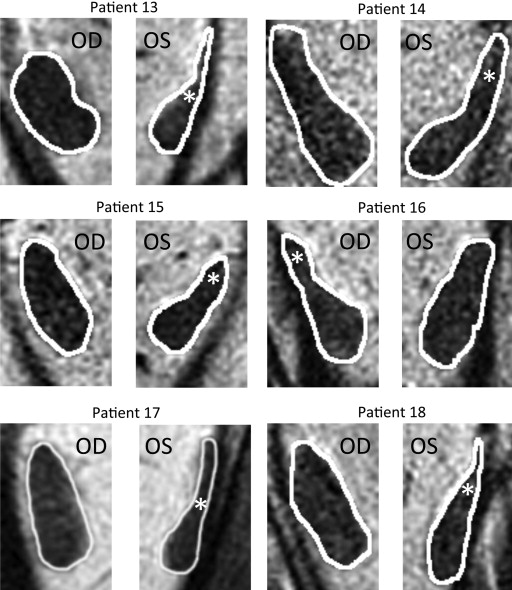
The other 6 patients with lateral rectus palsy exhibited asymmetric atrophy mainly affecting the superior compartment, but sparing the inferior compartment, of the palsied lateral rectus. This asymmetric atrophy is illustrated in the right orbit image in Figure 2 for Patient 16 and for cropped lateral rectus images in all 6 cases in Figure 4 . In each case, obvious relative preservation of the inferior portion of the palsied lateral rectus is interpreted as evidence of selective superior compartment atrophy. Despite individual variations in morphology and size for both normal and involved lateral rectus, in each case, the asymmetric atrophy of the superior lateral rectus belly is apparent, as is relative inferior compartment sparing. As shown in Table 2 , the superior compartment had twice the loss of maximum cross-sectional area (46.5%) as the inferior compartment (23.4%), with nearly twice the difference in posterior volume (53.8% vs 31.6%).
| Asymmetric Lateral Rectus Palsy Percent Atrophy (Compared With Uninvolved) | ||||
|---|---|---|---|---|
| Patient | Maximum Cross Section (mm 2 ) | Posterior Volume (mm 3 ) | ||
| Sup Compartment | Inf Compartment | Sup Compartment | Inf Compartment | |
| 13 | 73.4% | 37.6% | 77.4% | 52.4% |
| 14 | 26.3% | 18.3% | 45.1% | 16.2% |
| 15 | 43.0% | 17.9% | 47.3% | 25.2% |
| 16 | 24.2% | −4.5% | 32.8% | 4.2% |
| 17 | 70.0% | 50.0% | 68.7% | 63.6% |
| 18 | 42.1% | 20.9% | 51.2% | 27.8% |
| Average | 46.5% | 23.4% | 53.8% | 31.6% |
| t test | 0.000006 | 0.34 | 0.000008 | 0.22 |
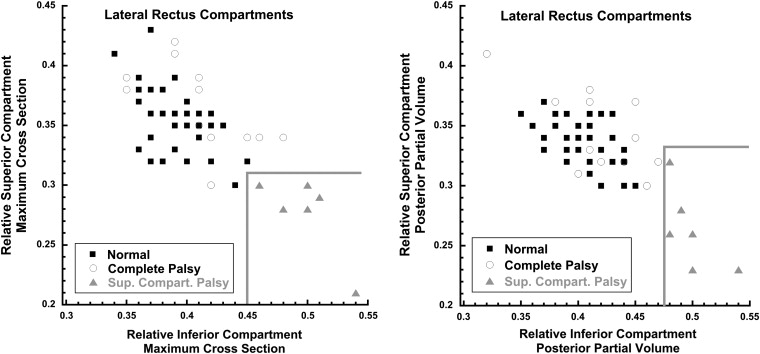
Two-dimensional graphical analysis demonstrated that all 6 lateral rectus muscles with superior compartment palsy differed morphometrically from both normal and completely palsied lateral rectus muscles. This analysis involved plotting separately for maximum cross-sectional area ( Figure 5 , Left) and posterior partial volume ( Figure 5 , Right) on the abscissa the proportion (relative to the total for the muscle) in the inferior lateral rectus compartment and on the ordinate the proportion in the superior compartment. For each of these 2 measures of size, both control and completely palsied lateral rectus muscles exhibited similar proportions in the inferior and superior lateral rectus compartments, so that data points for each muscle clustered in the upper left of each plot ( Figure 5 ). For lateral rectus muscles affected asymmetrically, however, the muscle proportion in the inferior compartment was relatively large and the proportion in the superior compartment was relatively small, so the data points clustered in the lower right portion of each graph in the region demarcated by the gray borders. Clustering of cross-sectional area ( Figure 5 , Left) and posterior partial volume ( Figure 5 , Right) data is similar, supporting the validity of this approach. This unique morphologic clustering of lateral rectus muscles with superior compartment atrophy is interpreted as distinguishing this pathology from complete lateral rectus palsy. The clustering also defines natural break points in the data for classifying patients as having complete vs compartmental lateral rectus palsies.
The paretic lateral rectus superior compartments of patients with both superior compartment and complete lateral rectus palsy had highly statistically significantly smaller maximum cross-sectional areas and posterior volumes than controls ( P < 10 −4 for all comparisons). For complete lateral rectus palsy, the inferior lateral rectus compartment was also highly significantly subnormal ( P < 10 −6 for both maximum cross section and posterior partial volume). However, the 6 patients with superior compartment palsies had inferior compartment maximum cross sections and posterior partial volumes indistinguishable from normal ( P > .2 for both measures).
Clinical characteristics and motility features of patients with lateral rectus palsies are compared in Table 3 . A neurologic etiology was identified for the palsy in all but Patients 7 and 15. Patients 3, 5, 6, 10, 11, and 13 had concurrent vertical muscle palsies. Prior to MRI, Patient 4 underwent strabismus surgery consisting of right medial rectus recession with half tendon width inferior transposition, right lateral rectus resection with half tendon superior transposition, and anterior transposition of the anterior half of the right superior oblique tendon. Patient 8 had Duane retraction syndrome type 1 prior to developing ipsilateral lateral rectus paralysis owing to meningioma. Patient 13 underwent 4 strabismus surgeries prior to MRI: (1) right inferior rectus recession; (2) right inferior rectus advancement; (3) right medial rectus recession/right lateral rectus resection; and (4) bilateral medial rectus and left inferior rectus recession. None of the surgeries involved the paretic left lateral rectus. Patient 16 underwent 2 strabismus surgeries prior to MRI: (1) right medial rectus recession/right lateral rectus resection; and (2) left medial rectus recession/right lateral rectus plication.
Stay updated, free articles. Join our Telegram channel

Full access? Get Clinical Tree


