Purpose
To image the retinal pigment epithelium (RPE) after macular laser and to monitor healing responses over time in vivo in patients with diabetic maculopathy using polarization-sensitive optical coherence tomography (OCT).
Design
Prospective, nonrandomized clinical trial.
Methods
In this single-center trial (Department of Ophthalmology and Optometry, Medical University of Vienna, Vienna, Austria), 13 patients (13 eyes) underwent grid photocoagulation for diabetic maculopathy. Retinal healing processes were continuously followed over the course of 3 months. A polarization-sensitive OCT prototype was used, allowing detection and measurement of the RPE changes based on their specific polarization-scrambling qualities.
Results
After 1 day, the intraretinal photocoagulation lesions were sharply demarcated, whereas RPE changes were rather subtle. At 1 week, all lesions exhibited traction of the inner retinal layers toward the RPE and loss of photoreceptor cells. In tissue-sensitive polarization-sensitive OCT imaging, polarization-scrambling columns were found at the level of the RPE. During follow-up, different healing responses were seen in the polarization-scrambling RPE layer, ranging from hyperproliferation to focal atrophy.
Conclusion
Because of the properties of the polarization state of backscattered light, polarization-sensitive OCT revealed specific morphologic changes in the RPE and outer retinal layers secondary to retinal laser treatment undetectable with intensity-based spectral-domain OCT. The increase in polarization-scrambling tissue over the course of 3 months indicates a more intense healing reaction and proliferation of RPE cells than previously characterized in rodent studies.
Diabetic macular edema (DME), a common complication of diabetes mellitus, is a leading cause of visual impairment in the western world. The Wisconsin Epidemiologic Study of Diabetic Retinopathy/Epidemiology of Diabetes Interventions and Complications trial reported a cumulative 25-year incidence of between 13% and 25% with a treatment-dependent long-term prognosis. Randomized controlled clinical trials with type I and type II diabetic patients have shown that intensive glycemic control, intensive treatment of elevated blood pressure, and intensive combination treatment of dyslipidemia reduce the rate of progression of diabetic retinopathy, and retinal photocoagulation significantly decreases the risk of visual loss as demonstrated by the Early Treatment Diabetic Retinopathy Study (ETDRS).
During the last decade a number of additional pharmacologic treatments for DME have been proposed, such as intravitreal injections of anti–vascular endothelial growth factor agents and cortisol. Recent studies show a paradigm shift from the former gold standard of exclusive photocoagulation to monotherapy or combination therapy with such agents. Despite many years in clinical use, the specific mechanisms by which focal photocoagulation reduces DME remain ill defined. It is not clear whether the therapeutic effect, measured as reduced retinal blood flow, is caused by therapeutically induced improvements in retinal tissue oxygenation, overall reduced retinal tissue, or biochemical changes at the level of the retinal pigment epithelium (RPE).
Spectral-domain optical coherence tomography (SD-OCT) has become an important tool over the last few years in the diagnosis of DME because of its high-resolution imaging, comparable to histology. Current SD-OCT technology, however, has distinct limitations, especially in displaying the integrity and status of the RPE. The main reason for this is an insufficient automated segmentation of this pigmented retinal layer because of similar reflectivity of adjacent layers and structures. Because the retinal pigment epithelium is the target tissue in retinal photocoagulation in DME, a more detailed understanding of the morphologic changes following treatment is of great value.
Polarization-sensitive OCT is a novel technology that is capable of detecting the retinal pigment epithelium by its tissue-specific depolarizing properties, in addition to the information obtained by conventional SD-OCT scans. In polarization-sensitive OCT, information is gathered simultaneously during the same raster scan. Recently, new algorithms, capable of segmenting the retinal pigment epithelium based on its depolarizing properties, were developed. This procedure allows for true tissue differentiation between the retinal pigment epithelium and other hyperreflective structures on the basis of different intrinsic physical properties.
In this study we systematically investigated the dynamics of the healing process of RPE lesions of the human retina following photocoagulation by tissue-selective high-resolution in vivo imaging. The purpose of the study was to introduce and evaluate a novel imaging technology, polarization-sensitive OCT, and to provide further insight into the morphologic effects of retinal laser treatment.
Methods
Patients and Inclusion
In this prospective, interventional study, 13 consecutive patients (9 men, 4 women; 58 ± 10 years [mean ± standard deviation]) with clinically significant diabetic macular edema were enrolled at the Department of Ophthalmology, Medical University of Vienna, Vienna, Austria. The study was prospectively approved by the university’s ethics committee (Institutional Review Board), was registered on www.clinicaltrials.gov ( NCT00682240 ), and conformed to the Declaration of Helsinki for research in human subjects. Patients gave written informed consent to participate in this research study after a detailed explanation of the study design and purpose.
Inclusion criteria for the study were diabetic retinopathy attributable to type 2 diabetes mellitus, the presence of clinically significant macular edema (as defined by the ETDRS ) with involvement of the center of the macula, no prior laser photocoagulation, no pharmacologic intervention within 3 months before inclusion, and clear optical media. Patients with media opacities (cornea, lens, vitreous) or macular alterations attributable to other diseases were excluded from the study.
Treatment and Follow-up
Retinal photocoagulation was performed following the modified laser protocol introduced by the ETDRS. To achieve the most homogeneous laser treatment, all procedures were performed using the PASCAL Pattern Scan Laser System (OptiMedica Corporation, Santa Clara, California, USA). Patients received a predetermined grid pattern laser treatment of the edematous perifoveolar region of up to 56 spots. Also, by using the PASCAL system, applied laser energy is more homogeneous, which results in more localized laser lesions than using conventional laser systems. A safety distance of 500 μm from the foveal center was maintained. In cases of microaneurysm leakage on fluorescein angiography (FA), additional focal laser therapy was used to coagulate the culprit lesions. A 10-ms burn duration and a 100-μm-diameter laser spot size were chosen as standard laser settings, and the treatment was performed using an Area Centralis Laser Lens (Volk, Mentor, Ohio, USA). In all patients, the laser power was determined on the basis of ophthalmoscopic visibility of the treatment spot and adjusted to a spot of light-grayish color observed clinically. All procedures were performed by the same experienced clinician (M.B.).
Follow-up visits were performed at day 1 and week 1 after laser treatment and at monthly intervals thereafter until month 3.
Functional and Morphologic Examinations
Standardized examination procedures were repeated according to protocol at each follow-up visit. At each visit, patients underwent a complete evaluation, including standardized best-corrected ETDRS visual acuity testing, slit-lamp examination, fundoscopy, color fundus photography, and SD-OCT (Spectralis HRA+OCT; Heidelberg Engineering Inc, Bonn, Germany) and polarization-sensitive OCT imaging (a prototype developed at the Center for Medical Physics and Biomedical Engineering, Medical University Vienna, Austria). Fluorescein angiography was performed at baseline and at month 3.
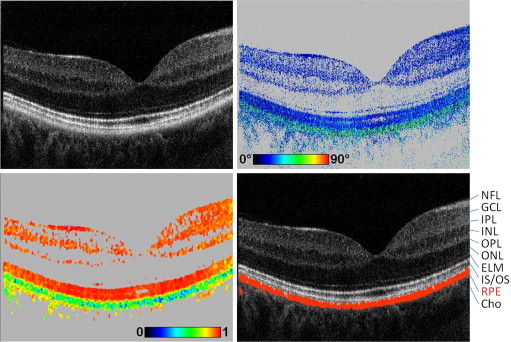
The principles of the polarization-sensitive OCT technology used in this study have been reported in detail elsewhere. The measurements reported in this paper were performed with an improved system that incorporates an additional scanning laser ophthalmoscope (SLO) channel for improved patient alignment. In brief, the system can obtain several parameters simultaneously: intensity (as in standard OCT imaging), retardation (phase shift introduced by birefringence between 2 orthogonal linear polarization states), and fast axis orientation (birefringent axis orientation of the sample relative to the orientation of the instrument). In addition, the spatial distribution of Stokes vectors can be measured, from which the degree of polarization uniformity (DOPU) can be derived and imaged. (DOPU is related to the degree of polarization known from classical optics, which can, however, not be directly measured by a coherent imaging technique such as OCT.) The instrument is operated at an A-scan rate of 20 000 A-scans per second for each polarization channel, allowing the recording of 3-dimensional data sets covering a scan field of ∼18 degrees (x) × 19 degrees (y) × 3.3 mm (z, optical distance) in 3.3 seconds. Variable raster scan patterns of 1024 × 64, 512 × 128, and 256 × 256 pixels (horizontal × vertical) can be selected. The theoretical depth resolution is ∼4 μm in tissue.
The details of the segmentation algorithm used to identify the RPE were published previously. The algorithm is based on the intrinsic tissue properties of the RPE to scramble the polarization state of the backscattered light. This polarization scrambling causes a random variation of Stokes vectors from speckle to speckle. To quantify the effect of polarization scrambling (equivalent to depolarization), we measure the Stokes vector in each image pixel and average them by calculating the mean value of each Stokes vector element within a rectangular evaluation window (for the 512 × 128-pixel raster scan pattern employed in this study, we used a floating window of size 8 [x] × 6 [z] pixels, or ∼100 [x] × 16 [z] μm²). From the averaged Stokes vectors, we calculate DOPU in analogy to the classical degree of polarization.
DOPU values range from 0 to 1. DOPU values close to 1 represent uniform polarization state within the respective evaluation window, whereas lower DOPU values reveal polarization scrambling. Hence, depolarizing structures such as the polarization-scrambling RPE can be segmented as pixels exhibiting DOPU values below a user-defined threshold (typically 0.7-0.8). By assigning a specific color (eg, red) to these pixels, an overlay image can be generated showing the segmented RPE overlaid on a grayscale intensity image. It has to be noted that the spatial resolution of DOPU images and RPE segmentation is always limited by the size of the sliding evaluation window used for averaging the Stokes vector elements ( Figure 1 ).
Analysis of Laser Lesions
Morphologic analysis and classification of the applied laser lesions were performed based on the SD-OCT and polarization-sensitive OCT scans and SLO images. Laser scars were included in the analysis only if they were found in all scans from day 1 through month 3. Laser lesions that could not be followed and were missing at 1 or more points in time (for instance, because of image quality, motion artifacts, unreliable eye tracker) were excluded. Assessment was performed by an expert grader (J.L.).
Results
All 13 patients had generalized clinically significant macular edema secondary to type 2 diabetes mellitus.
Biometric and Functional Retinal Changes
At baseline, mean ± standard deviation (SD) central millimeter thickness (CMT) was 438 ± 123 μm. There was a continuous decrease in mean CMT to 409 ± 110 μm ( P = .082) at month 1, to 396 ± 105 μm ( P = .026) at month 2, and to 386 ± 112 μm ( P = .003) at month 3 ( P values compared to baseline, respectively).
The mean ± SD baseline visual acuity ETDRS score was 74 ± 8 and did not change significantly, at 77 ± 8 ( P = .209), 3 months after treatment. At months 1 and 2, visual acuities were 76 ± 9 and 74 ± 13, respectively.
Morphologic Changes
The characteristic changes typically seen in DME, such as cyst formation and diffuse swelling in the inner and outer nuclear layers, were observed in all patients. Subfoveolar fluid was also observed in 4 patients.
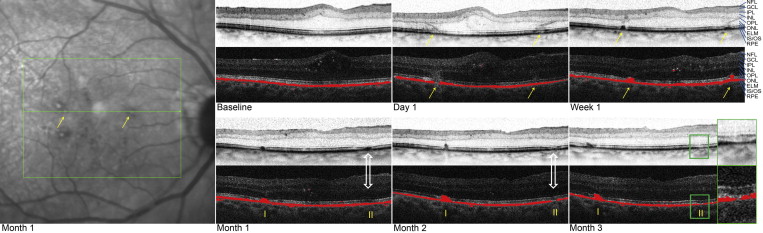
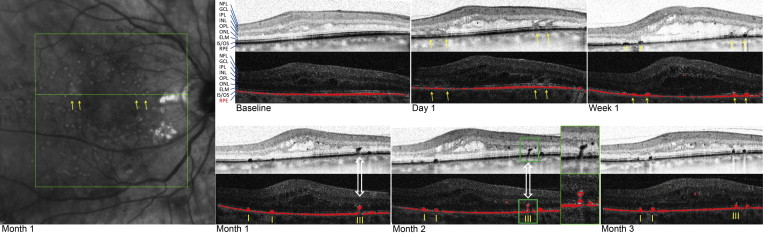
Characteristic morphologic changes secondary to retinal grid photocoagulation, as seen on SD-OCT, were observed at day 1, as previously described by Bolz and associates. Each laser lesion was visible as a clear change with distinct borders at the level of the RPE, the photoreceptor layer, and, to a lesser extent, the outer nuclear layer (ONL). In the layer of the photoreceptors (inner and outer segments; inner segment/outer segment [IS/OS] line) the lesions had a sagittal orientation, but at the level of the external limiting membrane (ELM) the orientation changed and continued through the ONL obliquely, because of the incipient damage of the photoreceptor complex (cell body and axon) and its anatomic orientation in the macula. No specific changes of the inner retinal layers were observed. This very characteristic oblique and concentric laser lesion pattern was observed in all patients at day 1 and was representative of alterations of the Henle fiber layer. At week 1, the changes at the level of the RPE and the photoreceptor layer remained clearly demarcated; however, the borders of the pathway through the ONL became blurred. At 3 months, therapeutically induced changes were detected only at the level of the RPE and the photoreceptor layer, and changes in the ONL were no longer detectable.
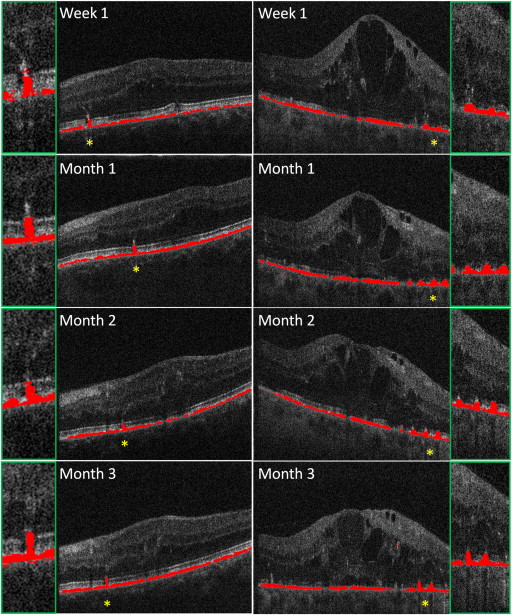
In a more detailed analysis of the morphologic changes in the RPE, the images showing RPE segmentation (based on DOPU) generated by the polarization-sensitive OCT and images produced by the Spectralis HRA+OCT were used for further evaluation. In total, 379 laser lesions were evaluated over the course of the study. The RPE, segmented by its polarization-scrambling effect, is shown as a continuous red layer at baseline ( Figures 1 through 7 ). One day after photocoagulation a reduction of the polarization-scrambling layer, ranging from focal thinning to the presence of a gap, could be seen, depending on the individually applied laser energy fluence. Also, the light transmission of the SD-OCT signal into the choroid below the laser lesion indicated a local loss of RPE cells and/or of their pigmentation. At week 1 after laser treatment, the lesions showed a column-like growth of polarization-scrambling tissue reaching the ELM.