Purpose
To determine whether the degree of tumor anaplasia has prognostic value by evaluating its correlation with high-risk histopathologic features and clinical outcomes in a series of retinoblastoma patients.
Design
Retrospective clinicopathologic study.
Methods
The clinical and pathologic findings in 266 patients who underwent primary enucleation for retinoblastoma were reviewed. The histologic degree of anaplasia was graded as retinocytoma, mild, moderate, or severe as defined by increasing cellular pleomorphism, number of mitoses, nuclear size, and nuclear hyperchromatism. Nuclear morphometric characteristics were measured. The clinical and pathologic data of 125 patients were compared using Kaplan-Meier estimates of survival. Fisher exact test and multivariate regression were used to analyze the association between anaplasia grade and high-risk histologic features.
Results
Increasing grade of anaplasia was associated with decreased overall survival ( P = .003) and increased risk of metastasis ( P = .0007). Histopathologic features that were associated with anaplasia included optic nerve invasion ( P < .0001), choroidal invasion ( P < .0001), and anterior segment invasion ( P = .04). Multivariate analysis considering high-risk histopathology and anaplasia grading as predictors of distant metastasis and death showed that high-risk histopathology was statistically significant as an independent predictor ( P = .01 for metastasis, P = .03 for death) but anaplasia was not ( P = .63 for metastasis, P = .30 for death). In the absence of high-risk features, however, severe anaplasia identified an additional risk for metastasis ( P = .0004) and death ( P = .01).
Conclusion
Grading of anaplasia may be a useful adjunct to standard histopathologic criteria in identifying retinoblastoma patients who do not have high-risk histologic features but still have an increased risk of metastasis and may need adjuvant therapy.
Retinoblastoma is the most common primary intraocular malignancy of childhood. Risks of metastasis and mortality in retinoblastoma have been shown to be associated with certain histopathologic features, including tumor invasion of the optic nerve, choroid, and anterior chamber. The presence of any of these high-risk histologic features warrants administration of adjuvant chemotherapy after enucleation. There are occasional cases that are negative for high-risk histologic findings that develop metastases, although these cases are probably underreported. In such cases, we believe that there may be cytologic characteristics that are not routinely assessed that may yield prognostic information.
Anaplasia refers to the cytologic features of cells considered to be characteristic of malignant neoplasms. Anaplastic cells display marked pleomorphism, high nuclear-to-cytoplasmic ratios, hyperchromatic nuclei, abnormal nuclear contours, prominent nucleoli, and loss of normal polarity. The term anaplasia also implies an increased capacity for cellular multiplication. Mitoses are often numerous in highly anaplastic tumors. Neoplastic cell populations may show considerable genetic instability and manifest progressive increases in mutation rates. Consequently, clonogenic subpopulations emerge that become preferentially selected so as to form the dominant proliferating cell pool, resulting in an increased tumor growth fraction. This malignant transformation is phenotypically expressed as cellular anaplastic change. Increasing degrees of anaplasia are thought to translate to more aggressive tumor invasion and progression.
Retinoblastoma is considered to be one of the types of embryonal central nervous system tumors, a group which includes medulloblastoma, neuroblastoma, pineoblastoma, and medulloepithelioma, among others. The grading of anaplasia is a well-established criterion used in the classification of medulloblastomas and has been shown to be associated with aggressive clinical behavior. In this study, we describe a grading system for anaplasia in retinoblastoma and determine whether the grading of anaplasia correlates with histologic features known to have prognostic significance regarding clinical outcomes (metastasis and survival). We hypothesize that increasing severity of cellular anaplasia is associated with high-risk histologic features and progressively worse clinical outcomes in retinoblastoma.
Methods
We obtained Emory University Institutional Review Board approval for this study (IRB #00069328). Cases were identified by searching through the records of the L.F. Montgomery Laboratory at the Emory Eye Center from January 1940 through August 2013 for enucleation specimens with a diagnosis of retinoblastoma. Exclusion criteria were as follows: cases that were treated with any modality (chemotherapy, cryotherapy, laser, and/or radiotherapy) prior to enucleation; specimens with less than 2 microscopic low-power fields (20×) of tumor; and specimens with diffuse growth patterns. Patient medical records were reviewed for demographic information (age at presentation, age at enucleation, sex, and race) and clinical findings including family history, laterality, symptoms, ophthalmologic findings, Reese-Ellsworth (RE) Classification, International Classification of Retinoblastoma (ICRB), length of follow-up, treatments, and clinical outcomes. Clinical outcomes were documented including local recurrence, distant metastasis, secondary tumors, and final disposition (alive with no active disease, alive with metastasis, death from disease, and death from other causes).
Histopathologic Review
Microscopic examination of the enucleation specimens was conducted independently by 2 ophthalmic pathologists (H.E.G. and C.S.S.). The reviewers were masked to individual patient data at the time of histopathologic assessment. For all cases, standard pupil–optic nerve sections and transverse sections of the optic nerve at the surgical margin were reviewed. Additional sections from calottes were also reviewed when available. The histopathologic review was performed in accordance with the American Joint Committee on Cancer (AJCC) pathologic classification and included only the T (tumor) tumor size (greatest basal dimension and thickness of tumor in millimeters), growth pattern (exophytic, endophytic, or combined), level of differentiation (undifferentiated, poorly differentiated, moderately differentiated, or well differentiated), tumor seeding (vitreous, subretinal, or both), extent of tissue invasion (anterior segment, optic nerve, choroid, and/or extrascleral), degree of apoptosis (percentage of apoptotic cells within tumor), degree of anaplasia (mild, moderate, or severe), and presence/absence of retinocytoma. A mitotic index was performed by counting the number of mitotic figures in 10 randomly selected high-power fields using a 40× objective lens (Olympus, Tokyo, Japan).
Optic nerve invasion was characterized as: prelaminar (superficial invasion anterior to the lamina cribrosa), laminar (invasion to the level of the lamina cribrosa), postlaminar (invasion posterior to the lamina cribrosa and anterior to the surgical margin of resection), or invasion to the surgical resection margin of resection. Choroidal invasion was classified as nonmassive (<3 mm in maximum diameter adjacent to the sclera) or massive (≥3 mm in diameter adjacent to the sclera). Anterior segment invasion was considered positive if tumor invasion was seen in the anterior chamber, iris, and/or ciliary body. High-risk histologic features were defined based on consensus guidelines set by the International Retinoblastoma Staging Working Group as the presence of 1 or more of the following: postlaminar optic nerve invasion, massive choroidal invasion, a combination prelaminar or laminar optic nerve invasion and nonmassive choroidal invasion, and tumor invasion into the anterior segment.
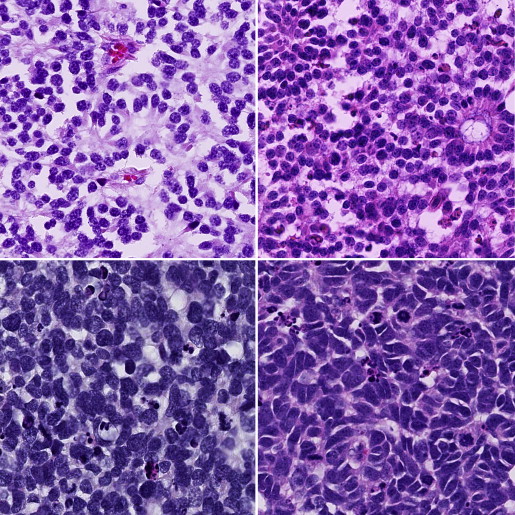
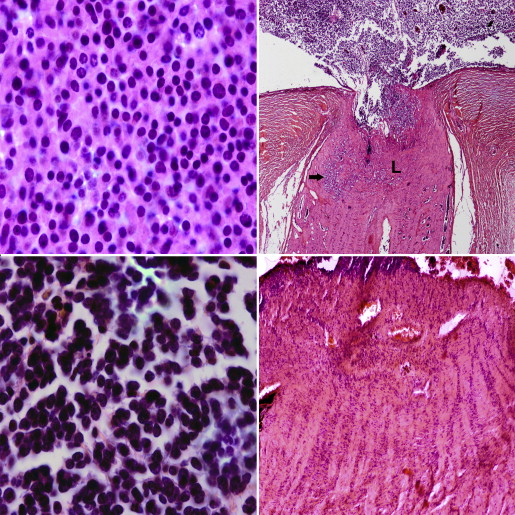
Anaplasia grading ( Figure 1 ) was described based on the following cytologic features: cell shape, cell wrapping, nuclear size, nuclear contour, nuclear chromaticity, and frequency of mitoses. The grading of anaplasia was as follows: retinocytoma: nuclei not enlarged, evenly dispersed chromatin, no pleomorphism, no mitotic figures, abundant eosinophilic cytoplasm, and prominent photoreceptor differentiation (fleurettes); mild anaplasia: nuclei not enlarged, mild pleomorphism, rare mitotic figures, photoreceptor differentiation (Flexner-Wintersteiner and Homer Wright rosettes); moderate anaplasia: unambiguously enlarged nuclei, definite pleomorphism, frequent mitotic figures, moderate to poor differentation; severe anaplasia: very large hyperchromatic nuclei, extreme pleomorphism (angular, rhomboid, or fusiform), cell wrapping, numerous mitotic figures, poor differentiation. In all tumors, the highest grade of anaplasia encountered that occupied at least 10% of the tumor was used to classify the tumor. For example, a tumor with diffuse moderate anaplasia but with a focal region of severe anaplasia that occupied 10% of the tumor was designated as severely anaplastic.
There is no current standard definition for the levels of differentiation in retinoblastoma. For this study, we did separate analyses for 2 different ways of defining differentiation based on the types of rosettes/fleurettes (scheme 1) and the presence of rosettes/fleurettes considering the extent of these within the tumor (scheme 2). For scheme 1, level of differentiation was defined as undifferentiated (no rosettes or fleurettes), poorly differentiated (presence of Homer Wright rosettes only), moderately differentiated (presence of Homer Wright and/or Flexner-Wintersteiner rosettes), or well differentiated (presence of Homer Wright, Flexner-Wintersteiner and/or fleurettes). For scheme 2, the level of differentiation was defined as undifferentiated (no rosettes or fleurettes), poorly differentiated (Homer Wright and/or Flexner-Wintersteiner rosettes seen in less than one third of the tumor), moderately differentiated (Homer Wright and/or Flexner-Wintersteiner rosettes seen in one third to two thirds of the tumor), or well differentiated (Homer Wright, Flexner-Wintersteiner, and/or fleurettes seen in more than two thirds of the tumor).
Statistical Analysis
Fisher exact test was used to analyze the association between anaplasia grade and ordinal categorical variables of optic nerve invasion (absent, prelaminar, laminar, postlaminar, or surgical margin), choroidal invasion (absent, nonmassive, or massive), and anterior segment invasion (absent or present). The association of anaplasia grade and clinical features such as age at enucleation and tumor size were also analyzed. Logistic regression analysis was performed to identify factors predictive of outcome (metastasis and death from disease). The factors found to be significant on univariate analysis were considered for multivariate analysis. Those significant at the 5% level on multivariate analysis (proportional hazards regression) were reported. Pathologic and clinical data were compared using Kaplan-Meier estimates of survival. A P value of <.05 was considered to be statistically significant. All analyses were performed using SAS version 9.2 (SAS Institute Inc, Cary, North Carolina, USA).
Nuclear Morphometric Analysis
Glass slides of hematoxylin-eosin-stained tumor tissue were digitally scanned using the Hamamatsu Nanozoomer 2.0HT (Hamamatsu Photonics, Hamamatsu, Japan). The resulting images had a resolution of 0.2265 μm per pixel. Regions of interest equivalent to 2 high-power fields at 40× magnification were outlined for each slide. Nuclei within the regions of interest were identified through color deconvolution, cell similarity values, and hysteresis thresholds. Analysis was done on a total of 5260 nuclei (911 from retinocytoma, 1389 from mild, 1432 from moderate, and 1528 from severe). For each segmented nucleus, computations were carried out for features pertaining to nuclear size (area: total number of pixels within a nucleus; and perimeter: arc length of a nuclear boundary), shape (circularity: degree of nuclear circularity/round shape; extent: degree of nuclear shape regularity; and eccentricity: degree of nuclear elongation), and hyperchromaticity (mean intensity: mean brightness of pixels within a nucleus) using Matlab (Mathworks Inc, Natick, Massachusetts, USA). The nuclear diameter in micrometers was determined based on the largest distance between 2 nuclear edge points. For statistical analysis, the mean was computed for each nuclear feature and 1-way analysis of variance (ANOVA) and multiple comparison test (MCT) were used to analyze differences between group means.
Results
Clinical Features and Histopathologic Findings
Three hundred fourteen cases were reviewed and 48 cases were excluded owing to the previously mentioned exclusion criteria. Histopathology slides were available for all 266 remaining cases. The clinical and pathologic findings in our cases are listed in Table 1 . The mean age at time of enucleation was 21.9 months (range 1–84 months). Patients with bilateral tumors presented at a younger age (mean 11.6 months) compared to those with unilateral tumors (mean 24.3 months). Of the 266 patients, 147 (55.3%) were male and 119 (44.7%) were female. The majority, 231 (86.8%), of patients had unilateral retinoblastoma and 249 (93.6%) had a negative family history of retinoblastoma. The most common sign at presentation was leukocoria in 165 patients (62%), followed by strabismus in 37 (13.9%). Tumors in the enucleated eyes classified using the RE scheme were either Group Va or Vb, while those classified using the ICRB scheme were all either Group D or Group E. The mean percentage of apoptotic cells in tumors was 36% (range 0%–90%). Combined exophytic and endophytic growth pattern was commonly seen in 119 (44.7%). Our results showed a variable association between anaplasia grade and level of differentiation. For scheme 1, there was no significant association between degree of anaplasia and differentiation ( P = .06). In contrast, scheme 2 showed a statistically significant correlation between anaplasia and differentiation ( P = .001). One or more high-risk histopathologic features were present in 76 cases (28.6%), the most common of which was postlaminar optic nerve invasion in 48 (18.0%), followed by massive choroidal invasion in 40 (15.0%), anterior segment invasion in 18 (6.7%), and combined nonpostlaminar optic nerve and nonmassive choroidal invasion in 15 (5.6%).
| Feature | |
|---|---|
| Sex | |
| Male | 147 (55.3) |
| Female | 119 (44.7) |
| Laterality | |
| Unilateral | 231 (86.8) |
| Bilateral | 35 (13.2) |
| Age at enucleation | |
| Overall (mo) | 21.9 (range 1–84) |
| Unilateral (mo) | 24.3 |
| Bilateral (mo) | 11.6 |
| Less than 1 year | 62 (23.3) |
| 1–2 years | 92 (34.6) |
| Greater than 2 years | 112 (42.1) |
| Race | |
| White | 158 (59.4) |
| African-American | 87 (32.7) |
| Hispanic | 12 (4.5) |
| Asian | 5 (1.9) |
| African | 3 (1.1) |
| Middle Eastern | 1 (0.4) |
| Family history | |
| Negative | 249 (93.6) |
| Positive | 17 (6) |
| Presenting signs | |
| Leukocoria | 165 (62.0) |
| Strabismus | 37 (13.9) |
| Decreased vision | 24 (9.0) |
| Eye redness | 15 (5.6) |
| Periorbital swelling | 14 (5.3) |
| Proptosis | 5 (1.9) |
| Buphthalmos | 3 (1.1) |
| Cloudy cornea | 2 (0.8) |
| Asymptomatic, screened for family history | 1 (0.4) |
| Degree of anaplasia | |
| Mild | 29 (10.9) |
| Moderate | 171 (64.3) |
| Severe | 66 (24.8) |
| Level of differentiation (mean age in months) | |
| Undifferentiated (30.4) | 106 (39.8) |
| Poorly differentiated (20.9) | 84 (31.6) |
| Moderately differentiated (19.5) | 48 (18.0) |
| Well differentiated (12.0) | 28 (10.5) |
| High-risk histopathology | 76 (28.6) |
| Postlaminar optic nerve invasion | 48 (18.0) |
| Massive choroidal invasion | 40 (15.0) |
| Anterior segment invasion | 18 (6.7) |
| Nonpostlaminar optic nerve + nonmassive choroidal invasion | 15 (5.6) |
| Growth pattern | |
| Exophytic | 108 (40.6) |
| Endophytic | 39 (14.6) |
| Combined | 119 (44.7) |
| AJCC pathologic staging | |
| pT1 | 110 (41.4) |
| pT2a | 82 (30.8) |
| pT2b | 15 (5.6) |
| pT3a | 30 (11.3) |
| pT3b | 16 (6.0) |
| pT4 | 5 (1.9) |
| pT4a | 4 (1.5) |
| pT4b | 6 (2.3) |
Complete clinical data and follow-up reports were available for 125 cases and these were analyzed for survival and metastasis. The mean length of follow-up was 84.7 months, with a range of 6–581 months. Distant metastasis occurred in 11 of 125 patients (8.8%), and 7 of 125 (5.6%) died from metastatic retinoblastoma. The findings for the cases with metastasis are summarized in Table 2 . Secondary tumors developed in 5 patients (4.0%) and included 1 pinealoma, 2 osteosarcomas, 1 soft tissue sarcoma, and 1 renal cell carcinoma. One patient died from osteosarcoma that metastasized to the lungs.
| Case Number | Year of Diagnosis | Laterality | High-Risk Features (Level of Tumor Invasion) | Age at Enucleation (Months) | Anaplasia Grade | Adjuvant Chemotherapy | Site of Metastasis | Death From Disease |
|---|---|---|---|---|---|---|---|---|
| 1 | 1947 | Unilateral | Margin optic nerve, massive choroidal, anterior segment | 19 | Severe | No | CNS | Yes |
| 2 | 1965 | Bilateral | Postlaminar optic nerve, massive choroidal | 25 | Severe | No | CNS, bone | No |
| 3 | 1975 | Bilateral | Postlaminar optic nerve, massive choroidal | 24 | Severe | No | CNS | Yes |
| 4 | 1993 | Bilateral | Laminar optic nerve, nonmassive choroidal | 16 | Severe | No; received external beam radiation to the opposite eye | Bone | Yes |
| 5 | 2009 | Unilateral | Postlaminar optic nerve, massive choroidal | 68 | Severe | Yes | CNS | Yes |
| 6 a | 2012 | Unilateral | None | 33 | Severe | No | Bone, liver | No |
| 7 a | 2012 | Unilateral | None | 27 | Severe | No | Bone, liver, CNS | Yes |
| 8 | 2013 | Unilateral | Postlaminar optic nerve, massive choroidal, anterior segment | 31 | Severe | Yes | CNS | No |
| 9 | 1966 | Unilateral | Margin optic nerve, massive choroidal, anterior segment | 20 | Moderate | No | CNS | Yes |
| 10 | 1999 | Unilateral | Massive choroidal | 23 | Moderate | No | Bone | No |
| 11 | 2001 | Unilateral | Postlaminar optic nerve, massive choroidal | 28 | Moderate | Yes | CNS | Yes |
a Patients with no high-risk histologic features but developed metastasis.
Anaplasia Grading
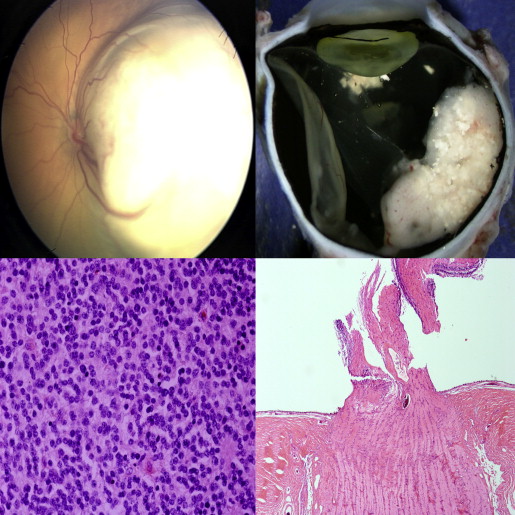
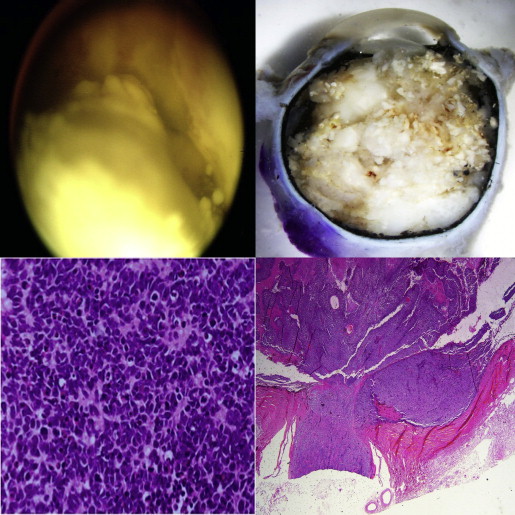
Based on evaluation of 266 enucleation specimens, 171 retinoblastomas (64.3%) were moderately anaplastic, followed by 66 (24.8%) severe and 29 (10.9%) mild. Eight tumors contained retinoblastoma with an associated retinocytoma component. Higher ranges and mean numbers of mitoses corresponded to increasing severity of anaplasia. The mitotic counts were as follows: mild anaplasia: mean, 2.4 and range, 1.5–3.2; moderate anaplasia: mean, 5.7 and range, 3.1–8.1; severe anaplasia: mean, 7.4 and range, 4.2–21.2. Using the Fisher exact test, histopathologic features that were statistically associated with anaplasia were the degree of optic nerve invasion ( P < .0001), degree of choroidal invasion ( P < .0001), and anterior segment invasion ( P = .04) ( Figures 2 and 3 , Supplemental Tables 1–3 , available at AJO.com ). There were cases in which the anaplasia grade did not coincide with the presence or absence of high-risk features: 4 cases of mild anaplasia that had postlaminar optic nerve, 1 of which had concurrent massive choroidal invasion; and 23 cases of severe anaplasia that did not have any histologic high-risk features ( Figure 4 ). The mean age at enucleation was progressively older as tumors became more anaplastic ( P = .05). Factors that were not significant were race ( P = .07), laterality ( P = .26), growth pattern ( P = .17), and tumor size ( P = .05).
The extent of anaplasia was variable within the specimens. We observed that tumors could have extensive areas of a certain anaplasia grade with a focal area of a different grade. The classification was further subdivided into 5 categories for the 125 cases with complete clinical data: 15 out of 125 (12.0%) were mild diffuse, 39 out of 125 (31.2%) were mild with focal moderate, 38 out of 125 (30.4%) were moderate diffuse, 27 out of 125 (21.6%) were moderate with focal severe, and 6 out of 125 (4.8%) were severe diffuse. In general surgical pathology, neoplasms are graded histologically using the highest grade region identified. We used this evaluation scheme in our study; for example, a tumor classified as “moderate with focal severe” was simply designated as “severe.” Our findings showed a greater incidence of metastasis among those with severe diffuse anaplasia, at 4 out of 6 (66.7%), compared to moderate with focal severe anaplasia, at 4 out of 27 (14.8%). We also noted a difference in the moderate anaplasia group. None of the mild with focal moderate cases developed metastasis, while 3 out of 38 (7.89%) in the moderate diffuse group developed metastasis.
Among the 62 patients who were less than 1 year old, 43 (69.4%) had moderate anaplasia, followed by 17 (27.4%) mild, and only 2 (3.2%) had severe anaplasia. However, among the moderately anaplastic tumors, 15 out of 43 cases (34.9%) had focal areas of severe anaplasia. Based on differentiation scheme 2, 8 (12.9%) were undifferentiated, 23 (37.1%) poorly differentiated, 14 (22.6%) moderately differentiated, and 17 (27.4%) well differentiated. We had 1 documented case of a unilateral nonfamilial retinoblastoma diagnosed at 7 months of age with molecular testing revealing no mutations in the RB1 gene but with MYCN amplification as described by Rushlow and associates. The enucleated eye from that patient showed an undifferentiated tumor having moderate with focal severe anaplasia and no optic nerve or choroidal invasion.
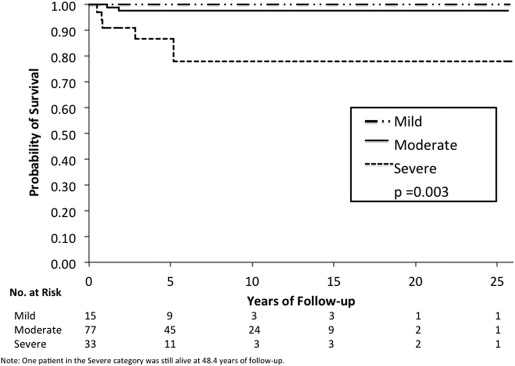
Based on follow-up data in 125 retinoblastoma patients, Kaplan-Meier evaluations showed that increasing grade of anaplasia was associated with decreased survival ( P = .003) ( Figure 5 ) and increased risk of metastasis ( P = .0007) ( Figure 6 ). The presence of high-risk features was associated with decreased survival ( P < .0001) and increased risk of metastasis ( P < .0001). Multivariate analysis considering high-risk histopathology and anaplasia grading as predictors of distant metastasis and death showed that high-risk histopathology is statistically significant as an independent predictor ( P = .01 for metastasis, P = .03 for death) but anaplasia is not ( P = .63 for metastasis, P = .30 for death). In cases that have no high-risk features, severe anaplasia identifies an additional risk for metastasis ( P = .0004) and death ( P = .01). A limitation of our study was the insufficient statistical power to make any definite conclusions owing to the small number of cases with metastasis and death. The distribution of cases with or without metastasis who were or were not treated with adjuvant therapy with regard to severe anaplasia and high-risk histopathology are shown in Table 3 .