Fig. 3.1
Variable deformation of the optic disc and peripapillary appearance in highly myopic eyes (Nakano et al. [28])
Recently, it has been shown that tilting of the optic disc and enlargement of PPA are acquired features that are progressive in children who exhibit myopic shift (Fig. 3.2) [29]. Thus, variable myopic deformation of the optic disc may be acquired from peripapillary scleral stretching associated with myopic eyeball elongation [29]. Furthermore, excessive myopic shift does not appear to affect only the optic disc and peripapillary structure, but it also causes lamina cribrosa (LC) abnormalities, such as LC thinning [30], greater LC pore area [31], horizontal LC tilting [32], and a higher incidence of LC defects [33, 34].
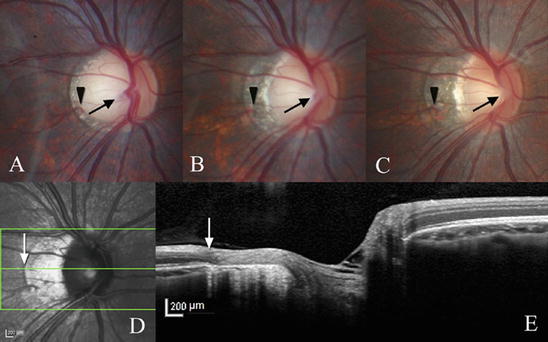
Fig. 3.2
Progressive tilting and formation of peripapillary atrophy in children who exhibited myopic shift. (a–c) Color disc photographs (a) at 12 years, (b) 14 years, and (c) 18 years old. (d and e) Spectral-domain optical coherence tomography images of the optic disc in (c) (Kim et al. [29])
PPA has been found to be more complicated in structure than previously thought. A study using SD-OCT revealed that PPA is comprised of two components: aging-related RPE atrophy with intact Bruch’s membrane (BM) and a gap between the scleral ring and BM termination resulting from scleral stretching associated with myopic elongation of the globe in children (Fig. 3.3) [35, 36].
Fig. 3.3
Peripapillary atrophy is comprised of two component: aging-related retinal pigment epithelium (RPE) atrophy, including intact Bruch’s membrane (BM), and a gap between scleral ring and BM termination resulting from scleral stretching associated with myopic elongation of the globe (Nonaka et al. [35])
These optic disc and peripapillary deformations not only make GON diagnosis difficult but also are themselves associated with glaucomatous damage. Optic disc tilt and cyclotorsion have been found in several studies to be highly prevalent in normal-tension glaucoma (NTG) patients with myopia. In addition, the direction of optic disc cyclotorsion was associated with the location of VF defects [37, 38]. Moreover, the presence of LC defects, which have recently been shown to be related to glaucomatous damage [39] and glaucomatous VF progression [40], has been associated with myopic optic disc morphology in primary open-angle glaucoma (POAG) eyes with high myopia [34]. The rate of RNFL thinning was faster for eyes with β-zone PPA and an intact BM than for eyes without β-zone PPA or with β-zone PPA devoid of BM [41].
Higher myopia has been associated with a significantly higher incidence of cecocentral scotomas located just temporal and inferior to the fixation point in advanced glaucoma [16, 17]. Additionally, highly myopic eyes are more susceptible to papillomacular bundle defects, even in early glaucoma (Fig. 3.4) [18]. These defects are characterized by multiple narrow defects (Fig. 3.5) [18, 42]. It remains unknown whether the myopic deformation of the optic disc is related to this atypical glaucomatous damage. It should be noted that the narrow papillomacular bundle defects are not as easily found because the background RNFL reflection is weaker in the macula than in the superotemporal and inferotemporal double-hump regions. Also, early damage to the papillomacular bundles is often undetectable by SAP 24-2 or 30-2 [43]. Detection of early RNFL damage causing paracentral VF defects is also important for glaucoma diagnosis in high myopia.
Fig. 3.4
Highly myopic eyes are more susceptible to papillomacular bundle defects in early glaucoma. *P < 0.01 (chi-square test). The number of eyes in which the nearest retinal nerve fiber layer defect was detected within the corresponding range was plotted for each angular location (Kimura et al. [18])
Fig. 3.5
Retinal nerve fiber layer (RNFL) defects involving the papillomacular bundle observed in highly myopic eyes. (a–d) Red-free imaging using HRA2 (Heidelberg Engineering, Heidelberg, Germany); (e–h) Humphrey Visual Field Analyzer (Carl Zeiss Meditec, Dublin, CA) with the 24-2 Swedish interactive threshold algorithm (SITA) standard program. Multiple RNFL defects can be seen. Although the locations of the paracentral scotomas varied (at P < 0.01), they included the temporal paracentral test points in all four cases (Kimura et al. [18])
3.3 Limitations in Glaucoma Detection by Inter-person Comparison with a Normative Database
SD-OCT allows the reproducible and accurate measurement of several thickness parameters, including circumpapillary RNFL (cpRNFL), and macular thickness parameters, one of which is the ganglion cell complex (GCC; RNFL + ganglion cell layer [GCL] + inner plexiform layer [IPL]) thickness, and another is the GCIPL (Carl Zeiss Meditec)/GCL + (Topcon, Tokyo, Japan) (GCL + IPL) thickness. To determine if the thickness parameters in each eye are abnormally diminished, they are statistically compared, by using confidence intervals (CIs), with the parameters of a normative database of the corresponding age range and gender. Abnormal thinning (red color) is defined as falling below the lower 99th percentile of the CI limit of the normative database, and borderline thinning (colored with yellow) as between the lower 95th and 99th percentile CI limits (Fig. 3.6). Such a method, based on comparison of measurements, has the following three limitations that lower the ability to identify glaucoma:
The first and second limitations addressed above hold true regardless of the presence, absence, or severity of myopia. In particular, a large overlap between normal and early diseased eyes due to the wide distribution of normal thickness values clearly indicates the difficulty in perfectly discriminating normal from early glaucomatous eyes. Underestimation resulting from area averaging further decreases the ability to discriminate for all the thickness parameters, as does the third limitation mentioned, which is specific to myopic eyes. Thus, we need to interpret the results of statistical comparisons with CIs from normative databases with these limitations in mind.
1.
A large overlap exists between normal and early glaucomatous eyes.
The range of thickness is quite large in healthy eyes. Such variation in the human body is useful for survival of humans as a species against the environmental change encountered in nature, but it makes it difficult to discriminate an abnormal structure from normal one. There is a significant overlap in the thickness distribution of retinal layers between normal and early diseased eyes, even if age, gender, and refractive errors match [44–55]. This holds true even in eyes with early VF defects. It is difficult to statistically distinguish two groups with a wide overlap. For example, Tan et al. measured macular GCC thicknesses (mean ± SD) of 76.6–119.0 (94.8 ± 7.58) μm, 68.6–114.6 (87.0 ± 9.37) μm, and 53.6–99.1 (79.4 ± 10.4) μm for normal eyes, eyes with preperimetric glaucoma, and eyes with early glaucoma, respectively [44]. When the CIs of the study subjects are compared to those of the normative database, it is evident that a large number of early diseased eyes were classified as normal (false-negative; Fig. 3.7). This is a limitation originating from the inherent variability of the human race, and therefore it cannot be resolved by the development of more accurate measurement technologies. It follows therefore that inter-person comparison is not a suitable strategy for discriminating between normal and glaucomatous eyes.
2.
The averaging of measurements within a fixed area results in an underestimation of results.
It is difficult in practice to compare each of numerous OCT A-scans with that of the normative database. Therefore, the measurements of all the A-scans on a circumpapillary (cp) circle around the optic disc are averaged to generate the cpRNFL parameter and those within a circle of 6-mm diameter over the macula to generate the macular thickness parameters (total thickness, GCC, and GCIPL/GCL+). This averaging causes an underestimation of the degree of retinal layer thinning, because early glaucomatous damage is often localized within a smaller segment of the measurement area. For example, even if a circle area of 2-mm diameter within the macula of 6-mm diameter is thinned by 100 %, this amounts to a total loss in thickness of only 6 % within the macula. Thus, when averaged within an area, the healthy or less affected areas render the measured degree of thinning less severe. To avoid this underestimation, sector analysis has been developed. In this, the cpRNFL circle is divided into 6–36 sectors, and the macular circle of 6-mm diameter is divided into either superior and inferior semicircles, Early Treatment Diabetic Retinopathy Study (ETDRS) sectors, or glaucoma chart sectors (ETDRS sectors rotated by 45°). Sector analysis appears to effectively detect local damage in early glaucoma. However, the location of RGC damage, which differs among patients, is not necessarily limited to one sector, but often spans 2–4 sectors. As a result, the glaucomatous damage is often localized even within the sectors.
3.
The effects of myopia are not considered in current normative databases.
Prior studies have shown that decreased average cpRNFL thickness is a strong indicator of glaucoma [56–62]. Unfortunately, cpRNFL thickness is not as effective as a diagnostic marker in highly myopic eyes [63–66]. This discrepancy has been attributed to the somewhat abnormal cpRNFL profiles in highly myopic eyes, which include thinning [64, 67–69] and differences in peripapillary thickness distribution [70–72] in comparison with non-highly myopic eyes. Abnormalities in the cpRNFL profile become more prominent with increases in the degree of myopia [64, 68, 69, 72], axial length [64, 65, 69, 72], and optic disc tilting [70, 71]. Regardless of the strong effects of high myopia on cpRNFL thickness, current normative databases, except that of the RS-3000 Advance (Nidek, Gamagori, Japan), do not include data specific to refractive errors greater than -6 diopters. Similarly, although the glaucoma diagnostic software in these SD-OCT instruments uses CIs from age- and gender-matched eyes for identifying abnormal thinning, none of them compare measurements with CIs from a normative database of eyes with corresponding refractive errors.
Fig. 3.6
Definition of abnormal and borderline thinning from OCT measurements compared with the confidence intervals (CIs) of the same measurements from a normative database of the corresponding age range and gender. cpRNFL circumpapillary retinal nerve fiber layer, GCC ganglion cell complex
Fig. 3.7
Schematic explanation of the reasons for the poor performance of the normative database comparison strategy with regard to the differential diagnosis of normal and early diseased eyes (This scheme is based on data presented in the following article: Tan et al. [44])
3.4 Segmental Errors Caused by Deformation of the Peripapillary Structure
Myopic deformation of peripapillary structures leads to failures in cpRNFL thickness measurement in some highly myopic eyes (7.1 %) [28]. Specifically, two types of deformation are responsible for cpRNFL segmentation (software generation of boundary lines) failure: steep peripapillary scleral slope and large PPA. The cpRNFL varies in height in eyes with high myopia, being most commonly highest in the nasal quadrant and lowest in the temporal quadrant, giving the structure a dome-like appearance in cpRNFL B-scan (Fig. 3.8) [28]. The temporal-most portion of the cpRNFL (the bottom of the dome-like appearance) appears in the inferior half of the image acquisition frame and generally shows low signal intensity [28]. This is due to the fact that signal intensity decays with deeper axial distance, a disadvantage of SD-OCT technology [73]. In eyes with an inferiorly tilted disc, the inferior peripapillary portion is much lower than superior one, which results in a sigmoid appearance. Consequently, the signal intensity of the inferior cpRNFL is rendered very low. Such low signal intensity can result in segmentation algorithms being unable to recognize the RNFL boundaries, straying instead into the deeper retina (Fig. 3.8) [28]. Another common cause of segmentation failure in highly myopic eyes is inclusion of PPA on the circumpapillary circle scan. In this case, the segmentation algorithm appears to be pulled away from the cpRNFL boundaries by the high scleral reflectivity within the PPA (Fig. 3.8) [28].
Fig. 3.8
Segmental errors caused by deformation of the peripapillary structure. There are two reasons why segmentation error occurs in the circumpapillary retinal nerve fiber layer (cpRNFL) measurement but not in the macular ganglion cell complex measurement. The left-hand images indicate cpRNFL segmentation errors caused by signal intensity decays stemming from deeper axial distance. The right-hand images show extensive PPA (Nakano et al. [28])
3.5 Differing Effects of Higher Myopia on Glaucoma Discriminating Power
We now understand that highly myopic eyes often have structural limitations, such as abnormal profiles of the cpRNFL and peripapillary steep slope. These limitations may be responsible for inaccuracies in cpRNFL measurements to detect glaucoma. A receiver operating characteristic (ROC) regression analysis [74, 75] was conducted in the following model considering the modeling covariates age, sex, visual field mean deviation (MD), axial length, and signal strength index:
![$$ \mathrm{Receiver}\ \mathrm{operating}\ \mathrm{characteristic}\;\left(\mathrm{t}\right)=\Phi\;\left[\upalpha 0+\upalpha 1\;\Phi -1\;\left(\mathrm{t}\right)+\upalpha 2\mathrm{Age}+\upalpha 3\mathrm{Sex}+\upalpha 4\mathrm{M}\mathrm{D}+\upalpha 5\mathrm{A}\mathrm{L}+\upalpha 6\mathrm{S}\mathrm{S}\mathrm{I}\right] $$](/wp-content/uploads/2016/10/A318070_1_En_3_Chapter_Equa.gif) where Φ = probit function, MD = visual field mean deviation, AL = axial length, and SSI = signal strength index.
where Φ = probit function, MD = visual field mean deviation, AL = axial length, and SSI = signal strength index.
This model revealed that the effects of longer axial length on glaucoma diagnostic performance differ depending on specific thickness parameters used. Using cpRNFL thickness, a longer axial length was likely to be associated with a poorer diagnostic performance, whereas this was not the case when macular GCC thickness was used [28].
3.6 The Usefulness of the Deviation Map in Detecting Glaucomatous Abnormalities, and Its Limitations in High Myopia
A deviation map is a display of abnormally and borderline-thinned areas on the OCT projection fundus image (Fig. 3.9). Thickness measurements are performed on each A-scan. When the measurement of each A-scan, or the average measurement of several neighboring A-points (the “superpixel”), is below the lower 99th percentile of the CI limit of the normative database, and between the lower 95th and 99th percentile CI limits, it is exhibited in red (abnormal) and yellow (borderline), respectively. In the deviation map, glaucomatous RNFL damage often appears as a pattern of RNFL defects (Figs. 3.9 and 3.10) [76, 78]. These defects occur along the retinal nerve fibers that arise from the optic disc and extend radially or in an arcuate shape. Because false-positive A-scans or superpixels are rarely arranged in this unique pattern, an RNFL defect-like abnormal area in the deviation map is an excellent indicator of glaucomatous damage and its progression (Figs. 3.9 and 3.10) [76, 78]. However, we need to note that this pattern also often gives rise to false-positives in high myopia.
Fig. 3.9
The deviation map is accurate in detecting retinal nerve fiber layer defect in early glaucoma (Jeoung and Park [76])
Compared to non-highly myopic eyes, in eyes with high myopia, the superotemporal and inferotemporal arcuate regions with the thickest RNFL (the double hump) are shifted temporally. The RNFL double-hump angle decreases by approximately 3.38° for every 1-mm increase in axial length [79]. In contrast, normative databases in commercially available SD-OCT devices often primarily contain data from non-highly myopic eyes. For this reason, superotemporal and inferotemporal regions where double humps (thickest RNFL) are located in non-highly myopic eyes are classified as abnormal thinning in highly myopic eyes (Fig. 3.11) when compared with a normative database. The abnormally thinned area has a typical RNFL pattern. However, this finding is a false-positive resulting from the application of a normative database without refractive matching. Thus, we need to exercise care in interpreting deviation maps from eyes with high myopia in OCT devices where a normative database for the condition is not available. Currently, to the best of our knowledge, such a database is only available in the RS-3000 Advance (Nidek).
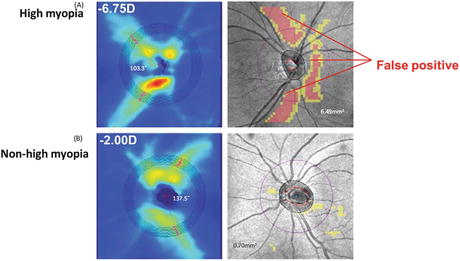
Fig. 3.11
RNFL thickness maps (left–hand panel) and RNFL thickness deviation maps (right-hand panel) of two healthy myopic eyes with spherical equivalent of (a) −6.75 D and (b) −2.00 D imaged by the Cirrus HD-OCT (Carl Zeiss Meditec). The superotemporal and inferotemporal regions become false-positive for glaucoma in highly myopic eyes when compared with a commercially available normative database (Leung et al. [79])
3.7 From Measurement Alone to Observation of Anatomy
It is not only in SD-OCT that average measurements have been compared with normative databases, it is also a standard practice for images from the Heidelberg Retina Tomograph (HRT) confocal laser scanning ophthalmoscope (Heidelberg Engineering, Heidelberg, Germany), the GDx-VCC scanning laser polarimeter (Carl Zeiss Meditec), and the Stratus time-domain OCT (Carl Zeiss Meditec). SD-OCT has higher axial resolution than these conventional imaging devices and much higher imaging speed than time-domain OCT. These advantages of SD-OCT are useful for increasing measurement accuracy and reproducibility [80], but not in resolving the three limitations mentioned above. Speckle noise-free B-scans, which are currently standard B-scans in all SD-OCT instruments, allow observation of single retinal layers, including the GCL, and peripapillary structures, involving optic disc margin anatomy. Because resolution is thus drastically improved in SD-OCT technologies, we should develop further diagnostic strategies based on direct observation of GON-related structural changes, rather than statistical inter-person comparison alone.
3.8 Symmetrical Macular Shape Remains with Aging
Individual macular retinal layers, including the RNFL and GCL, are highly symmetrical between superior and inferior hemispheres [27, 81]. Although each of the macular retinal layers decays with aging, the symmetrical shape remains with aging (Fig. 3.12) [81]. Macular GCL thickness increases rapidly to a peak around 1 mm superior and inferior to the foveal center (Figs. 3.13 and 3.14) [27] and gradually decreases with greater distance from the fovea (Figs. 3.13 and 3.14). Furthermore, the macular GCL is slightly thinner on the temporal than on the nasal side (Fig. 3.14) [27]. As a result, the GCL thickness map generated from three-dimensional macular raster scans shows a Landolt ring-like shape (Fig. 3.12) [81]. Importantly, this characteristic GCL structure is almost identical to the RGC density topography that has been obtained from enucleated human eyes (Fig. 3.14) [82].
Fig. 3.12
Mean thickness maps of 80 subjects aged 20–39 years (left), 83 subjects aged 40–59 years (middle), and 93 subjects aged 60 years and older (right) for the nerve fiber layer (NFL), ganglion cell layer (GCL), and inner plexiform layer (IPL). Right, nasal; left, temporal. Each of the layers thins with age, but remains vertically symmetrical (Ooto et al. [81])
Fig. 3.13
Horizontal (a) and vertical (b) spectral-domain optical coherence tomography B-scan images Each image was generated by averaging 100 B-scans obtained by the eye-tracking SD-OCT system (Spectralis, Heidelberg Engineering, Heidelberg, Germany) (Nakano et al. [27])
3.9 Macular Retinal Layer Thinning Seen on Glaucomatous Optic Neuropathy
In glaucoma, the symmetric GCL structure is apparently diminished in the locations of the corresponding VF defects and optic disc neuroretinal rim thinning/RNFL defects (Fig. 3.15) [28]. Thinning of the GCL is even seen in a large part of eyes with preperimetric glaucoma (Fig. 3.16) [27]. At this early stage, GCL thinning appears to be localized and abrupt.
Fig. 3.15
The symmetrical ganglion cell layer structure is apparently diminished in a location corresponding to the visual field defects, optic disc neuroretinal rim thinning, and retinal nerve fiber layer defects. (a) Color disc photo, (b) pattern deviation map from standard automated perimetry 24-2, (c) vertical scan of spectral-domain optical coherence tomography through the fovea as shown in the infrared image
Fig. 3.16
Appearance of the macula on spectral-domain optical coherence serial vertical scans in an eye with preperimetric glaucoma
3.10 Macular Shape Is Less Affected by the Myopic Changes of the Fundus
The photographic appearance of the optic disc, including disc size, tilting, cyclotorsion, and shape, was highly variable in highly myopic eyes, regardless of VF defect severity (Fig. 3.17) [19–22, 28]. The area of PPA also varied in size and circumference (Figs. 3.2, 3.3, and 3.4). In non-glaucomatous highly myopic eyes, macular layer structure is uniform regardless of the highly variable myopia-related optic disc deformation, which includes tilting, cyclotorsion, and PPA (Fig. 3.17) [28]. Importantly, the uniform layer structure has highly symmetrical shapes in vertical scans, even in highly myopic eyes [28]. The macula lies centrally along the globe’s optical axis, whereas the optic disc is nasally shifted from the optical axis. The fact that the macula is less affected by myopic globe elongation than both the optic disc and the peripapillary sclera is probably due to this difference in position. Excessive myopic globe elongation leads to abnormal scleral extension in the macula, which causes posterior staphyloma. Posterior staphyloma in these eyes mainly shows Curtin classification type I [83], in which the macular layer symmetry remains [28]. In rare cases of type V (inferior staphyloma), type VI/VII (combined staphyloma), and type IX (septal staphyloma), the macular structure may be highly affected. Eyes with such asymmetrical deformation of posterior eye globe often have an extremely long axial length (~30 mm and sometimes more). Such cases may be better classified as pathological myopia. In the glaucoma service, highly myopic glaucomatous eyes usually have an axial length of 28 mm and less and often have symmetrical macular layer structures.
Fig. 3.17
Appearance of the optic disc and spectral-domain optical coherence tomography (SD-OCT) vertical macular scans in highly myopic eyes. The optic disc appearance and peripapillary atrophy are variable regardless of VF defect severity. In contrast, the macular appearance in SD-OCT vertical scans is uniformly symmetrical in eyes without VF defects. The retinal nerve fiber and ganglion cell layers are thinned in locations corresponding to the visual field defects
3.11 Subjective Evaluation of Macular Retinal Layers
Subjective evaluation of structural optic disc abnormalities is not favored in the field of glaucoma diagnosis research. This is because interobserver reproducibility for evaluation of the optic disc appearance is poor. However, in clinical practice, optic disc evaluation has been a gold standard criterion for glaucoma diagnosis. The advent of SD-OCT has allowed clear observation of each macular layer, including the RNFL and GCL. This has reintroduced the possibility that subjective evaluation of cross-sectional RNFL and GCL images may be a useful method for glaucoma diagnosis [27]. As discussed above, variable deformation of the optic disc makes it difficult to detect early glaucomatous changes in the optic disc, particularly in high myopia. Because the macula is highly uniform in size and shape regardless of the highly variable myopic changes of the optic disc, evaluation of the cross-sectional macular retinal layers may now be reproducible and accurate. To test this hypothesis, we asked well-trained glaucoma specialists to evaluate optic disc photos and serial vertical SD-OCT B-scans and found that in non-highly myopic eyes, interobserver agreement was excellent for both optic disc photos and SD-OCT B-scans, whereas in highly myopic eyes, interobserver agreement was poor for optic disc photos but excellent for SD-OCT B-scans [28]. In addition, in non-highly myopic eyes, classification of glaucomatous and non-glaucomatous eyes was almost perfect for both optic disc photos and SD-OCT B-scans, while in highly myopic eyes, photographic classification was less accurate than SD-OCT classification. Thus, subjective assessment of SD-OCT macular serial vertical scans may be useful for supporting glaucoma diagnoses made using photographic disc assessment and software analysis in highly myopic eyes.
3.12 Detection of Damage Causing Paracentral Visual Field Defects
Glaucoma patients who have paracentral scotomas are at high risk of visual acuity loss [84, 85]. Moreover, paracentral VF defects can occur even in the early stages of the disease [18, 86–88]. Oversight or delay in detection of such defects causes physicians to underestimate the severity of glaucoma and progression of central vision loss. Risk factors for developing paracentral scotomas are normal-tension glaucoma (NTG) [89, 90], low maximum untreated intraocular pressures (IOPs) [91], frequent disc hemorrhage [91], systemic factors [91], and high myopia [16, 17, 42, 92, 93]. In advanced glaucoma, high myopia has been associated with significantly higher frequencies of cecocentral scotomas located just temporal and inferior to the fixation point [16, 17]. Atypical RNFL defects, including papillomacular bundle defects, are found in highly myopic eyes with primarily moderate-to-severe VF defects [42]. In this report, longer axial length, larger optic disc, and normal-tension glaucoma are risk factors for papillomacular bundle defects. Importantly, high myopia is a significant risk factor for papillomacular bundle defects and inferotemporal paracentral VF defects, even in early glaucoma [18]. Thus, it is of paramount importance to detect paracentral scotomas as early as possible, particularly in highly myopic eyes. That said, evaluation of optic disc appearance to predict paracentral VF defects is difficult, even in non-highly myopic eyes. This is much more the case in highly myopic eyes.
Stay updated, free articles. Join our Telegram channel

Full access? Get Clinical Tree


