Glare and Contrast Sensitivity Testing
Edmond H. Thall
David Miller
Humberto Salinas
INTRODUCTION
One of the most vexing clinical problems commonly encountered is the patient with vague but definite visual complaints despite a normal or near normal acuity. There may be a tendency to dismiss such complaints as factitious, but they are usually genuine. Ancillary tests such as contrast sensitivity and glare testing not only serve to establish the organic basis of the symptoms but also provide useful diagnostic and therapeutic information. Such cases illustrate the fact that acuity testing, while extremely useful, provides only a partial assessment of central vision.
This chapter discusses two ancillary tests, contrast sensitivity and glare testing, that provide additional insight into visual function. To simplify this discussion the world is assumed to be black, white, and shades of gray. The concepts are extendable to color, but that is beyond the scope of this chapter.
Glare testing and contrast sensitivity both deal with the same basic issue: the effect of diminished contrast on visual function. If the Snellen chart’s black letters are replaced by light gray letters, it becomes more difficult to identify optotypes (Fig. 35-1). Many normal patients cannot see the 20/20 line if the contrast between optotype and background is less than 10%.1 A patient requiring 5% contrast to resolve the 20/60 line will have difficulty recognizing faces,2 and a patient requiring 10% contrast to resolve the 20/60 line would read at a reduced rate.3 Both these patients would escape detection on routine acuity testing, which typically uses 90% contrast or higher.
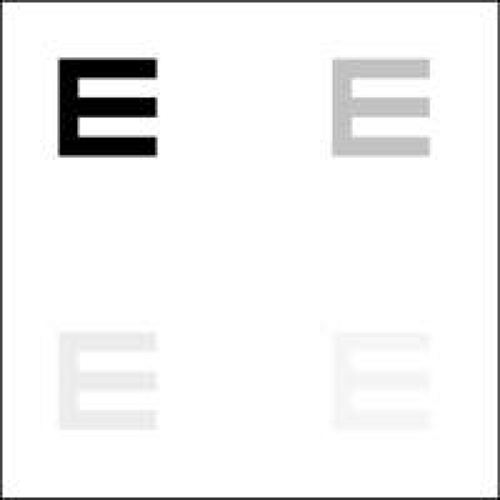 Fig. 35-1. High- and low-contrast optotypes. The basic effect of contrast on visibility is easily demonstrated. Look at the image as you move closer or further away and notice how the lower optotypes seem to appear and disappear. |
Glare is a reduction in retinal image contrast caused by a combination of increased intraocular light scattering and a glare source (Fig. 35-2). The literature often refers to pathology in the ocular media as opacities, but true opacities are uncommon. Opacities prevent light from reaching the retina and are usually too far from the retina to cast a discrete shadow. More typically, light traversing, say, a subcapsular cataract or corneal scar is dispersed but still reaches the retina, usually producing a localized area of decreased contrast (Fig. 35-3).
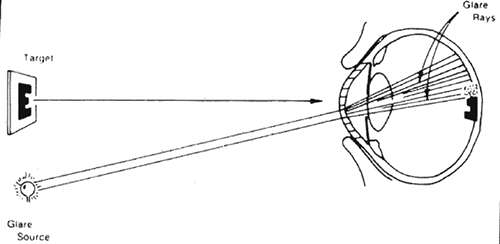 Fig. 35-2. Corneal edema scatters the light from the peripheral light source onto the fovea, decreasing the contrast of the foveal image. (From Miller D, Benedek GB. Intraocular light scattering. Springfield, IL: Charles C Thomas Publisher, 1973:38, with permission.) |
 Fig. 35-3. Photograph of the way the scene would appear to a normal patient (top) and a patient with corneal edema (bottom) in the face of glare. (From Miller D, Benedek GB. Intraocular light scattering. Springfield, IL: Charles C Thomas Publisher; 1973:38, with permission.) |
A generalized reduction in retinal image contrast (Fig. 35-4) occurs when light scattering is extensive, as in pan corneal edema, but can also occur for reasons other than glare such, as higher-order aberrations. It is easy to understand why light scattering diminishes contrast, but the reasons higher-order aberrations affect contrast are more subtle. Sensitivity to contrast can also be diminished by neurological4 or retinal disease.5 Contrast sensitivity is usually better than glare testing for evaluating general contrast loss, and it is essential for detecting diminished contrast sensitivity caused by pathology unrelated to intraocular light scattering, such as optic neuritis,6 multiple sclerosis7 or central serous chorioretinopathy.8
 Fig. 35-4. Generalized contrast loss. The image on the left shows the effect of a generalized reduction in contrast. The original image on the right is shown for comparison. The resolution is the same in both images, only the contrast has changed. |
LIGHT SCATTERING
In geometrical optics, light traverses a medium in straight lines according to the law of rectilinear propagation (see Chapter 30), which is an oversimplification. Mostly, light follows a straight line, but small amounts disperse or scatter in various directions (Fig. 35-5). While the amount of light scattered is usually small, its affects can be important.
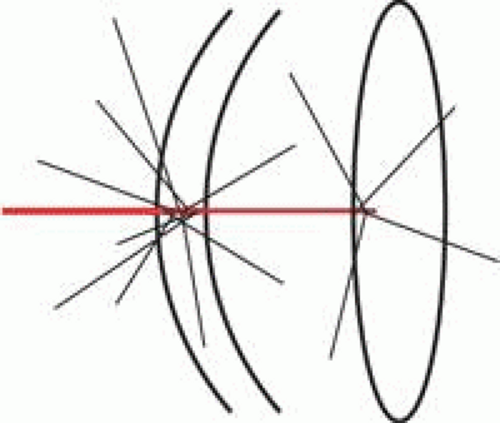 Fig. 35-5. Light scattering. According to the law of rectilinear propagation, light travels through a homogeneous medium in a straight line, but in reality a certain amount of scattering occurs. In some media the scattering is negligible. Incident light from a slit lamp (red) scatters little when traveling through a small amount of atmosphere, but scattering increases when light traverses the cornea. The scattering is in all directions, and some of the backscattered light is collected by the slit lamp optics, making the cornea visible. Scattering is again minimal when traversing the normal aqueous but increases again in the crystalline lens. |
Clinically we observe light scattering every time we use a slit lamp. Most of the slit beam traverses the cornea, but enough light backscatters into the observation optics to render the cornea visible. By comparison the aqueous scatters so little that normally the slit beam cannot be visualized in the anterior chamber. Only when inflammation increases aqueous scattering is the beam apparent. Flare is the clinical manifestation of increased aqueous light scattering produced by macromolecules abnormally present in the aqueous.
Most optical media scatter light to some extent. For instance, on a clear day atmospheric light scattering is minimal and fine details of mountains and skyscrapers are visible from afar, but just slight haze decreases the observable detail. Moderate haze can completely obscure a distant object, just as dense haze or fog completely obscures nearby objects.
Scattering can be useful, for without backscattered light the cornea, crystalline lens, and vitreous would be as invisible as the normal aqueous in the slit lamp. However, forward-scattered light diminishes retinal image contrast (Figs. 35-2, 35-3, and 35-4). The effect is similar to raising the house lights during a movie.
MECHANISMS OF LIGHT SCATTERING
Light scattering has several causes. Rayleigh scattering9 is produced by molecules and small particles usually less than, roughly, one-tenth wavelength of light, which at the center of the visible region of the spectrum is about 550 nm. Rayleigh scattering is strongly wavelength dependent, varying inversely with the fourth power of wavelength. Consequently, blue light with a 400-nm wavelength is scattered 5 times more than red light of 600-nm wavelength.
The sky is blue because of Rayleigh scattering by atmospheric molecules.10 Observed from space without an intervening atmosphere, the sun appears white. Atmospheric scattering of blue light makes the sun appear yellow or red, depending on the amount of atmosphere between the sun and observer.
Rayleigh scattering also polarizes light, which the human visual system cannot detect, but bees use polarization produced by atmospheric Rayleigh scattering to navigate.11 The GDx nerve fiber layer analyzer utilizes polarization by optically anisotropic ocular media to gauge the thickness of the retinal never fiber layer.12 It is well known that such measurements are affected by anisotropy in the cornea, but theoretically, flare in the anterior chamber may also affect such measurements. The theoretical possibility of flare altering nerve fiber layer measurements has yet to be investigated clinically.
Particles of a wavelength of light or larger produce Mie scattering. In Mie scattering, more light is scattered in the forward direction than to the back or side, and the scattering varies only linearly with wavelength.13 Mie scattering is produced by fog and clouds and accounts for the white ring occasionally seen around the moon. Particles between 50 nm and 500 nm produce both Mie and Rayleigh scattering. Most atmospheric light scattering is either Mie or Rayleigh scattering.
Fluorescence also contributes to intraocular light scattering especially in cataract. Fluorescence is the radiation of lower-frequency light when illuminated by higher-frequency exciting light.14 Fluorescein angiography is perhaps the best known clinical example. After excitation, a fluorescent molecule radiates light in all directions, so fluorescence scatters light.
Although it does not produce glare or affect contrast sensitivity, Raman scattering deserves brief mention. When light strikes some molecules it is absorbed and reradiated at lower (Stokes scattering) or even higher frequencies (anti-Stokes scattering) than the incident light.15 The spectrum of reradiated light depends on the chemical nature of the scattering molecules. Fluoroquinolones give a useable Raman spectrum, and Raman scattering has been used to follow fluoroquinolone pharmacokinetics in the anterior chamber.16
Diffraction is the bending of light as a wave traverses an aperture.17 The deviation in direction is inversely related to aperture size.18 An opaque aperture is not necessary to produce diffraction; any change in refractive index suffices. For instance, alternating strips differing in refractive index will produce diffraction effects similar to a grating of alternating opaque and transparent strips.19
Fresnel reflection also produces scattering.20 When light moves from one refractive index medium to another, there is always some slight reflection at the interface between the media. The amount reflected depends on the difference in refractive index and the angle of incidence and is usually on the order of 1% or 2% in ocular media.
INTRAOCULAR LIGHT SCATTERING
It is not surprising that most biological tissue is opaque due to light scattering. Within a cell, variation in refractive index causes diffraction. Cellular organelles have dimensions that produce Mie and possibly Rayleigh scattering. Macromolecules can produce Rayleigh scattering, and some tissues fluoresce. The practical upshot of the light scattering produced by various mechanisms is that most tissue is opaque except when sliced into very thin sections for microscopic examination.
What is surprising is that the relatively thick tissues of the ocular media are transparent. In the 1930s it was felt that the cornea was homogeneous, composed of a material with a single refractive index, and therefore transparent for the same reason glass is transparent, but in the 1950s electron microscopy showed that the cornea is not homogeneous but rather comprises collagen strands embedded in a ground substance matrix.21,22
While not anatomically homogeneous, the cornea would be optically homogeneous if the collagen fibers and ground substance had identical refractive indices. However, various measurements showed that collagen fibers have a refractive index about 1.5 and the ground substance, which is predominantly, water has an index of 1.335,23 so the notion of an optically homogeneous cornea had to be abandoned. When electron microscopy revealed that sclera has the same collagen fiber in ground substance composition and on a volume basis the ratio of collagen to ground substance is the same in both tissues, it begged the question why the cornea is transparent when the sclera is opaque.
One striking difference between cornea and sclera is that in corneal collagen strands are long, straight rods arranged in a very regular pattern, whereas in sclera strands are curved and randomly arranged. In cornea, collagen strands have a diameter of 25 nm and a center to center spacing of about 65 nm. In sclera, collagen fibers have larger diameters and separations, although the volume ratio of collagen to ground substance is about the same in both tissues.
Maurice (24) showed that if scattering from each collagen fiber were independent of other fibers, the cornea would scatter more than 90% of incident light, rendering it opaque. Concluding that light scattering from neighboring strands must be correlated, Maurice proposed that the regular arrangement of fibers in the cornea caused light scattering by neighboring fibers to interfere destructively, forcing (by conservation of energy) almost all light to move straight through the cornea. Maurice concluded that the highly ordered arrangement of collagen fibrils was essential for corneal clarity, and coined the idea of the lattice theory of corneal transparency.24
However, the arrangement of collagen fibers in the Bowman membrane is not regular. The Bowman membrane is sort of a cross between the sclera and the rest of the stroma. Like the sclera, collagen fibers in the Bowman membrane are randomly oriented, but as in the rest of the corneal stroma, the fibers are small and closely packed. If the lattice theory were correct, the Bowman layer would produce substantially more scattering than is observed. In fact, the cornea in some sharks is completely composed of Bowman membrane with no organized stroma, and yet transparent. Consequently, the lattice theory was also untenable.
Using the same Fourier methods discussed later in this chapter, albeit in a very different way, Hart and Farrell25 showed that it was the close spacing (less than half an optical wavelength) and not the regular arrangement that accounts for corneal transparency. Shortly afterward, Benedekr26 using another analytical approach, confirmed that corneal transparency was related to molecular dimensions rather than molecular arrangement. Recently, band gap analysis originally used to describe transparency of semiconductors has been applied to the cornea, confirming previous results.27
Stromal edema increases the spacing between collagen molecules, ultimately increasing scattering and decreasing corneal transparency. However, mild edema does not increase intramolecular spacing enough to alter transparency. Lancon and Miller showed that corneal transparency remains essentially unchanged until hydration increases 5% to 7% above normal.28
The crystalline lens is the thickest transparent cellular structure in the body. Lens fibers are considerably larger than the spacing between collagen fibers in the cornea. Lens transparency certainly depends in part on the regular arrangement of elongated lens fibers.29 Posterior subcapsular cataract is produced by bladder cells, which are abnormal round lens cells that collect at the posterior pole, strongly scattering light.30 However, other factors are also involved. Analysis of lens transparency is also complicated by the fact that refractive index decreases with axial distance from the center.31 Lens transparency has recently been reviewed in the literature.32
The literature often refers to lens opacities, but if cataracts were truly opaque they would have little effect on vision until they occluded the pupil by about 90%. However, because cataracts in fact scatter, they have a much greater effect on vision than a mere opacity.
In a fascinating experiment Miller, Zuckerman, and Reynolds constructed a hologram that focused light scattered by a cataract that had been removed by intracapsular surgery.33,34 Light scattered by the cataract was focused by the hologram, rendering the combination transparent. If the cataract were truly opaque there would be no transmitted light to be refocused by the hologram.
The crystalline lens exhibits fluorescence when stimulated at wavelengths of 415 to 490 nm and radiates at about 510 to 550 nm. Lens fluorescence increases with age.35 The cornea is also modestly fluorescent, and smoking and diabetes alter corneal fluorescence.36r
Lattice and granular corneal stromal dystrophies provide another illustration of the difference between scattering and true opacity. In lattice dystrophy, the cornea is hazy between amyloid deposits, and the cornea strongly scatters, decreasing vision.37 Stromal deposits in granular dystrophy are truly opaque, and vision is not affected until late in the disease, when most of the pupil is occluded.38 Again, it is the degree of forward scattering that determines the effect of pathology on visual function.
When multiple media pathologies coexist, the question always arises which pathology affects vision most. With relatively little experience one can accurately gauge scattering, and usually the lesion that scatters most is the predominant cause of visual loss.
Asperities on the surfaces of corrective lenses are an obvious but easily overlooked source of scattering. Although scratch-resistant coatings are commonly used, spectacles often receive harsh treatment and will scratch over time. A quick inspection is worthwhile for any patient complaining of glare.
MEASURING LIGHT SCATTERING
Light scattering is of interest to workers in many diverse disciplines such as environmental and atmospheric science39, chemistry40, biology41, material engineering42, image interpretation (43)43, remote sensing44, etc. A necessary prerequisite to the study of light scattering is a means of measuring it. To keep the discussion on an intuitive level, rather vague terms such as amount of light or brightness are used. Radiometric and photometric terms are defined in any standard treatment (e.g., Wolfe WL, Introduction to Radiometry, Bellingham, WA: SPIE Publishing Services; 1998) and when used here, are not intended in their strict technical sense except when used as units accompanying numbers.
There are basically two approaches to scattering measurement: bidirectional distribution functions and veiling glare. Bidirectional distribution functions directly measure amount of light scattered and are widely accepted over a broad range of disciplines as the principal method for quantitative characterization of scattered light.
The bidirectional reflection distribution function (BRDF) is used to measure light scattering by opaque surfaces.45 A narrow beam of light is incident on a surface, and the amount of light scattered (i.e., diffusely reflected) is measured in all directions. Since some surfaces scatter more light in some directions than others, scattered light must be measured in all directions (Fig. 35-6). Asteroid hyalosis exemplifies the directional differences in scattering, underscoring the need for measurements in all directions. Calcium deposits in vitreous strongly backscatter light, appearing white on funduscopy. However, asteroid exhibits negligible forward scattering, with little effect on the retinal image.
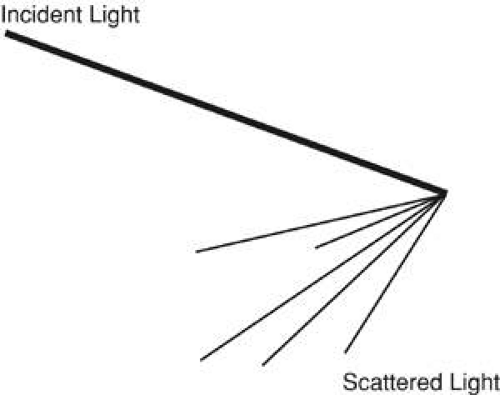 Fig. 35-6. Scattering can be directional. Scattering can occur preferentially in only a few directions or in all directions. The illustration shows scattering confined to a relatively small angle. |
Scattering also depends on the direction of the incident beam, so measurements are made at various directions of incident light. The term bidirectional is used because the direction of both the incident and scattered light are measured. Scattering is also wavelength dependent, so the measurements are repeated at different wavelengths, if necessary. The bidirectional transmission distribution function (BTDF) is measured in an analogous fashion. As one might imagine, bidirectional distribution measurements can be time-consuming, technically difficult, require specialized equipment, and incur significant cost.
If light scattering is used, for instance, to estimate atmospheric pollution, then the amount of light scattered gives a direct estimate of the amount of pollution. However, often we are not interested in the amount scattered per se, but rather the effect on image formation. Veiling glare is not a direct measurement of scattering, but rather a measure of the effects of light scattering on optical performance. A standard target, perhaps a USAF resolution chart, is placed along the optical axis of an imaging system. An off-axis light also illuminates the imaging system, the glare source (Fig. 35-7). The optical system’s resolution is measured with and without the glare source. The difference in resolution is a measure of the effect of light scattering on the imaging system’s optical performance, called the veiling glare index.
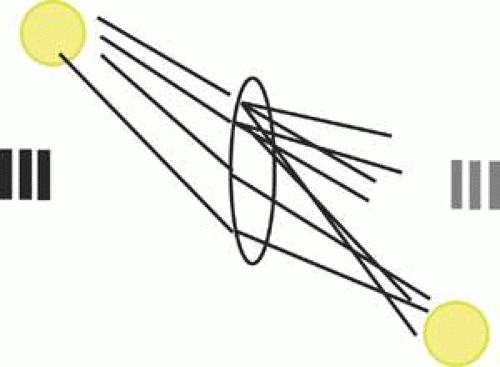 Fig. 35-7. A typical veiling glare test. An optical system images a resolution target, and a glare source is placed off-axis. In the absence of light scattering the glare source would be imaged off axis and not affect the image of the resolution target. Light scattering, if present, decreases image contrast and possibly decreases resolution. |
There are many difficulties with veiling glare tests. For instance, the brightness and location of the glare source are completely arbitrary. What is an appropriate brightness for the glare source? Where should the glare source be positioned? Should a USAF resolution target be used, or would some other target be better? How should the target be illuminated? There are standards for performing veiling glare tests,46 but they are voluntary and not always followed. Despite the difficulties, veiling glare tests are much simpler than bidirectional measurements and useful in certain applications.
CLINICAL GLARE TESTING
Currently, there is no commercially available instrument capable of performing clinical measurements of either BRDF or BTDF. Interzeag” produced a lens opacity meter that illuminates the eye with light from a single direction and measures the backscattered light, also in a single direction.47 This instrument measures a single point of the BRDF function and expresses the results in relative rather than absolute units.48 One difficulty with this device is correlating the measurement with clinical glare disability. Since it measures backscattering and not forward scattering, readings do not always correlate with clinical findings.
For media pathology, how well does backscattered light correlate with front-scattered light? There is some evidence that for nuclear sclerotic cataracts the correlation is fairly good,49 but not for most other forms of media pathology,50 and this imposes an inherent limitation on various imaging methods used to quantify media pathology. Both slit-lamp and Scheimpflug photography combined with densitometry have been used to quantify cataract, but with limited success since both methods also rely on backscattered light.51
The poor correlation between back- and forward-scattered light limits the utility of BRDF measurements. BTDF measures forward scattering, but no means of performing BTDF measurements noninvasively currently exists. In Europe more so than in the United States, in recent years, attempts to use flicker to measure forward scattering are being developed.52
Although not intended to measure glare disability, it would be appropriate to mention the cell and flare meter at this point. The device exploits differences in scattering between macromolecules (flare) and cells to measure and quantify anterior chamber inflammation. Clinicians are fairly adept at rating cell and flare on a four- or five-point scale, but the cell and flare meter quantifies anterior chamber reaction on a continuous scale and is useful in studies of uveitis.53
Due to inherent limitations of bidirectional distribution measurements, clinical glare testing is usually done using some variation of the veiling glare test. The trick is to create test conditions closely simulating real situations, which is not easy since glare arises in many different ways. Aspects of glare testing that can be controlled include brightness and position of the glare source, nature of the test target, and test distance.
What should be the position of the glare source relative to the target? Most glare is caused by an isolated bright source (e.g., the headlights of oncoming traffic, the sun, streetlights, shiny reflecting objects). A glare test could utilize a single isolated source, but the direction of the source might be important since some patients are sensitive to glare from only one direction. A complete glare test would have to evaluate several different positions of the source, and that would be inconvenient. Also when a single source is used, patients sometimes mistakenly look directly into the source, bleaching the retina. Patients with macular disease, such as macular degeneration, may take a prolonged time to recover from photoreceptor bleaching, invalidating the glare test. Consequently, most glare tests utilize a central target completely surrounded by a glare source. One exception is the halometer discussed below. Finally, the glare source and target may be in the same plane (Miller-Nadler and Berkley tests) or different planes (BAT and Grolman tests).
What would be the appropriate brightness for the glare source? This is difficult to answer due to lack of normative data. Given a bright enough light, everyone suffers from glare. We all know that a young, healthy athlete can lose a baseball in the sun, but this is not due to pathology. At what illumination level do normal people of various ages experience glare and at what levels do people with pathology experience glare? We do not have enough data to answer these questions fully, which makes it difficult to choose appropriate illumination. However, daily experience provides useful guidelines. The background luminance of a clear sky is about 340 candelas per square meter (cd/m2), and some patients have difficulty discerning faces under such illumination. Other patients have difficulty reading merchandise labels in well-illuminated stores. With these situations as guidelines, glare tests can be designed to simulate common situations. Nevertheless, it is worth noting that choice of glare source luminance remains arbitrary. Most glare tests provide three different levels of glare illumination.
There is no point in precisely specifying glare source intensity unless the source is routinely calibrated. The illumination produced by incandescent lights depends on several factors. Halogen bulbs are brighter than nonhalogen bulbs due to higher operating temperatures. Aging is often overlooked, but light bulbs dim with use. Illumination is also voltage dependent, and variations in line current do occur, but more importantly voltage supplied by battery is highly variable, especially from nickel-cadmium rechargeable batteries, which change their voltage characteristics with repeated charging cycles. The reproducibility of a glare test is diminished by the fact that most clinical glare testing is done without calibrating the glare source.
The test conditions, including the patient’s state of dark adaptation, also have a significant affect on glare testing. Transient visibility loss due to an abrupt increase or decrease in light or glare level is proportional to the ratio of change in light level, not the absolute change. Consequently, the same patient tested with the same glare source will exhibit a greater glare disability when dark adapted than when light adapted.
To quantify the test, some form of resolution target is usually used as a test object, but here again there is some variability between tests. The Snellen chart is familiar to patients and readily available but has some disadvantages, such as fewer letters per line and larger steps between lines at lower acuities. The ETDRS chart was designed to address these issues, with the same number of optotypes on every line and equal acuity increments (in log MAR) between lines.54
Some letters (of the same size) are easier to identify than others. Clearly, acuity testing would be more accurate if all optotypes on a given line were equally difficult to identify, and there are two ways to achieve this. The Sloan letters are a ten-letter subset of the alphabet, and each Sloan letter is about equally difficult to identify.55 Many eye charts today, including the ETDRS, use only Sloan letters (C, D, H, K, N, O, R, S, V, Z), although many still do not. Notice that although B, E, L, and T are commonly found on eye charts, they are not among the Sloan letters. The other approach is to use the Landolt C optotype.
Some glare testers use the Snellen chart, others the ETDRS chart, and yet others the Landolt C. Sine wave gratings, discussed later, have also been used in glare testing, although this is not a common choice. Whatever the approach, the contrast of the test target is probably more important than the choice of chart. The effect of glare is to reduce retinal image contrast. A normal visual system can distinguish most objects with 10% or more contrast. Suppose, due to some media pathology, glare reduces retinal image contrast by about 10-fold. If the patient is tested with a high-contrast target (close to 100% contrast), the patient may still be able to read the chart in the presence of a glare source. By using a reduced contrast chart (about 10% contrast), glare testers can detect lower levels of glare disability. In most cases the patient reads the test target without the glare source, then with it. The difference in resolution is the glare disability index.
Test target brightness can be as important as glare source illumination, although in most glare testing not much attention is paid to it. When carefully controlled, target illumination is about 110 cd/m2. Rayleigh scattering is highly wavelength dependent, so one glare tester—the halometer—incorporates a target that can be illuminated with either red or green light.56 The halometer also uses a point glare source instead of a surround and measures the angular separation between a resolution target and the glare source necessary to produce glare symptoms. The approach is novel compared to other glare testers.
The brightness acuity test (BAT) has a battery-operated light that illuminates a white diffusing hemisphere and is shielded from directly illuminating the eye. The hemisphere is placed close to the patient, who sights a Snellen chart (or any other resolution target one wishes to use) through a small hole in the hemisphere. Acuity is measured with and without the glare source, which can be set at three different levels. The highest illumination setting is so bright that it overestimates glare disability even in many normal subjects.57 Results vary depending on the batteries, age of the light bulb, pupil size, etc. The BAT may be the least reproducible and least quantitative of all glare testers in common use. Nevertheless, it is a very easy instrument to use and probably the most popular clinical glare tester.
In the Berkley glare tester, an ETDRS chart reduced in size for a 1-m working distance is used.58 The chart is printed on opaque white material, and the optotypes are reduced in contrast (about 10%). The chart is front illuminated, and a back-illuminated glare source adjustable to three different levels surrounds the ETDRS chart. The patient reads the chart with and without the glare source, and the difference in acuity, if any, is the glare disability index. The Berkley tester is probably the best calibrated and most reproducible, but also somewhat inconvenient and not commercially available.
The Miller-Nadler glare tester is similar to the Berkley glare tester but uses Landolt C’s at high or reduced contrast.59 The Miller-Nadler device is much more convenient than the Berkley tester since it is self contained in a desktop projector/viewer unit. Calibration is accomplished by means of specially prepared slides. The Miller-Nadler tester is commercially available and is probably the best compromise between convenience and reproducibility.
Grolman (60) suggested incorporating a glare source into a phoropter.60 While doubtless convenient, it is not yet available commercially.
In summary, glare is a reduction in retinal image contrast caused by light scattering in the ocular media. Objective measurement of backscattered light is possible through various techniques but does not correlate well with the forward scattering that affects visual function. Most clinical glare testing is done by methods attempting to simulate real-world situations. A variety of glare testers have been described in the literature, and while they differ in particulars, most are variations on the same basic veiling glare test. Some newer tests using different paradigms such as flicker are in development, and some computer-based tests may eventually be available on the Internet.61
CONTRAST SENSITIVITY
Glare is a decrease in image contrast specifically caused by light scattering, but image contrast is also decreased by aberrations and diffraction. Even if the retinal image is normal, neurological pathology can alter the way the visual system processes contrast. Contrast sensitivity testing detects and quantifies contrast deficits unrelated to light scattering or glare. The contrast sensitivity function (CSF) is the psychophysical analog of the modulation transfer function, and both are based on the mathematical techniques of Fourier analysis that are used in a myriad of disciplines. To cite just one of innumerable examples, Watson and Crick’s discovery of DNA structure was based on previous work involving the Fourier transform of a helix.62
Fortunately, it is possible to develop an excellent intuitive grasp of the subject without mathematical formalism. For interested readers, Appendix A covers the mathematical basics, and Appendix B provides some biographical background.
FOURIER ANALYSIS
The reader has doubtless already encountered Fourier analysis probably without realizing it. It is common knowledge that sound is a mixture of frequencies or tones. The mathematical representation of a pure tone is a sine wave. Sine waves have many useful properties, one which is their simplicity. Only four parameters are necessary to completely describe a sine wave (Fig. 35-8), and we only need to be concerned with two: frequency and amplitude. Frequency corresponds to the pitch of a tone, and amplitude corresponds to the tone’s loudness or volume.
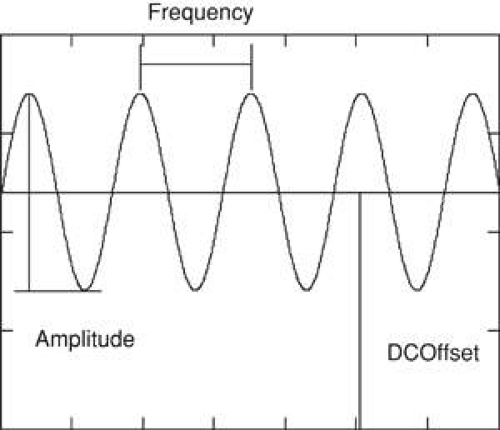 Fig. 35-8. Properties of a sine wave. Four parameters suffice to completely describe a sine wave. One of the parameters, phase, is not necessary for this discussion. The other parameters are illustrated. Sine waves are symmetric with respect to the horizontal axis lying as much below as above the axis. However, sometimes it is necessary to shift the sine wave vertically up or down. DC offset refers to the vertical shift of the sine wave. The term is borrowed from electrical engineering DC referring to direct current. |
When listening to music on the radio, an electronic signal vibrates the speakers, creating sound. Like the sound it produces, the electronic signal is a mixture of frequencies, but which frequencies and how loud is each individual frequency? It turns out that there is one and only one combination of frequencies for any waveform, and Fourier discovered a mathematical technique for determining not only the frequency content, but also the characteristics of each frequency (e.g., loudness, phase) in any signal. The process of mathematically breaking down a signal into its component frequencies is called, among other things, Fourier analysis or Fourier decomposition.
Fourier analysis is the mathematical equivalent of a prism. White light, like sound, is a mixture of frequencies that can be separated into its constituent frequencies by a prism. The prism performs by physical means the same thing Fourier analysis achieves mathematically, the breakdown of something into component frequencies, but what is gained by doing so? Sometimes merely knowing the frequency content is useful. By analyzing the spectrum of starlight, we can ascertain the star’s chemical composition.
Another advantage is that individual frequencies can be altered or manipulated, and then the altered frequencies can be recombined, producing a new signal, and this, in essence, is what the bass and treble controls do. The volume control changes the loudness of all frequencies in equal proportion, but the bass control selectively alters low frequencies, leaving high frequencies unchanged (Fig. 35-9). Why go to all the trouble of breaking down a signal into frequencies and then recombining them? Why not just alter the signal directly? Because it is very difficult to achieve the desired effects by working directly on the signal, working with frequencies greatly simplifies the task. An enormous number of problems in wide variety of disciplines can be solved using a three-step approach:
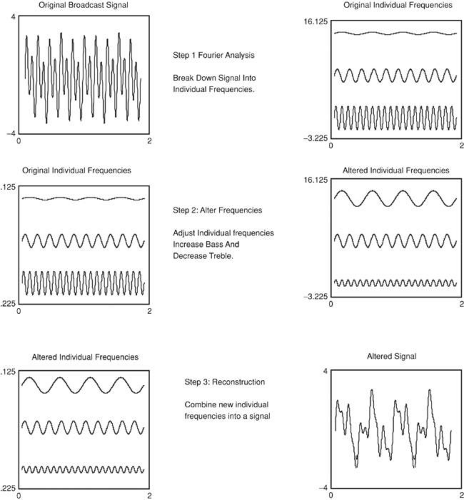 Fig. 35-9. The Fourier approach consists of three basic steps. In the first step a signal, in this case the electronic signal of a radio musical broadcast, is broken down into individual frequencies. In the second step the frequencies are altered using the bass and treble controls to increase the low frequencies and decrease the high frequencies. Note the midrange frequencies remain unchanged. In the third step the individual frequencies are recombined into a new signal. Note that it is not at all apparent simply by looking at the original and final signals that they are in fact closely related. The signals represent very similar sounds, except the final signal has louder bass tones. |
Step 1: The breakdown of a complex waveform, signal, or image into its component frequencies.
Step 2: Selective alteration of some frequencies. This step goes by various names such as spatial filtering, signal processing, etc. Strictly speaking this step is not part of Fourier analysis.
Step 3: The reconstruction of a new waveform, signal, or image from the altered frequencies. This step also goes by various names including inverse Fourier transformation, Fourier synthesis, reconstruction, etc.
SPATIAL FREQUENCY AND SPECTRUM
Acoustics utilizes temporal frequencies, a notion familiar to most readers. Temporal frequency describes how something (e.g., voltage, position, temperature, etc.) changes over time. Applying Fourier analysis to imaging involves the less familiar concept of spatial frequency (Fig. 35-10). A spatial frequency consists of alternating light and dark stripes or fringes. There is no sharp border between light and dark fringes, rather brightness changes gradually, in fact sinusoidally, which is why a spatial frequency is also called a sine wave grating (SWAG).
Stay updated, free articles. Join our Telegram channel

Full access? Get Clinical Tree


