Fundus Autofluorescence in Posterior Uveitis
Lucia Kuffová
Vikki McBain
John V. Forrester
Noemi Lois
Posterior segment intraocular inflammation (PSII, uveitis affecting the posterior segment of the eye) comes in many forms (1). These range from mild, chronic, low-grade intermediate uveitis affecting the peripheral retinal vessels with occasional inflammatory cells in the vitreous to acute, severe, sight-threatening ocular inflammation (STOI) with occlusive retinal vasculitis and/or optic disc swelling. In addition, STOI may occur because of the consequences of inflammation, particularly edema (macular or retinal edema with or without neurosensory retinal detachment) and neovascularization (retinal and choroidal with hemorrhage at either site).
Fundus imaging is of great value in the diagnosis and evaluation of patients with PSII. In particular, it may help in the assessment of STOI. However, since clear media are required for fundus imaging, there are limitations to the use of fundus imaging in PSII. In particular, patients with panuveitis and posterior synechiae with seclusio pupillae, or with dense vitreitis and vitreous hemorrhage are excluded from these investigations.
Despite these caveats, there are many cases of PSII and STOI that are amenable to and can benefit from good fundus imaging. Cystoid macular edema (CMO) and choroidal neovascularization (CNV) are two of the possible mechanisms by which STOI leads to registrable blindness. Moreover, many cases of chronic STOI escape detection because the clinical signs are not very obvious and the cause of the poor level of vision is not fully appreciated. As a result, patients lose sight unnecessarily.
There are many methods of fundus imaging: slit-lamp biomicroscopy, color and red-free fundus photography, fluorescein angiography (FA), indocyanine green angiography (ICGA), optical coherence tomography (OCT), and, most recently, fundus autofluorescence (AF) and near-infrared autofluorescence (NIA). Each of these imaging modalities has advantages and deficiencies for evaluating STOI; these will be reviewed in this chapter.
HISTOPATHOLOGY
In ocular inflammatory disease, one of the first events is the breakdown of the blood-retinal barrier (BRB). Experimentally, this is manifested by a reduction in shear flow in the large retinal vessels, occlusion of small capillaries, adhesion of leukocytes to the lining cells of the BRB, and extravasation of fluid and cells into the extravascular space. The extravascular space in the retina includes the retinal parenchyma and the subretinal space. In addition, the lining cells of the BRB include not only the retinal endothelium but also the RPE cells. Consequently, cells and fluid can accumulate on either side of the RPE and produce effects that have consequences for retinal imaging (Fig. 12.1).
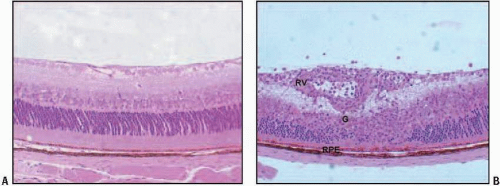 FIGURE 12.1. Experimental autoimmune uveoretinitis (EAU) in the mouse. (A) Normal retina. (B) EAU. Note the intense retinal vasculitis (RV), granuloma (G), and RPE swelling. Fluid and inflammatory cells accumulate on either side of the RPE, indicating breakdown of the BRB. |
CLINICAL FINDINGS AND IMAGING TECHNIQUES
Retinal edema (specifically macular edema, including CMO), inflammatory cell infiltration in choroid and retina, neovascu larization, and subretinal fibrosis occur in patients with PSII. The following imaging systems can be used to evaluate these changes:
Fluorescein Angiography and Indocyanine Green Angiography
In fluorescein angiography (FA) and indocyanine green angiography (ICGA), the most obvious effect of inflammation is leakage of dye from the vessels into the extracellular space. In the retina, any leakage of dye is a sign of abnormality because the retinal vessels are normally impermeable through tight junctions to protein-bound fluorescein. Choroidal vessels are normally leaky through physiological fenestrations; however, in inflammation, dye leakage can be increased, leading to intense fluorescence, whereas cellular extravasation into the normally paucicellular choroidal stroma can lead to blockage of the dye signal. Thus, on FA and ICGA, accumulation of inflammatory cells can interfere with the signal and produce hypofluorescence in early frames of the angiogram and hyperfluorescence in late frames, as dye accumulates around inflammatory lesions. Similarly, as the RPE layer becomes “leaky,” fluorescent dye will accumulate at this level in a “pericellular” distribution on FA (Fig. 12.2). Images of the macula and mid-peripheral retina can be obtained with FA and ICGA using conventional fundus cameras or wide-angle systems. This is important because inflammatory lesions can occur at any site in the posterior segment.
Macular edema, particularly CMO, is the most immediate direct cause of STOI in PSII. Detection and, more importantly, evaluation of macular edema in PSII clinically is highly subjective. Stereoscopic fundus photography is used to assess clinically significant macular edema in diabetic retinopathy, and similar methods are useful in PSII, but studies have shown a lack of correlation between observers, particularly regarding the degree of CMO (2,3). More objective and reproducible measures of macular edema can be obtained with FA (4, 5, 6). Macular edema can be demonstrated readily on
FA by increased fluorescence at the macula in the late phases of the angiogram. When CMO is present, a cystoid or petalloid appearance is seen. Although FA cannot directly provide quantitative information regarding the amount of edema present, computer software programs are available for that purpose (7,8).
FA by increased fluorescence at the macula in the late phases of the angiogram. When CMO is present, a cystoid or petalloid appearance is seen. Although FA cannot directly provide quantitative information regarding the amount of edema present, computer software programs are available for that purpose (7,8).
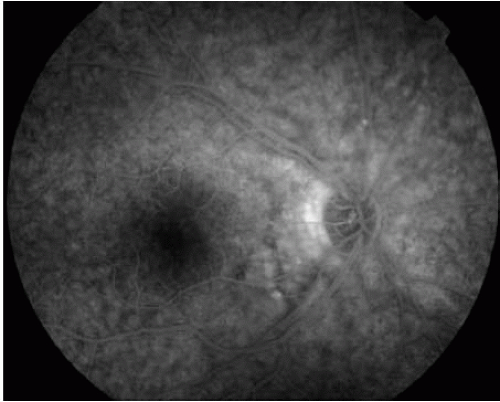 FIGURE 12.2. Late frame of an FA obtained from a patient with sympathetic ophthalmia (SO). Note the diffuse leakage from the RPE/choroid. |
FA is required and remains the gold standard for the evaluation of inflammatory CNV, a feature of several forms of PSII, including multifocal choroiditis, presumed ocular histoplasmosis syndrome (POHS), punctuate inner choroidopathy (PIC), birdshot choroidopathy, and infectious disease (e.g., at the edge of toxoplasma lesions). It is important to obtain accurate FA images because CNV is a major cause of visual loss in patients with these disorders. FA is necessary not only to confirm the presence of the CNV, but also to estimate its size, its location with respect to fixation, and the degree of activity of the lesion. This information is required when selecting an appropriate treatment. Similarly, FA can demonstrate areas of subretinal fibrosis with staining of dye at the site of fibrosis in late phases of the FA.
ICGA does not seem to be as useful as FA for evaluating CMO, CNV, or subretinal fibrosis.
Optical Coherence Tomography
OCT has undoubted value in the detection of retinal edema. This imaging technique allows the clinician to determine not only the presence or absence of increased retinal thickness due to macular edema, but also to evaluate quantitatively the amount of fluid present. Time-domain OCT imaging has been used for several years now in most clinics and provides a two-dimensional “cut” of the region of interest; however, it is difficult to assess the surface area of the edema without sampling several fields. The more recently developed Fourier-domain OCT method allows three-dimensional imaging of the macula and therefore computer-based quantification of the area of edema.
OCT is also an excellent imaging modality to reveal CMO; even small cystic structures can be detected in what is in effect an in vivo “section” of the retina. Antcliff and colleagues (9) reported a 96% sensitivity and 100% specificity for OCT in detecting CME in patients with uveitis when compared with FA. However, false positives can occur when this imaging technique is used (e.g., in cases of foveal retinoschisis, Goldmann-Favre, and enhanced S-cone syndrome), and should be
taken into account during interpretation of the images. Tran et al. (3) recently demonstrated the value of OCT as well, and indicated a poor visual prognosis for diffuse macular edema compared to a better prognosis in cases of serous retinal detachment as seen on OCT.
taken into account during interpretation of the images. Tran et al. (3) recently demonstrated the value of OCT as well, and indicated a poor visual prognosis for diffuse macular edema compared to a better prognosis in cases of serous retinal detachment as seen on OCT.
Active chorioretinal lesions occurring as a result of infil tration of inflammatory cells, particularly the small round lesions observed in many forms of PSII (e.g., Dalen-Fuchs nodules in sympathetic ophthalmia, and granulomas in sarcoidosis), are well demonstrated on FA and ICGA (see above) but are difficult to see by OCT; therefore, OCT is not usually applied to specifically evaluate these lesions.
OCT has been proposed in recent years as a useful method to evaluate patients with CNV and to monitor the need for treatment in patients with exudative age-related macular degeneration (AMD; see Chapter 10B). The value of OCT as a diagnostic tool for inflammatory CNV has not been elucidated to date, and it remains unclear in which proportion of patients OCT may fail to demonstrate activity of the CNV when present. This may be particularly relevant for cases of inflammatory CNV, where a minimal amount of subretinal or intraretinal fluid is often detected in the presence of active neovascularization. Furthermore, data from studies in noninflammatory CNV have shown a weak correlation between OCT parameters and visual function (10).
Increased reflectivity at the site of subretinal fibrosis can be easily demonstrated in OCT images, although its extent may not be adequately shown by this method. Furthermore, findings may not be specific (e.g., accumulation of material in the subretinal space may elicit a similar signal).
Although OCT provides an excellent evaluation of the macular area, it does not allow an adequate visualization of mid-peripheral retinal changes, which are often observed in patients with PSII.
Fundus Autofluorescence
It is believed that the majority of the AF signal derives from lipofuscin and other fluorophores in the RPE; this signal increases with age (see Chapter 3). Experimental studies have demonstrated, however, that part of the AF signal may also arise from lipofuscin-rich microglia and macrophages (11). These also increase with age (12) but may present as a sudden entrant into a site of inflammation, producing a “recent onset” increased AF signal (see Chapter 4). Therefore, changes in the distribution of AF in a patient with macular edema may also reflect the accumulation of cellular and fluid components of inflammation.
Changes in the normal RPE AF signal might also be expected in PSII. It is well recognized, both clinically and experimentally, that the RPE is the site of marked inflammation in PSII (Fig. 12.1). In this process, melanin is lost and lipofuscin and/or autofluorescent material may appear in both the RPE cells and associated macrophages (13, 14, 15, 16, 17). However, the RPE is also a major target for attack because it contains many autoantigens (18, 19, 20, 21) and engulfs organisms, such as viruses, through specific receptors (22, 23, 24, 25, 26), and it may be directly damaged and destroyed. The end-stage of many clinical uveitic conditions is severe RPE atrophy, which may be diffuse and mottled (as in birdshot choroidopathy) (Fig. 12.3) or extend to large patches of RPE and choroidal atrophy (as in toxoplasmosis or serpiginous chorioretinopathy) (Fig. 12.4). Alternatively, there may be considerable subretinal fibrosis (Fig. 12.5). Thus, the consequences for the AF signal may vary significantly depending on the stage and level of activity of the disease.
Stay updated, free articles. Join our Telegram channel

Full access? Get Clinical Tree


