Purpose
To determine the frequency of discordant gene expression profile (GEP) classification of posterior uveal melanomas sampled at 2 tumor sites by fine-needle aspiration biopsy (FNAB).
Design
Prospective single-institution longitudinal study performed in conjunction with a multicenter validation study of the prognostic value of GEP class of posterior uveal melanoma cells for metastasis and metastatic death.
Methods
FNAB aspirates of 80 clinically diagnosed primary choroidal and ciliochoroidal melanomas were obtained from 2 tumor sites prior to or at the time of initial ocular tumor treatment and submitted for independent GEP testing and classification. Frequency of discordant GEP classification of these specimens was determined.
Results
Using the support vector machine learning algorithm favored by the developer of the GEP test employed in this study, 9 of the 80 cases (11.3% [95% confidence interval: 9.0%–13.6%]) were clearly discordant. If cases with a failed classification at 1 site or a low confidence class assignment by the support vector machine algorithm at 1 or both sites are also regarded as discordant, then this frequency rises to 13 of the 80 cases (16.3% [95% confidence interval: 13.0%–19.6%]).
Conclusion
Sampling of a clinically diagnosed posterior uveal melanoma at a single site for prognostic GEP testing is associated with a substantial probability of misclassification. Two-site sampling of such tumors with independent GEP testing of each specimen may be advisable to lessen the probability of underestimating an individual patient’s prognostic risk of metastasis and metastatic death.
Gene expression profiling (GEP) is a transcriptional method of cellular analysis that has been applied to human uveal melanomas for the purpose of prognostic classification. The prognostic value of a standardized 15-gene assay developed by Harbour and associates has been validated in a multicenter clinical trial. Patients having a primary uveal melanoma categorized by this standardized assay as GEP (gene expression profile) class 2 experienced a substantially higher rate of postbiopsy metastasis than did patients whose tumor was categorized as GEP class 1. Most of the tumor specimens evaluated in the multicenter validation trial were cellular aspirates obtained by fine-needle aspiration biopsy (FNAB) at the time of or shortly prior to initial tumor treatment. In almost all of these cases, a single tumor site was sampled by FNAB for gene expression profile testing and classification and was assumed to be representative of the tumor as a whole. But as recent publications have shown in other tumors, intratumor genetic heterogeneity has been documented in a range of tumor types, affecting clinically relevant parameters such as gene expression signatures that reflect prognosis, and response to therapeutic agents. Recently, researchers showed that many patients with glioblastomas displayed multiple transcriptomic subtypes within different biopsies from the same tumor. Although the heterogeneous distribution of chromosome 3 in uveal melanomas has been reported, limited information is available on the frequency of discordant GEP class assignments to paired tumor cell specimens obtained by FNAB from slightly different sites within clinically diagnosed primary uveal melanomas.
The principal purpose of this study was to determine the frequency of discordant GEP class assignment of tumor cells obtained from 2 adjacent tumor sites within clinically diagnosed primary posterior uveal melanomas by FNAB performed prior to or at the time of initial tumor treatment. Secondary purposes were to determine the relationships between discordant GEP class assignment and other evaluated clinical and pathologic variables and to determine the actuarial rates of uveal melanoma metastasis and metastatic death in patients with discordant GEP results at the 2 sampled tumor sites.
Patients and Methods
Our study was conducted as an Institutional Review Board-approved interinstitutional prospective longitudinal clinical and laboratory study of GEP testing of FNAB-obtained specimens of primary posterior uveal (choroidal or ciliochoroidal) melanomas ( ClinicalTrials.gov Identifier: NCT00406120). This study was approved and monitored by the University of Cincinnati Institutional Review Board. Informed consent was obtained from each patient and the study adhered to the tenets of the Declaration of Helsinki. All work using patient information was performed in compliance with the Health Insurance Portability and Accountability Act.
Patients with a clinically diagnosed primary choroidal or ciliochoroidal melanoma evaluated in the Oncology Service of the University of Cincinnati Medical Center who consented to participate in this study underwent investigational FNAB of their intraocular tumor prior to or at the time of planned initial treatment of that tumor. Patient and tumor variables determined at each patient’s prebiopsy clinical examination included patient age; largest basal diameter of the intraocular tumor (estimated by indirect ophthalmoscopy with fundus mapping and ocular transillumination [when appropriate]), in millimeters to the nearest 0.5 mm; maximal thickness of the tumor (by A-scan ultrasonographic biometry), in millimeters to the nearest 0.1 mm; and intraocular tumor location (exclusively choroidal vs involving the ciliary body).
Procurement of Tumor Specimens by Fine-Needle Aspiration Biopsy
All tumor biopsies were performed by 1 of the authors (J.J.A., Z.M.C.). The instrumentation and techniques employed by the authors have been reported previously. At least 3 and usually 4 tumor sites within each tumor were sampled. These sites were selected on the basis of tumor thickness, intraocular tumor location, and clinical features of the tumor. Special caution was taken to sample comparable areas of the tumor for cytology and GEP. A separate biopsy needle (25 gauge) was used to sample each tumor site. Two of the aspirates (usually the second and fourth aspirates) were suspended immediately in a vial containing tissue culture medium, snap-frozen in a styrofoam box containing dry ice, and delivered via overnight courier service to the Harbour laboratory in the Department of Ophthalmology and Vision Science of Washington University, St Louis, Missouri, for subsequent GEP testing. The specimens were kept frozen until the day of analysis.
Gene Expression Profile Testing and Classification
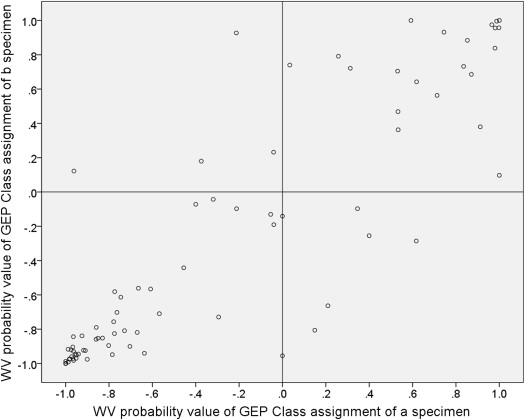
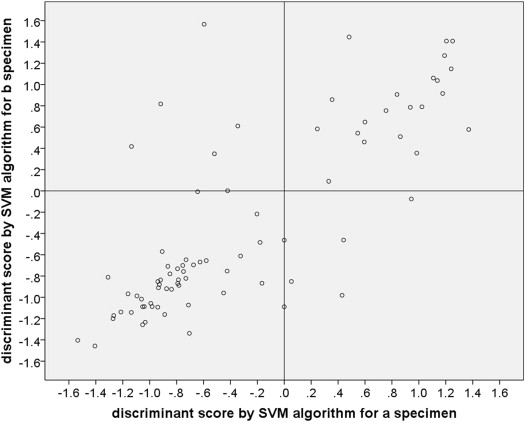
The methods of preparation of RNA samples, testing of samples by real-time polymerase chain reaction (PCR), and analysis of gene expression data for prognostic classification have been reported previously. In short, the RNA from each specimen was analyzed by microarray technology, and a typical heat map of upregulation and downregulation of key discriminating genes was generated. Two different machine learning algorithms (the weighted voting [WV] algorithm and the support vector machine [SVM] algorithm ) that had been calibrated against 30 uveal melanomas of known prognostic category were used to translate the heat map results for each individual specimen into a prognostic GEP class (GEP class 1 [low risk of future emergence of distant metastasis] or GEP class 2 [relatively high risk of short-term emergence of distant metastasis]) in the Harbour laboratory. Each GEP class assignment by the weighted voting algorithm was associated with a probability value between −1.0 (strong probability of GEP class 1) and +1.0 (strong probability of GEP class 2), and each GEP class assignment by the support vector machine algorithm was associated with a discriminant function score that ranged from −1.53 (strong probability of GEP class 1) to +1.57 (strong probability of GEP class 2) in this series of cases. The gene chips employed in this test contained 12 classifying genes (CDH1, ECM1, EIF1B, FXR1, HTR2B, ID2, LMCD1, LTA4H, MTUS1, RAB31, ROBO1, and SATB1) and 3 control genes (MRPS21, RBM23, and SAP130). Control genes were consistently expressed in all cases but not differentially upregulated or downregulated in class 1 vs class 2 cases. GEP classification is determined by the combined expression of these genes. An individual gene was considered undetectable if its amplification product did not reach the expression threshold after 40 cycles of quantitative PCR, and a sample was considered a technical failure if 1 or more control genes or at least 3 of the 12 discriminating genes were undetectable. Failed aspirates were categorized as GEP class 0 with an associated weighted voting probability value of 0.0 and a support vector machine discriminant score of 0.0 for the purposes of this study.
Cytopathologic Analysis and Classification
The remaining aspirates were flushed into a transport syringe containing a 50:50 mixture of balanced salt solution and absolute alcohol and submitted via courier to the pathology laboratory of the Cincinnati Children’s Hospital Medical Center for cytopathologic processing, analysis, and classification as previously published by our group. The pathologist assigned to the case issued an official report that included the cytopathologic category of the cells in the aspirate. Immunocytochemistry was performed on specific cases that yielded nonpigmented cells and those with cytologic features considered borderline. HMB-45 was successfully used to confirm the melanocytic nature of the biopsied tumor in these situations. No attempt was made to retrieve the cytopathology slides and reclassify the specimens prospectively in this study.
Assessment of Concordance vs Discordance of Gene Expression Profile Classification of Paired Aspirates
Agreement between the GEP class assignment of the tumor cells obtained from the first site sampled for GEP testing (designated the “a specimen”) and the second site sampled for GEP testing (designated the “b specimen”) was evaluated both graphically (in the form of scatter plots of weight voting probability values and support vector machine discriminant function scores on the “a” specimens [x-axis] vs the “b” specimens [y-axis]) and in side-to-side tabular comparisons for both the weight voting and support vector machine assignments. A concordant result was defined as a GEP class assignment of the same sign for the tumor cells obtained from each of the 2 evaluated tumor sites. A discordant result was defined as a GEP class assignment of different sign for the tumor cells obtained from the 2 sites or a failed GEP test (assigned the value of 0.0) for the tumor cells obtained from 1 but not both tumor sites.
Evaluation of Associations Between Baseline Study Variables and Discordant Gene Expression Profile Class
Associations between categorical baseline patient and tumor variables and concordance vs discordance of GEP class assignment to the tumor aspirates obtained from 2 tumor sites were evaluated by cross-table analysis. Strength of associations determined by this analysis were assessed using the χ 2 test.
Evaluation of Actuarial Rates of Metastasis and Metastatic Death in Study Patients by Gene Expression Profile Category
The Kaplan-Meier product limit method of actuarial survival analysis was used to compute cumulative probabilities of uveal melanoma metastasis and metastatic death in patients with concordant vs discordant GEP results. The principal reason for this analysis was to determine whether patients with discordant GEP class at the 2 sites had a survival experience more like that of concordant class 2 patients or concordant class 1 patients, or intermediate between the 2 concordant class patients.
Results
Study Patients and Tumors
We identified 80 patients who had a clinically diagnosed primary posterior uveal melanoma that was sampled by FNAB at 3 or more tumor sites and whose aspirates from 2 of these sites were submitted for GEP testing and classification during the years 2007–2009. The baseline characteristics of the patients and their tumors are summarized in Table 1 . The patients ranged in age at the time of FNAB from 17.6 years to 86.9 years (mean age = 62.1 years, standard deviation = 14.7 years). Their tumors ranged in largest basal diameter (LBD) from 6.0 mm to 22.0 mm (mean LBD = 12.3 mm, standard deviation = 3.3 mm) and in thickness from 1.8 mm to 14.5 mm (mean thickness = 5.8 mm, standard deviation = 2.7 mm). Cytopathologically, over half of the tumors (44 of 80 cases, 55.0%) were classified as containing epithelioid melanoma cells. However, an insufficiently cellular aspirate for cytopathologic classification was observed in 15 of the 80 cases (18.8%). In spite of this latter result, none of the tumors in this series yielded an insufficient aspirate for GEP classification in both of the 2 sampled sites. GEP testing did fail, however, in 1 of the 2 aspirates in 2 of the 80 cases (2 of 160 aspirates, 1.25%).
| Variable | Number (%) |
|---|---|
| Age (y) at time of FNAB | |
| Younger (≤50) | 12 (15.0) |
| Intermediate (>50 but ≤70) | 43 (53.8) |
| Older (>70) | 25 (31.3) |
| Largest basal diameter (mm) of intraocular tumor | |
| Small (≤10) | 28 (35.0) |
| Medium (>10 but ≤15) | 38 (47.5) |
| Large (>15) | 14 (17.5) |
| Maximal thickness (mm) of intraocular tumor | |
| Thinner (≤3.5) | 21 (26.3) |
| Intermediate (>3.5 but ≤7) | 36 (45.0) |
| Thicker (>7) | 23 (28.8) |
| Intraocular location category of tumor | |
| Exclusively choroidal | 59 (73.8) |
| Involving ciliary body | 21 (26.3) |
FNAB for procurement of tumor cells in this series was performed at the time of radioactive I-125 plaque implantation in 53 cases, immediately post enucleation in 15 patients, as a separate procedure for pathologic diagnosis prior to any treatment in 10 cases, and immediately following transscleral en bloc tumor resection in 2 patients. Initial patient management consisted of I-125 plaque radiotherapy in 55 patients, primary enucleation in 20 patients, proton beam irradiation in 2 patients, stereotactic radiation therapy in 1 patient, and observation without treatment in 2 patients. One of the 2 patients managed by observation had an insufficiently cellular aspirate for cytopathologic classification but was categorized as class 1 by GEP testing. The other patient managed by observation had a tumor classified as benign uveal nevus by cytopathologic analysis and was also categorized as class 1 by GEP testing.
Cytopathological Classification of Aspirates
Table 2 summarizes the cytopathologic classification of the tumor aspirates by the pathologists who analyzed the specimens. Note that 15 of the 80 aspirates (18.8%) submitted for cytopathologic analyses were judged to be insufficiency cellular to be classified pathologically. Note also that the pathologists classified 6 tumors (7.5%) as “malignant uveal melanoma,” but did not specify a cell type, and classified 4 tumors (5.0%) as “borderline” between benign uveal nevus and malignant melanoma.
| Cytopathologic Classification of Aspirated Tumor Cells | Number (%) |
|---|---|
| Insufficiently cellular specimen for classification | 15 (18.8) |
| Melanocytic uveal nevus | 1 (1.3) |
| Borderline melanocytic uveal tumor | 4 (5.0) |
| Uveal melanoma – spindle cell type | 16 (20.0) |
| Uveal melanoma – unspecified cell type | 6 (7.5) |
| Uveal melanoma – mixed cell type | 20 (25.0) |
| Uveal melanoma – epithelioid & necrotic | 18 (22.5) |
Gene Expression Profile Class Assignment and Failed Tests
Using the weighted voting algorithm on the “a” (first site sampled) aspirates, 53 of the 80 evaluated tumors (66.3%) were categorized as GEP class 1, 25 (31.3%) were categorized as GEP class 2, and 2 (2.5%) were categorized as failed GEP tests. Using the weighted voting algorithm on the “b” (second site sampled) aspirates, 53 of the tumors were again categorized as GEP class 1 while the remaining 27 tumors (33.8%) were categorized as GEP class 2. Using the support vector machine algorithm (the machine learning algorithm favored by the developer of the GEP test we used and employed by the company that now offers this test commercially) on the “a” specimen, 52 of the 80 tumors (65.0%) were categorized as GEP class 1, 26 (32.5%) were categorized as GEP class 2, and 2 were categorized as failed GEP tests. Using the support vector machine algorithm on the “b” aspirates, 55 of the tumors (68.8%) were categorized as GEP class 1 while the remaining 25 (31.3%) were classified as GEP class 2.
Frequency of Concordant and Discordant Gene Expression Profile Class Assignments of Paired Tumor Aspirates
Figure 1 is a scatter plot of the weighted voting algorithm in probability values associated with the GEP class assignments on “a” vs. “b” aspirated. Figure 2 is a corresponding scatter plot of the support vector machine algorithm discriminant function scores associated with the GEP class assignments on the 2 aspirates. In each of these figures, cases with a concordant GEP class assignment appear in the lower left and upper right quadrants while discordant cases appear in the upper left and lower right quadrants. Each scatter plot shows 48 cases (60.0%) categorized as concordant GEP class 1 and 21 cases (26.3%) categorized as concordant GEP class 2. Each scatter plot shows 9 of the 80 cases (11.3% [95% confidence interval of proportion: 9.0%–13.6%]) as discordant. In each of the scatter plots, 4 of the discordant cases were categorized as class 1 on the “a” aspirate and class 2 on the “b” aspirate (upper left quadrant of the figure) and 5 were categorized as class 2 on the “a” aspirate and class 1 on the “b” aspirate. In addition, the plotted location of the paired GEP class assignments fell on the vertical line through the 0.0 value of the x-axis (ie, was associated with a failed GEP test on the “a” specimen or an extremely low confidence value of the classification for 1 of the specimens) for 2 cases on the weighted voting scatter plot and 4 cases on the support vector machine scatter plot. Interestingly, 2 cases were classified as discordant by 1 of the algorithms and concordant by the other algorithm (1 discordant by each of the 2 algorithms).
Stay updated, free articles. Join our Telegram channel

Full access? Get Clinical Tree


