Purpose
To investigate the differences in the optical density ratios between chronic central serous chorioretinopathy (CSC) and polypoidal choroidal vasculopathy (PCV) obtained from subretinal fluid (SRF) analyses to identify the diagnostic role of optical density ratios.
Design
Retrospective cohort study.
Methods
Patients with acute CSC (n = 36), chronic CSC (n = 38), and PCV (n = 32) were included in the study. Spectral-domain optical coherence tomography (SD OCT) images of SRF were analyzed. The optical density measurements were obtained by using ImageJ. The optical density ratios were calculated from the SRF to the vitreous, retinal pigment epithelium (RPE), and retinal nerve fiber layer (RNFL) reflectivity ratios.
Results
Optical density ratios of SRF to the vitreous, RPE, and RNFL were significantly higher in patients with PCV than in those with chronic CSC ( P = .002, P = .001, P = .001). There was no significant difference between acute and chronic CSC ( P = .358, P = .433, P = .774). RPE reflectivity was significantly different between groups ( P = .002) but no significant difference in vitreous and RNFL reflectivity were detected between groups ( P = .172, P = .171).
Conclusions
The optical density ratio differs significantly between chronic CSC and PCV, but not between chronic and acute CSC. This suggests the usefulness of this parameter in differentiating between chronic CSC resembling PCV and PCV itself.
Central serous chorioretinopathy (CSC) is characterized by serous retinal detachment (RD) in the macula, often with small serous pigment epithelial detachments and retinal pigment epithelium atrophy. Focal dye leakage at the level of the retinal pigment epithelium (RPE) is seen on fluorescein angiography (FA), suggesting changes within the RPE pump, and indocyanine green angiography (ICGA) shows multifocal islands of inner choroidal staining, suggesting that exudative changes within the inner choroid cause CSC.
Polypoidal choroidal vasculopathy (PCV) is characterized by multiple terminal reddish-orange nodules and a complex network of vessels in the eye and often causes serous retinal detachment or pigment epithelial detachments (PEDs). PCV originates in an abnormality of the inner choroidal vessels and is presumed to be a variant of choroidal neovascularization (CNV).
Generally, the clinical diagnosis of CSC or PCV poses little challenge to the experienced retinal specialist. However, some recurrent and chronic cases of chronic CSC have clinical, angiographic, and tomographic findings similar to those of PCV, and it is difficult to differentiate these cases from those of PCV. Both CSC and PCV are associated with subretinal fluid (SRF), which has been studied with optical coherence tomography (OCT). Additionally, CSC and PCV share a common mechanism of pathogenesis. Choroidal hyperpermeability, which plays an important role in the pathogenesis of CSC, might be involved in the pathogenesis of PCV. The difference is that most CSC patients have good visual acuity (VA) despite macular detachment, whereas many PCV patients have decreased VA. The changes in the retinal morphology that lead to these different visual outcomes have not been documented.
Because OCT images are constructed from light reflectivity profiles of the vitreous and retina, one of the important parameters measured by OCT is the optical density. We speculated that an analysis of the optical density ratio would differentiate between chronic CSC and PCV and provide clues to the diagnosis of chronic CSC that resembles PCV. Therefore, we investigated the reflectivity of the SRF compartment expressed as optical density ratio between the SRF and the overlying vitreous and retinal nerve fiber layer (RNFL) and RPE above and below the SRF. The optical density ratios were compared in patients with CSC and PCV.
Methods
Patients
Following approval from the Institutional Review Board at Seoul St. Mary’s Hospital, we retrospectively reviewed 36 eyes of acute CSC, 38 eyes of chronic CSC, and 32 eyes of PCV patients that were examined at the Seoul St. Mary’s Hospital between October 1, 2009 and June 30, 2013. All of the patients included in this study had undergone comprehensive ophthalmic examinations including a best-corrected VA (BCVA), intraocular pressure (IOP), and assessment using slit-lamp biomicroscopy with a contact lens, fundus photography, FA, ICGA (HRA2; Heidelberg Engineering, Heidelberg, Germany), and a spectral-domain OCT (SD OCT) examination (Heidelberg Spectralis; Heidelberg Engineering Co, Heidelberg, Germany).
CSC was diagnosed based on the presence of a serous detachment of the neurosensory retina involving the macula that was confirmed by SD OCT, leakage at the level of the RPE on FA, and choroidal hyperpermeability on ICGA. Among the CSC eyes, those with symptoms presenting for at least 6 months or with an indication of serous macular elevation associated with RPE atrophic areas and subtle leaks or ill-defined staining on FA were defined as chronic CSC. PCV was diagnosed with reddish-orange nodules observed by an ophthalmoscopic examination corresponding to the polypoidal lesion seen by ICGA, which shows a branching vascular network terminating in either a single polyp or a cluster of multiple polyps. Posterior vitreous detachment (PVD) and vitreous syneresis were determined with slit-lamp biomicroscopic findings and SD OCT.
The exclusion criteria included a coexisting ophthalmic pathology, ophthalmic treatment such as previous laser therapy, photodynamic therapy or intravitreal injection, surgery including cataract and vitreous surgery before the earliest available OCT scan, and any pathology that might affect the optical density ratio results. In addition, the patients who had steroid-induced CSC, organ transplant–associated CSC, and other secondary CSC were also excluded.
Optical Coherence Tomography Scans
The patient’s earliest OCT exhibiting SRF was chosen for subsequent analysis. SD OCT imaging was performed with the Spectralis OCT according to the manufacturer’s guidelines using linear and volume scanning. The central macular thickness (CMT) was defined as the distance between the internal limiting membrane and the Bruch membrane using the computer-based caliper measurement tool in the Spectralis OCT system, and the macular volume (MV) was calculated automatically. The OCT scans were exported from the OCT acquisition software as grayscale, compression-free, quality-preserving JPEG images. The image quality and acquisition mode (HR/HS) were recorded.
Optical Density Ratio Measurements
The optical density measurements were obtained using ImageJ and used the entire region selection methods of Neudorfer and associates. The entire SRF, excluding granulation in the SRF, and the entire vitreous area on the same vertical line were selected for the set measurement of the optical density. The optical densities were extracted from the measured gray level intensity of the corresponding region on a scale of 0 (pure black) to 255 (pure white). The selected areas were measured in pixels. The reflectivity ratios were calculated from the measured optical densities ( Figure 1 , Left).
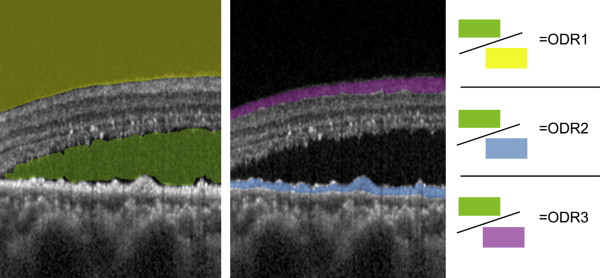
In addition to the measurement of optical density ratio of SRF to vitreous described above, we attempted to overcome the drawback of using only dark medium for normalization by testing 2 baseline bright media—the RPE and the RNFL, both through region-of-interest optical density measurements. Regions of interest of RPE or RNFL were chosen for optical density measurement and the reflectivity ratio was calculated with the optical density of the entire SRF ( Figure 1 , Middle).
Statistical Analysis
The statistical analysis was performed using commercial software (SPSS for Windows, ver. 19.0.1; SPSS Inc, Chicago, Illinois, USA). P < .05 was considered statistically significant. χ 2 test was used for categorical analysis of background factors. Two-tailed t tests and analysis of variance (ANOVA) test were used to identify differences in the clinical and morphometric data between each of the patient groups. Pearson tests were used to identify correlations between baseline factors and morphometric data.
Results
The study population of 106 patients consisted of 71 male and 35 female patients, with a mean age of 54.14 ± 13.72 years. Of the patients, 36 were diagnosed with acute CSC, 38 with chronic CSC, and 32 with PCV. Table 1 demonstrates the comparisons of background factors between the patient groups according to diagnosis. Underlying general conditions such as diabetes, hypertension, and hyperlipidemia did not differ between groups. In terms of vitreous status, the percentage of eyes with PVD was higher in the PCV group but no statistical significance had been reached ( P = .164). There was no difference in the percentage of eyes with syneresis and high myopia between groups ( P = .984, P = .138). None of the cases included in this study had vitreomacular traction.
| Acute CSC (n = 36) | Chronic CSC (n = 38) | PCV (n = 32) | P Value | |
|---|---|---|---|---|
| Male sex, n (%) | 23 (63.89) | 27 (71.05) | 21 (65.63) | .792 |
| Age (y ± SD) | 44.97 ± 9.56 | 50.18 ± 10.71 | 69.16 ± 6.90 | .001 |
| Systemic conditions | ||||
| Diabetes, n (%) | 3 (5.56) | 4 (10.52) | 5 (15.63) | .627 |
| Hypertension, n (%) | 8 (21.05) | 10 (26.32) | 14 (43.75) | .126 |
| Hyperlipidemia, n (%) | 0 (0.00) | 1 (2.63) | 2 (6.25) | .299 |
| Vitreous status | ||||
| PVD, n (%) | 8 (22.22) | 12 (31.58) | 14 (43.75) | .164 |
| Syneresis, n (%) | 2 (5.56) | 2 (5.26) | 2 (6.25) | .984 |
| High myopia, n (%) | 2 (5.56) | 0 (0.00) | 0 (0.00) | .138 |
The mean follow-up period for all the patients was 241.41 ± 417.88 days; follow-up was 54.86 ± 34.86 days for acute CSC, 492.96 ± 658.48 days for chronic CSC, and 238.36 ± 195.24 days for PCV. The mean age was older in PCV and the follow-up period was the longest in chronic CSC ( P = .001). No significant differences were found in the BCVA at baseline and in the central macular volume ( P = .191, P = .220). The PCV group showed the thickest central macula at the time of the optical density measurement ( P = .001). The BCVA at the last follow-up was the worst in the PCV group ( P = .001). The sample means and standard deviations for the clinical and morphologic variables are summarized in Table 2 .
| Acute CSC (n = 36) | Chronic CSC (n = 38) | PCV (n = 32) | P Value a | P Value b | P Value c | P Value d | |
|---|---|---|---|---|---|---|---|
| Follow-up period (d) | |||||||
| Mean ± SD | 54.86 ± 34.86 | 492.96 ± 658.48 | 238.36 ± 195.24 | .001 | .001 | .069 | .966 |
| Range | 12–143 | 246–3541 | 28–564 | ||||
| Baseline BCVA (logMAR) | |||||||
| Mean ± SD | 0.161 ± 0.16 | 0.211 ± 0.23 | 0.21 ± 0.15 | .191 | .288 | .47 | .145 |
| Range | 0.2–1.0 | 0.1–0.7 | 0–0.6 | ||||
| Central macular thickness (μm) | |||||||
| Mean ± SD | 403.82 ± 136.48 | 419.64 ± 115.75 | 480.5 ± 162.66 | .001 | .441 | .078 | .04 |
| Range | 235–787 | 244–752 | 245–894 | ||||
| Central macular volume (mm 3 ) | |||||||
| Mean ± SD | 9.12 ± 1.37 | 9.07 ± 1.71 | 8.53 ± 1.98 | .22 | .764 | .24 | .128 |
| Range | 6–13.2 | 6.1–13.4 | 5.2–15.0 | ||||
| BCVA at last follow-up (logMAR) | |||||||
| Mean ± SD | 0.083 ± 0.13 | 0.22 ± 0.24 | 0.73 ± 0.75 | .313 | .004 | .001 | .001 |
| Range | 0–0.5 | 0–0.7 | 0–2.8 |
a One-way analysis of variance among acute and chronic CSC and PCV.
b Two-tailed t test between acute vs chronic CSC.
c Two-tailed t test between chronic CSC vs PCV.
The ANOVA test of the optical density among the groups revealed a significant difference between the CSC and PCV groups. The optical density of the SRF was higher in the PCV than in the chronic CSC group ( P = .001), but no statistically significant difference was found between the acute and chronic CSC groups ( P = .521). The optical density of the vitreous, RNFL, and signal strength were comparable ( P = .172, P = .171, P = .216), even though the mean age was significantly different between both groups. The optical density of the RPE was higher in the PCV than in the acute or chronic CSC group ( P = .002). All 3 optical density ratios were significantly higher in the PCV group ( P = .001, P = .001, P = .001), whereas no significant differences were found between acute and chronic CSC patients. Other measurements associated with the optical density are summarized in Table 3 . A clear line of demarcation exists between the CSC and PCV groups in Figure 2 , with the 95% confidence intervals shown for each group.


