Purpose
To extend the capabilities of the Cone Location and Magnitude Index algorithm to include a combination of topographic information from the anterior and posterior corneal surfaces and corneal thickness measurements to further improve our ability to correctly identify keratoconus using this new index: ConeLocationMagnitudeIndex_X.
Design
Retrospective case-control study.
Methods
Three independent data sets were analyzed: 1 development and 2 validation. The AnteriorCornealPower index was calculated to stratify the keratoconus data from mild to severe. The ConeLocationMagnitudeIndex algorithm was applied to all tomography data collected using a dual Scheimpflug-Placido-based tomographer. The ConeLocationMagnitudeIndex_X formula, resulting from analysis of the Development set, was used to determine the logistic regression model that best separates keratoconus from normal and was applied to all data sets to calculate PercentProbabilityKeratoconus_X. The sensitivity/specificity of PercentProbabilityKeratoconus_X was compared with the original PercentProbabilityKeratoconus, which only uses anterior axial data.
Results
The AnteriorCornealPower severity distribution for the combined data sets are 136 mild, 12 moderate, and 7 severe. The logistic regression model generated for ConeLocationMagnitudeIndex_X produces complete separation for the Development set. Validation Set 1 has 1 false-negative and Validation Set 2 has 1 false-positive. The overall sensitivity/specificity results for the logistic model produced using the ConeLocationMagnitudeIndex_X algorithm are 99.4% and 99.6%, respectively. The overall sensitivity/specificity results for using the original ConeLocationMagnitudeIndex algorithm are 89.2% and 98.8%, respectively.
Conclusions
ConeLocationMagnitudeIndex_X provides a robust index that can detect the presence or absence of a keratoconic pattern in corneal tomography maps with improved sensitivity/specificity from the original anterior surface–only ConeLocationMagnitudeIndex algorithm.
Keratoconus is a structural degeneration of the cornea characterized by progressive thinning and conical deformation of this collagenous tissue. Although clinical presentations may vary, keratoconus is often identified by a focal region of increased anterior corneal curvature inferiorly, along with corneal thinning and other associated biomicroscopic signs. The resulting pattern of morphologic distortion of the anterior corneal curvature is the basis for numerous systems for detecting abnormalities of corneal shape associated with keratoconus. Advances in ocular imaging now permit biometric assessments of the posterior corneal surface curvature as well as measurements of corneal thickness that allow us to more completely describe spatial variations in corneal shape and thickness. Nevertheless, early identification, including suspects, remains an important goal to allow new treatment strategies to be considered (eg, cross-linking ), as well as screening for refractive surgery (eg, avoiding post–laser in situ keratomileusis ectasia ), which is a challenging task.
The Cone Location and Magnitude Index (CLMI) was originally developed to identify patterns of focal corneal steepening based only upon anterior surface curvature measurements. This index was shown to be highly sensitive and very specific for the detection of keratoconus. Moreover, it provides quantitative information regarding the location of the cone apex as well as the magnitude of curvature within the apical region that could be useful to quantify disease progression. This index is currently implemented on both the Keratron (Optikon, Rome, Italy) and the GALILEI Dual Scheimpflug Analyzer (Ziemer Ophthalmic Systems, Port, Switzerland), and is used clinically in the diagnosis and management of keratoconus. In current form, the Cone Location and Magnitude Index does not take into account any information regarding the posterior corneal surface shape or corneal thickness. The purpose of this study is to extend the capabilities of the Cone Location and Magnitude Index algorithm to include the combination of tomographic information from the anterior and posterior surface, as well as corneal thickness measurements, to further improve our ability to correctly identify keratoconus.
Methods
Patient Groups and Instrumentation
All data for this retrospective case-control study were acquired and analyzed in accordance with each site’s Institutional Review Board or Ethics Committee: Medical Committee-Clinica de Oftalmologia de Cali, Cantonal Ethics Committee of Bern, Baylor College of Medicine Institutional Review Board, and The Ohio State University Medicine Institutional Review Board. Also, data were transmitted and reprocessed using anonymous subject IDs to protect subject confidentiality. The methods adhered to the tenets of the Declaration of Helsinki and were HIPAA compliant.
In 3 clinical settings, 1 for development and 2 for validation, subjects with keratoconus were clinically identified by characteristic refractive and slit-lamp signs that included: unstable refraction; oblique astigmatism; irregular retinoscopic and keratometry mires; and biomicroscopic signs such as Vogt striae, Fleischer ring, etc, and no history of corneal surgery. An expert review of topographic data (Keratron Scout; Optikon, Rome, Italy) and/or tomographic data (GALILEI Dual Scheimpflug Analyzer; Ziemer Ophthalmic Systems, Port, Switzerland) was used to confirm clinical diagnosis for the Development set and Validation Set 2. Normal subjects had no documented history of corneal disease or corneal surgery. For the Development data set, expert review of topographic and tomographic data confirmed normal classification. For all 3 data sets, the GALILEI Dual Scheimpflug-Placido tomographer was used for calculation of the Cone Location and Magnitude Index parameters.
Algorithms
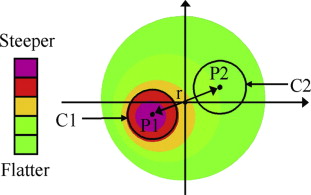
The Cone Location and Magnitude Index was implemented using The Ohio State University Corneal Topography Tool, which is a software tool for the processing and display of topographic data from multiple clinical videokeratography instruments. A schematic illustration of the routine is given in Figure 1 . The Cone Location and Magnitude Index routine finds the maximum area-weighted average in the circle ( C1 ) present within the measured area, with the center point, P1 ( r ,Θ), of the circle being within the search zone of the map, where r represents the radial distance from the center and Θ represents angular position. Next, the area-weighted average of all points outside of C1 is subtracted from the area-weighted average of all points inside of C1 , resulting in magnitude M1 . Next, circle ( C2 ) centered at P2 ( r , Θ + 180 degrees) is analyzed. The area-weighted average of all points outside of C2 is subtracted from the area-weighted average of all points inside of C2 , resulting in magnitude M2 . If P1 is inside of the central 2.0 mm of the map, then the Cone Location and Magnitude Index = M1 − r × M2 ; otherwise the Cone Location and Magnitude Index = M1 − M2 . In simple terms, the software routine searches within the mapped area to find the steepest-area local region. It then compares that area to the rest of the map to determine whether or not this local maximum region is consistent with corneal asymmetry associated with keratoconus. The magnitude of the Cone Location and Magnitude Index, the radial and angular position of the center of the maximum circle ( P1 ), and the average value inside of C1 are reported.
Originally applied to anterior axial and tangential curvature maps, the Cone Location and Magnitude Index algorithm was extended in the current study to include both anterior and posterior curvature maps using a search zone of 8.0 mm diameter and a spot size of 2.0 mm diameter. In addition, since the algorithm is designed to find a maximum value, it was adapted to the posterior elevation relative to a best-fit sphere map to search for maximum elevation using the same search pattern but with an alteration of the search region to avoid artifact near the periphery and a smaller spot size to find the smaller elevation features. The result is that the maximum posterior elevation is identified using a search zone of 5.0 mm diameter with a spot size of 0.5 mm diameter. The average value inside of C1 was defined as posterior elevation on the posterior best-fit sphere map.
The Cone Location and Magnitude Index approach was modified to produce a similar algorithm, the Flat Location and Magnitude Index, which was also implemented in the current study. The Flat Location and Magnitude Index algorithm was originally developed to locate the flattened optical zone on a curvature map after a myopic refractive procedure and searches for C1 as a minimum area, rather than a maximum. Also, the area to compare against ( C2 ) is at least 2.0 mm and 180 degrees away toward the center of the map in order to avoid overlap in the 2 circles for central minimum areas. The Flat Location and Magnitude Index was adapted to the pachymetry map using the same search pattern but with a search zone of 7.0 mm diameter and a spot size of 1.0 mm diameter to locate a smaller region of minimum corneal thickness. The Flat Location and Magnitude Index (FLMI_PACH) was calculated as C1 minus C2 where C1 and C2 are at least 2 mm apart. This is a measure of the rate of change of corneal thickness across the cornea, which may be increased in keratoconus. This provides information similar to the corneal thickness variations in keratoconus described by Mandell and Polse. In a recent interpretation of this idea, corneal thickness profile plots are available on the Pentacam as described by Ambrosio. ConeLocationMagnitudeIndex_X is the analysis of the Cone Location and Magnitude Index algorithm applied to anterior, posterior, and pachymetric tomographic maps. The univariate parameters that comprise ConeLocationMagnitudeIndex_X can be seen in Table 1 .
| Parameter | Description |
|---|---|
| CLMI Axial | The magnitude of CLMI calculated on the Anterior Axial map (D) |
| Spot Axial | The average value of C1, the steepest region on the Anterior Axial map (D) |
| CLMI Paxial | The magnitude of CLMI calculated on the Posterior Axial map (D) |
| Spot Paxial | The average value of C1, the steepest region on the Posterior Axial map (D) |
| CLMI Tan | The magnitude of CLMI calculated on the Anterior Tangential map (D) |
| Spot Tan | The average value of C1, the steepest region on the Anterior Tangential map (D) |
| CLMI Ptan | The magnitude of CLMI calculated on the Posterior Tangential map (D) |
| Spot Ptan | The average value of C1, the steepest region on the Posterior Tangential map (D) |
| FLMI Pach | The difference C1 – C2 calculated on the Pachymetry map (mm). The distance between C1 and C2 is at least 2 mm. |
| Spot Pach | The average value of C1, the thinnest region on the Pachymetry map (mm) |
| Posterior Elevation | The average value of the highest region above the Posterior Best-Fit Sphere map (mm) |
Additionally, anterior corneal power was calculated for each record to provide a descriptive summary of keratoconus severity as described by McMahon and associates : mild < 52.0 D; 52.0 D ≤ moderate <56.0 D; and severe > 56.0 D.
Development Data Set
For development purposes, an existing GALILEI tomographic data set, consisting of 84 eyes of 44 normal subjects with no documented history of ocular disease and 95 eyes of 65 subjects with keratoconus collected at the Clinica de Oftalmologia de Cali, Pontificia Universidad Javeriana, Cali, Colombia, was retrospectively analyzed. The scans were exported from the GALILEI and processed with The Ohio State University Corneal Topography Tool to generate Cone Location and Magnitude Index parameters on anterior and posterior axial and tangential curvature maps, Posterior Elevation on posterior best-fit sphere elevation maps, and Flat Location and Magnitude Index on pachymetry maps (ConeLocationMagnitudeIndex_X).
Validation Data Set 1
ConeLocationMagnitudeIndex_X was then calculated retrospectively on a second distinct data set consisting of 36 eyes (OD) of 36 subjects with clinically diagnosed keratoconus and 67 eyes (OD) from 67 normal subjects with no ocular history for keratoconus, collected at the Department of Ophthalmology, University Hospital of Bern, Inselspital, Bern, Switzerland. The scans were exported from the GALILEI and processed with The Ohio State University Corneal Topography Tool to generate Cone Location and Magnitude Index parameters on anterior and posterior axial and tangential curvature maps, Posterior Elevation on posterior best-fit sphere elevation maps, and Flat Location and Magnitude Index on pachymetry maps.
Validation Data Set 2
ConeLocationMagnitudeIndex_X was then calculated retrospectively on a third distinct data set consisting of 93 eyes from 93 normal subjects and 32 eyes of 27 subjects with clinically diagnosed keratoconus collected at the Cullen Eye Institute, Baylor College of Medicine, Houston, Texas, USA. The scans were exported from the GALILEI to generate Cone Location and Magnitude Index parameters on anterior and posterior axial and tangential curvature maps, Posterior Elevation on posterior best-fit sphere elevation maps, and Flat Location and Magnitude Index on pachymetry maps.
Data Analysis
Analyses were performed using SAS (SAS Institute Inc, Cary, North Carolina, USA; v9.1).
Means and standard deviations were calculated for all parameters and for each data set (development set and 2 validation sets), by patient group (normal vs keratoconus). Because the distribution of the parameters evaluated violated the assumptions of parametric statistical testing (equal variance, normally distributed residual error, etc), the Wilcoxon-Mann-Whitney test, a nonparametric statistical comparison, was used. The Bonferroni adjusted level of significance was P = .0015.
The Cone Location and Magnitude Index and Flat Location and Magnitude Index algorithms were applied to all maps as described above. Logistic regression analysis was performed on the development data set to develop a quantitative model to best detect keratoconus. The resulting mathematical model was applied to all 3 sets to calculate the PercentProbabilityKeratoconus_X using all parameters. The original Percent Probability of Keratoconus using only anterior axial curvature data was also calculated. Sensitivity, specificity, accuracy, and precision were calculated for each set for both algorithms to evaluate performance.
Results
The Development set has 84 mild keratoconic eyes with anterior corneal power = 46.35 ± 2.31 D, 5 moderate keratoconic eyes with anterior corneal power = 54.19 ± 1.55 D, and 4 severe keratoconic eyes with anterior corneal power = 58.02 ± 2.20 D. Validation Set 1 has 32 mild keratoconic eyes with anterior corneal power = 47.68 ± 2.29 D and 4 moderate keratoconic eyes with anterior corneal power = 53.73 ± 0.92 D. Validation Set 2 has 20 mild keratoconic eyes with anterior corneal power = 46.73 ± 2.26 D, 3 moderate keratoconic eyes with anterior corneal power = 53.29 ± 0.30 D, and 3 severe keratoconic eyes with anterior corneal power = 57.96 ± 1.27 D.
All univariate parameters included in the logistic regression model show significant differences (Wilcoxon-Mann-Whitney test) between normal eyes and eyes with keratoconus for all 3 data sets ( P < .0001) ( Tables 2-4 ).
| Parameter | Keratoconus | Normal | ||||
|---|---|---|---|---|---|---|
| N | Mean | SD | N | Mean | SD | |
| CLMI Axial (D) a | 95 | 5.05 | 3.78 | 84 | 0.84 | 0.57 |
| Spot Axial (D) a | 95 | 49.90 | 4.06 | 84 | 44.45 | 1.60 |
| CLMI Paxial (D) a | 95 | −1.18 | 0.72 | 84 | −0.22 | 0.20 |
| Spot Paxial (D) a | 95 | −7.53 | 0.75 | 84 | −6.50 | 0.26 |
| CLMI Tan (D) a | 95 | 7.77 | 6.38 | 84 | 1.51 | 1.37 |
| Spot Tan (D) a | 95 | 49.23 | 3.51 | 84 | 44.37 | 1.59 |
| CLMI Ptan (D) a | 95 | −1.84 | 1.08 | 84 | −1.01 | 1.28 |
| Spot Ptan (D) a | 95 | −7.44 | 0.65 | 84 | −6.48 | 0.31 |
| FLMI Pach (mm) a | 95 | −0.039 | 0.012 | 84 | −0.028 | 0.007 |
| Spot Pach (mm) a | 95 | 0.550 | 0.039 | 84 | 0.597 | 0.030 |
| Posterior Elevation (mm) a | 95 | 0.033 | 0.015 | 84 | 0.013 | 0.004 |
a Denotes significant difference ( P < .0001) between Keratoconus and Normal.
| Parameter | Keratoconus | Normal | ||||
|---|---|---|---|---|---|---|
| N | Mean | SD | N | Mean | SD | |
| CLMI Axial (D) a | 36 | 6.27 | 3.86 | 67 | 0.72 | 0.50 |
| Spot Axial (D) a | 36 | 51.16 | 3.55 | 67 | 44.37 | 1.40 |
| CLMI Paxial (D) a | 36 | −2.03 | 1.05 | 67 | −0.17 | 0.11 |
| Spot Paxial (D) a | 36 | −8.22 | 0.81 | 67 | −6.50 | 0.24 |
| CLMI Tan (D) a | 36 | 9.16 | 4.46 | 67 | 1.28 | 0.77 |
| Spot Tan (D) a | 36 | 51.04 | 3.71 | 67 | 44.29 | 1.38 |
| CLMI Ptan (D) a | 36 | −2.73 | 1.21 | 67 | −0.73 | 1.16 |
| Spot Ptan (D) a | 36 | −8.18 | 0.80 | 67 | −6.44 | 0.24 |
| FLMI Pach (mm) a | 36 | −0.055 | 0.014 | 67 | −0.030 | 0.005 |
| Spot Pach (mm) a | 36 | 0.497 | 0.038 | 67 | 0.575 | 0.038 |
| Posterior Elevation (mm) a | 36 | −0.044 | 0.017 | 67 | 0.011 | 0.004 |
a Denotes significant difference ( P < .0001) between Keratoconus and Normal.
| Parameter | Keratoconus | Normal | ||||
|---|---|---|---|---|---|---|
| N | Mean | SD | N | Mean | SD | |
| CLMI Axial (D) a | 32 | 8.64 | 4.23 | 93 | 0.89 | 0.59 |
| Spot Axial (D) a | 32 | 52.00 | 4.64 | 93 | 44.61 | 1.33 |
| CLMI Paxial (D) a | 32 | −2.48 | 1.00 | 93 | −0.15 | 0.11 |
| Spot Paxial (D) a | 32 | −8.19 | 1.01 | 93 | −6.44 | 0.24 |
| CLMI Tan (D) a | 32 | 12.55 | 6.21 | 93 | 2.19 | 1.83 |
| Spot Tan (D) a | 32 | 53.60 | 4.72 | 93 | 44.91 | 1.60 |
| CLMI Ptan (D) a | 32 | −3.60 | 2.26 | 93 | −0.42 | 0.46 |
| Spot Ptan (D) a | 32 | −8.44 | 0.89 | 93 | −6.44 | 0.26 |
| FLMI Pach (mm) a | 32 | −0.050 | 0.022 | 93 | −0.025 | 0.005 |
| Spot Pach (mm) a | 32 | 0.510 | 0.042 | 93 | 0.591 | 0.028 |
| Posterior Elevation (mm) a | 32 | 0.049 | 0.018 | 93 | 0.010 | 0.003 |
Stay updated, free articles. Join our Telegram channel

Full access? Get Clinical Tree


