Purpose
To evaluate the effect of choroidal vascular hyperpermeability, as determined using indocyanine green angiography (ICGA), on the outcome of anti–vascular endothelial growth factor (VEGF) treatment for polypoidal choroidal vasculopathy (PCV).
Design
Retrospective comparative series.
Methods
Based on the presence of choroidal vascular hyperpermeability on ICGA, 103 eyes (101 patients) with PCV were categorized into 2 subgroups: choroidal vascular hyperpermeability (+) group (41 eyes) and choroidal vascular hyperpermeability (−) group (62 eyes). All subjects were treatment naïve and treated by anti-VEGF with initial 3 loading injections per month, followed by an as-needed reinjection. Best-corrected visual acuity (BCVA) and central macular thickness after treatment were compared between the 2 groups at baseline and at 3, 6, 9, and 12 months.
Results
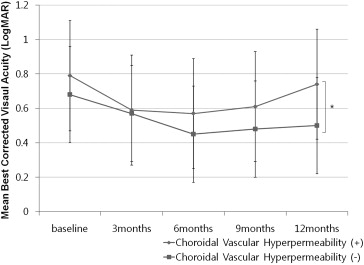
At 12 months after treatment, mean BCVA was significantly improved from 0.68 logarithm of the minimal angle of resolution (logMAR) (20/95 Snellen equivalent) to 0.50 logMAR (20/63 Snellen equivalent) in the choroidal vascular hyperpermeability (−) group ( P = .01); however, there was no significant improvement, from 0.79 logMAR (20/123 Snellen equivalent) to 0.74 logMAR (20/109 Snellen equivalent), in the choroidal vascular hyperpermeability (+) group. In paired comparisons of BCVA between baseline and each follow-up visit, the choroidal vascular hyperpermeability (−) group showed significant improvement of BCVA at every follow-up visit ( P < .05); however, the choroidal vascular hyperpermeability (+) group did not show significant visual improvement after 9 months ( P > .05).
Conclusions
The therapeutic response to anti-VEGF treatment for PCV in patients with choroidal vascular hyperpermeability decreased over time. Choroidal vascular hyperpermeability was associated with an inferior visual outcome after intravitreal anti-VEGF treatment for PCV.
Polypoidal choroidal vasculopathy (PCV) is characterized by the presence of a branching vascular network in association with polypoidal choroidal vascular lesions that cause subretinal leakage, subretinal hemorrhage, and pigment epithelial detachment (PED). Although PCV is generally considered to be one of the subtypes of neovascular age-related macular degeneration (AMD), PCV has characteristics different from typical neovascular AMD with respect to the choroid. PCV patients more frequently showed a thicker choroid and presence of choroidal vascular hyperpermeability on indocyanine green angiography (ICGA) than patients with typical neovascular AMD.
Choroidal vascular hyperpermeability is visualized as multifocal hyperfluorescence in the middle and late phase of an ICGA. The frequency of choroidal vascular hyperpermeability in patients with PCV was reported from 34.7%-59.3%. Patients with PCV associated with choroidal vascular hyperpermeability were more likely to have bilateral neovascular membranes and thickened choroids. Choroidal vascular hyperpermeability may be a risk factor for the development of PCV.
Currently, there are several effective ways to treat PCV: photodynamic therapy (PDT) with verteporfin, intravitreal injection of anti–vascular endothelial growth factor (VEGF), or a combination of both. Intravitreal anti-VEGF injections are effective in reducing the exudation and hemorrhage associated with PCV, which can stabilize vision.
A subpopulation of PCV patients respond poorly to anti-VEGF therapy. We postulated that choroidal vascular hyperpermeability may play a role in this resistance to therapy. The purpose of the current study was to evaluate the visual outcome of anti-VEGF treatment for PCV in patients with or without choroidal vascular hyperpermeability documented by ICGA.
Subjects and Methods
We retrospectively reviewed the medical records of 101 consecutive patients with PCV who were treated at the Retina Center of Kim’s Eye Hospital in Konyang University College of Medicine from May 2009 through June 2012. This study was approved by the Institutional Review Board of Kim’s Eye Hospital, Konyang University College of Medicine. The clinical research in this study followed the tenets of the Declaration of Helsinki.
Inclusion and Exclusion Criteria
Inclusion criteria included the following: (1) age >50 years; (2) confirmation of PCV with fluorescein angiography (FA) and ICGA, performed using a confocal laser scanning system (HRA-2; Heidelberg Engineering, Dossenheim, Germany) at the first visit; (3) no previous treatment; (4) treatment with anti-VEGF agents (either bevacizumab or ranibizumab); (5) a minimum follow-up period of 12 months; and (6) the availability of results from an optical coherence tomography (OCT) examination performed at baseline and at 3, 6, 9, and 12 months. We only included patients whose ICGA revealed the presence of characteristic polypoidal structures at the border of the branching choroidal vascular networks.
The exclusion criteria included the following: (1) prior treatment with PDT; (2) treatment combined with PDT; (3) other concomitant ocular diseases, such as diabetic retinopathy, high myopia, vein or artery occlusion, or epiretinal membrane; (4) another ocular disease that could affect visual acuity; or (5) trauma during the study or in the contralateral eye, aphakia, or previous vitreoretinal surgery. No limits on visual acuity were set as either inclusion or exclusion criteria.
Indocyanine Green Angiography and Choroidal Vascular Hyperpermeability
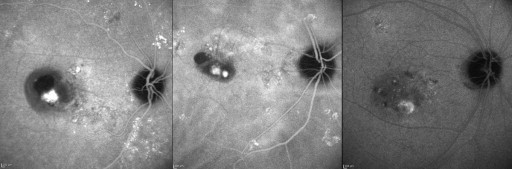
Choroidal vascular hyperpermeability was evaluated in the late phase of ICGA, approximately 10-15 minutes after dye injection. According to the report by Guyer and associates, choroidal vascular hyperpermeability was defined as multifocal areas of hyperfluorescence with blurred margins within the choroid ( Figure 1 ). The diagnosis of PCV and the presence or absence of choroidal vascular hyperpermeability were evaluated by 2 independent investigators (H.J.C. and H.S.K.). When the evaluation was inconsistent, the senior investigator (J.W.K.) made the final decision. FA and ICGA were performed at baseline, after 3 monthly loading injection treatments, and repeated when needed, considering further treatment.
The greatest linear dimension (GLD) and area of the abnormal branching vascular network were determined based on the ICGA, by using the software built into the HRA-2 machine. The GLD considered the entire PCV vascular lesion, including the polypoidal lesion, branching vascular network vessels, and any type 2 choroidal neovascularization (CNV). The area of the vascular lesion was measured manually using the software that came with the HRA-2 machine. The pigment epithelial detachment, without underlying vascular components, was not included in GLD measurement.
Outcome Measures
The primary outcome was mean change in best-corrected visual acuity (BCVA) from baseline at 3, 6, 9, and 12 months. The secondary outcome was mean change in central macular thickness (as measured by spectral-domain optical coherence tomography [SDOCT, Spectral OCT/SLO; OTI Ophthalmic Technologies Inc, Miami, Florida, USA]) from baseline at 3, 6, 9, and 12 months. Further, the percentage of patients gaining or losing more than 3 lines of vision, as measured from baseline, and the rate of polyp regression were examined.
BCVA was assessed using the Snellen chart at baseline and at each monthly follow-up visit after the initiation of intravitreal anti-VEGF injection treatment. For statistical analysis, the Snellen BCVA was converted to a logarithm of the minimal angle of resolution (logMAR).
Central macular thickness was assessed by measurement of retinal thickness of the 1-mm central retina, which was obtained by a macular scan. Only well-centered scans without overt algorithm failure messages were selected for analysis.
Intravitreal Anti–Vascular Endothelial Growth Factor Treatment
The off-label nature of the treatment and its potential risks and benefits were discussed in detail, and a signed informed consent was obtained from all patients. Intravitreal anti-VEGF injections of bevacizumab (1.25 mg/0.05 mL; Avastin; Genentech Inc, South San Francisco, California, USA) or ranibizumab (0.5 mg/0.05 mL; Lucentis; Genentech Inc) were administered. We performed 3 consecutive monthly loading dose injections. After performing these 3 loading injections, retreatment for each patient was performed on an as-needed basis if any of the following conditions was observed: (1) visual deterioration of more than 2 lines; (2) OCT evidence of persistent fluid or hemorrhage involving the macula at least 1 month after the previous injection; (3) newly developed macular hemorrhage; or (4) evidence of an active PCV lesion as found on FA, ICGA, or OCT.
Statistical Analysis
SPSS software version 13.0 (SPSS Inc, Chicago, Illinois, USA) was used for all of the statistical analyses. Frequencies were compared between treatment groups by using the χ 2 test or Fisher exact test. Comparative statistical analysis was performed using unpaired 2-sided t tests. For the nonparametric data, the Mann-Whitney U test and the Kruskal-Wallis test were used. A P value of less than .05 was considered statistically significant.
Results
A total of 103 eyes of 101 PCV patients (71 men, 30 women) who underwent treatment with intravitreal anti-VEGF were enrolled in the study. All patients were South Korean, and the average age for the entire study group was 67.4 ± 7.2 years. Subjects received a mean of 4.58 ± 1.41 injections within 12 months. Ranibizumab was used for 57.1% of all injections (269/472), and bevacizumab was used for the remainder (203/472). After ICGA analysis, we categorized eyes with PCV into 2 subgroups according to the presence of choroidal vascular hyperpermeability ( Table 1 ). The choroidal vascular hyperpermeability (+) group included 41 eyes, and the choroidal vascular hyperpermeability (−) group included 62 eyes. Baseline BCVA was 0.79 ± 0.45 logMAR (Snellen equivalent, 20/123) in the choroidal vascular hyperpermeability (+) group and 0.68 ± 0.51 logMAR (Snellen equivalent, 20/95) in the choroidal vascular hyperpermeability (−) group. There was no significant difference in baseline BCVA between the groups ( P = .32). There was no significant difference between the 2 groups with respect to age, sex, mean baseline central macular thickness, PCV location, mean GLD, mean size of the abnormal vascular network, the incidence of subretinal hemorrhage, the incidence of PED, the incidence of type 2 CNV, or the mean number of injections ( Table 1 ). No eye showed conversion from the choroidal vascular hyperpermeability (+) group to the (−) group after treatment, or vice versa, during follow-up.
| Choroidal Vascular Hyperpermeability (+) (n = 41) | Choroidal Vascular Hyperpermeability (−) (n = 62) | P Value | |
|---|---|---|---|
| Age (y ± SD) | 67.6 ± 8.4 | 67.2 ± 7.4 | .79 a |
| Sex | |||
| Male | 28 (68.3%) | 44 (71.0%) | |
| Female | 13 (31.7%) | 18 (29.0%) | .84 b |
| Baseline BCVA (logMAR) (Snellen equivalent) | 0.79 ± 0.45 (20/123) | 0.68 ± 0.51 (20/95) | .32 a |
| Mean ± SD baseline central macular thickness (μm) | 392 ± 166 | 386 ± 182 | .79 a |
| PCV location, n (%) | .88 c | ||
| Macular | 34 (83.0%) | 54 (87.1%) | |
| Peripapillary | 4 (10.0%) | 5 (8.1%) | |
| Periphery | 3 (7.0%) | 3 (4.8%) | |
| Mean ± SD GLD on ICGA (μm) | 2615 ± 672 | 2479 ± 831 | .11 a |
| Mean ± SD size of vascular network (mm 2 ) | 3.28 ± 2.01 | 2.46 ± 1.24 | .08 a |
| Mean ± SD number of polyps | 2.3 ± 1.11 | 2.1 ± 1.26 | .88 a |
| Mean ± SD size of largest polyp (μm) | 446 ± 195.3 | 435 ± 182.0 | .75 a |
| Subretinal hemorrhage, n (%) | 16 (39.0%) | 23 (37.1%) | .66 b |
| Pigment epithelial detachment, n (%) | 12 (29.3%) | 20 (32.2%) | .52 b |
| Concurrent type 2 CNV, n (%) | 6 (14.6%) | 8 (13.0%) | .83 b |
| Mean ± SD number of injections | 4.88 ± 2.01 | 4.28 ± 1.71 | .17 a |
Over the 12 months of this study, the average number of injections was 4.88 ± 2.01 in the choroidal vascular hyperpermeability (+) group and 4.28 ± 1.71 in the choroidal vascular hyperpermeability (−) group. There was no significant difference between groups in terms of the number of injections ( Table 2 ). Vitreous hemorrhage associated with intravitreal anti-VEGF injection (defined as hemorrhage within 3 days after intravitreal injection) was documented in 3 eyes (7.3%) in the choroidal vascular hyperpermeability (+) group and in 4 eyes (6.5%) in the choroidal vascular hyperpermeability (−) group. There was no significant difference between the 2 groups with respect to the incidence of vitreous hemorrhage (Fisher exact test, P = .67). No other complications, including endophthalmitis, traumatic lens injury, or retinal detachment, were observed. Further, no systemic adverse events occurred in patients treated with intravitreal anti-VEGF agents.
| 3 Months | 6 Months | 9 Months | 12 Months | |
|---|---|---|---|---|
| Choroidal vascular hyperpermeability (+) (n = 41), mean ± SD | 3.00 ± 0 | 3.38 ± 0.48 | 3.86 ± 0.65 | 4.88 ± 2.01 |
| Choroidal vascular hyperpermeability (−) (n = 62), mean ± SD | 3.00 ± 0 | 3.23 ± 0.41 | 3.38 ± 0.81 | 4.28 ± 1.71 |
| P value a | .90 | .39 | .17 |
The mean change in BCVA after anti-VEGF treatment is shown in Figure 2 . From baseline to 6 months, BCVA improved significantly in both groups ( Table 3 ). However, in paired comparisons of mean BCVA between baseline and each follow-up visit, the choroidal vascular hyperpermeability (+) group did not show significant visual improvement from baseline after 9 months ( Table 3 ). Although there was a slight improvement at 12 months after initial treatment, the mean BCVA was not significantly different from baseline ( Figure 2 , Table 3 ). In contrast, the choroidal vascular hyperpermeability (−) group showed significant visual improvement at any follow-up visit ( P < .05, Table 3 ). The mean BCVA in the choroidal vascular hyperpermeability (+) group was significantly worse than that observed in the choroidal vascular hyperpermeability (−) group at 12 months from baseline ( P = .02, Figure 2 ).
| Baseline | 3 Months | 6 Months | 9 Months | 12 Months | |
|---|---|---|---|---|---|
| Choroidal vascular hyperpermeability (+) (n = 41), mean ± SD, logMAR (Snellen equivalent) | 0.79 ± 0.45 (20/123) | 0.59 ± 0.41 (20/77) | 0.57 ± 0.32 (20/74) | 0.66 ± 0.37 (20/81) | 0.74 ± 0.42 (20/109) |
| P value a | .009 | .006 | .12 | .48 | |
| Choroidal vascular hyperpermeability (−) (n = 62), mean ± SD, logMAR (Snellen equivalent) | 0.68 ± 0.51 (20/95) | 0.54 ± 0.43 (20/74) | 0.45 ± 0.39 (20/56) | 0.48 ± 0.36 (20/60) | 0.50 ± 0.41 (20/63) |
| P value a | .008 | .002 | .007 | .01 |
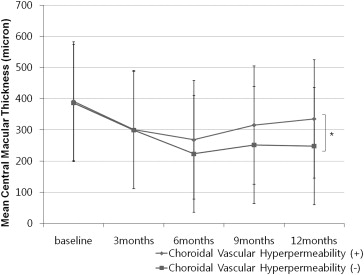
The mean change in central macular thickness ( Figure 3 ) correlated with change in BCVA. Mean central macular thickness decreased significantly over time in both groups until 9 months ( Table 4 ). However, mean central macular thickness was significantly thicker in the choroidal vascular hyperpermeability (+) group as compared to the choroidal vascular hyperpermeability (−) group at 12 months ( P = .03, Figure 3 ). At 12 months, the central macular thickness of the choroidal vascular hyperpermeability (+) group was similar to that observed at baseline ( P > .05, Table 4 ). However, the choroidal vascular hyperpermeability (−) group showed a significant increase in central macular thickness at each follow-up visit ( P < .05, Table 4 ).
| Baseline | 3 Months | 6 Months | 9 Months | 12 Months | |
|---|---|---|---|---|---|
| Choroidal vascular hyperpermeability (+) (n = 41) (μm), mean ± SD | 392 ± 166 | 301 ± 189 | 268 ± 185 | 315 ± 299 | 335 ± 200 |
| P value a | .02 | .007 | .04 | .31 | |
| Choroidal vascular hyperpermeability (−) (n = 62) (μm), mean ± SD | 386 ± 182 | 299 ± 129 | 223 ± 142 | 251 ± 177 | 248 ± 106 |
| P value a | .01 | .002 | .008 | .008 |
Stay updated, free articles. Join our Telegram channel

Full access? Get Clinical Tree


