Purpose
To evaluate photoreceptors in Bietti crystalline dystrophy patients with CYP4V2 mutations using high-resolution images of the macula obtained with adaptive optics scanning laser ophthalmoscopy (AO-SLO).
Design
Prospective observational case series with comparison to healthy controls.
Methods
Seven eyes of 7 Bietti crystalline dystrophy patients with CYP4V2 mutations and 12 normal eyes of 12 age- and axial length–matched healthy volunteers were studied. All participants underwent ophthalmologic examinations and AO-SLO assessments. All patients underwent spectral-domain optical coherence tomography, fundus autofluorescence, Humphrey field analysis, and electroretinography. AO-SLO images were analyzed 0.5 mm and 1.0 mm from the center of the fovea in the superior, inferior, nasal, and temporal quadrants.
Results
Mean ± standard deviation cone density (cells/mm 2 ) 0.5 mm from the center of the fovea was 17 209 ± 2276 in patients and 20 493 ± 2758 in controls, which was statistically different ( P = .001); however, mean cone density 1.0 mm from the center of the fovea was 15 685 ± 2302 in patients and 15 705 ± 1848 in controls, which was not statistically different ( P = .20). There was no correlation between cone density and mean deviation measured using a Humphrey field analysis or visual acuity in patients.
Conclusions
In Bietti crystalline dystrophy patients with CYP4V2 mutations, cone density remained for visual dysfunction by evaluation using high-resolution AO-SLO. These findings support the theory that disorder of the retinal pigment epithelium and the photoreceptors in the patients are the primary and secondary pathologic changes, respectively. This is consistent with results from previous basic studies.
Bietti crystalline dystrophy is a rare autosomal recessive retinal degenerative disease that was first reported in 1937. The prevalence of Bietti crystalline dystrophy is estimated at 1:67 000. The disease is characterized by the presence of shiny yellow deposits on the cornea and posterior pole of the retina, and progressive atrophy of the retina, choriocapillaris, and choroid. Spectral-domain optical coherence tomography (SD OCT) may also show outer retinal tubulation. The symptoms of Bietti crystalline dystrophy are similar to those of retinitis pigmentosa (RP): night blindness, gradual constriction of the visual field, abnormal retinal electrophysiology, and decreased visual acuity. In 2004, Li and associates identified a mutation in the cytochrome P450 gene CYP4V2 in patients with Bietti crystalline dystrophy. There are no reports showing involvement of other genes in this condition. Bietti crystalline dystrophy patients with CYP4V2 mutations show retinal degeneration and CYP4V2 expression in the retina and retinal pigment epithelium (RPE), making it difficult to determine whether the pathogenesis of Bietti crystalline dystrophy with CYP4V2 mutations is a disorder of RPE and/or the photoreceptors. Several reports have suggested that RPE dysfunction is the primary change in Bietti crystalline dystrophy with CYP4V2 mutations.
Adaptive optics scanning laser ophthalmoscopy (AO-SLO) allows high-quality noninvasive imaging of retinal cells such as photoreceptors. We have reported AO-SLO findings in various eye diseases. Our findings for RP patients showed reduced cone density in the cone mosaic spatial arrangement.
Although various studies have assessed Bietti crystalline dystrophy patients, there are no reported characterizations of photoreceptors in these individuals. In this study, we sought to determine whether cone photoreceptor cells in Bietti crystalline dystrophy patients with confirmed CYP4V2 mutations differ from those of healthy volunteers by evaluation using high-resolution AO-SLO and analyzed the relationship between disorders of the photoreceptors and those of the visual functions.
Methods
Ethics Statement
This study was approved by the ethics committee of the Kyoto University Graduate School of Medicine (Kyoto, Japan) and adhered to the tenets of the Declaration of Helsinki. The nature of the study and its possible consequences were explained to the study candidates, after which written informed consent was obtained from all participants.
Subjects
In this prospective observational case series, we evaluated 7 eyes from 7 Japanese Bietti crystalline dystrophy patients (5 women and 2 men; mean age ± standard deviation [SD], 57.7 ± 6.7 years; range, 48–64 years). All individuals were recruited after they visited the Department of Ophthalmology and Visual Sciences, Kyoto University Graduate School of Medicine, Kyoto, Japan, and consented to undergo AO-SLO imaging between December 2010 and July 2015. Bietti crystalline dystrophy was diagnosed by retina specialists. Inclusion criteria were the detection of CYP4V2 mutations via Sanger sequencing in Bietti crystalline dystrophy patients, and the ability to obtain AO-SLO images. Exclusion criteria were the absence of necessary data, and the presence of eye diseases other than refractive errors, cataract, and pseudophakia. Clinical characteristics of the Bietti crystalline dystrophy patients are given in Table 1 . We also examined 12 eyes of 12 healthy Japanese volunteers (mean age ± SD, 48.8 ± 17.3 years; range, 33–89 years) with no eye disease.
| Case | Age (y) | Sex | Eye | VA | AL (mm) | ERG (Cone Flicker) | HFA10-2 (dB) | Presence of ISe | Atrophy of RPE | Mean ± SD of Cone Density (cells/mm 2 ) | |||||
|---|---|---|---|---|---|---|---|---|---|---|---|---|---|---|---|
| Amplitude (μV) | Latency (ms) | MD | Central 4 Points | 0.5 mm | 1.0 mm | 0.5 mm | 1.0 mm | 0.5 mm | 1.0 mm | ||||||
| 1 | 55 | M | OD | 20/32 | 23.72 | 39.75 | 28 | −21.31 | −21.75 | − | − | + | + | 18 403 ± 1572 | 16 319 ± 1159 |
| 2 | 64 | F | OD | 20/63 | 23.64 | Extinguished | −31.69 | −32.75 | − | − | + | + | 17 652 ± 526 | 16 283 ± 1693 | |
| 3 | 62 | F | OD | 20/12.5 | 23.55 | 96 | 25.6 | −4.22 | −4.00 | + | − | ± | ± | 18 141 ± 1966 | 16 340 ± 1570 |
| 4 | 61 | M | OD | 20/20 | 23.44 | 6.638 | 37.8 | −27.21 | −20.25 | − | − | + | + | 19 318 ± 1309 | 16 968 ± 2774 |
| 5 | 50 | F | OD | 20/63 | 25.12 | Extinguished | −33.56 | −31.75 | − | − | + | + | 16 384 ± 1177 | 15 892 ± 1999 | |
| 6 | 48 | F | OS | 20/32 | 26.43 | 16.42 | 31.4 | −31.49 | −25.75 | − | − | + | + | 12 931 ± 1029 | 11 960 ± 1812 |
| 7 | 64 | F | OD | 20/40 | 23.93 | 67.5 | 30.2 | −24.25 | −22.75 | − | − | + | + | 17 630 ± 1013 | 16 038 ± 1878 |
Ophthalmologic Examinations
All subjects underwent a comprehensive ophthalmologic examination, including measurement of best-corrected visual acuity (BCVA) assessed with the Landolt chart and expressed as the logarithm of the minimal angle of resolution (logMAR), a visual field testing using a Humphrey Field Analyzer (HFA; Carl Zeiss Meditec, Dublin, California, USA) with the 10-2 Swedish Interactive Threshold Algorithm (SITA) standard program, axial length (AL) assessment using an IOL Master (Carl Zeiss Meditec), indirect ophthalmoscopy, slit-lamp biomicroscopy with a contact lens, color fundus photography, fundus autofluorescence (FAF), SD OCT, and AO-SLO. All patients underwent 30-Hz flicker electroretinography (ERG). ERG results were recorded according to the ISCEV standard protocol recommended in 2008 using LS-C (Mayo Co, Nagoya, Japan) and Neuropack MEB-2204 systems (Nihon Kohden, Tokyo, Japan).
Adaptive Optics Scanning Laser Ophthalmoscopy System
The AO-SLO system developed by Canon (Canon, Inc, Tokyo, Japan) was used based on previous reports detailing the usefulness of incorporating wide-field SLO with AO-SLO. The system comprises 4 primary optical subsystems: the AO subsystem, which includes the wavefront sensor and the spatial light modulator; the high-resolution confocal SLO imaging subsystem; the wide-field imaging subsystem; and the pupil observation subsystem, which facilitates the initial alignment of the subject’s pupil with respect to the optical axis of the AO-SLO system through adjustment of the chin rest position. The wavefront sensor measures whole-eye aberrations, and the spatial light modulator compensates for these aberrations. The AO-SLO system is confocal, enabling creation of “en face” images in any plane. These high-resolution images show individual cone photoreceptor cells.
Analysis of Adaptive Optics Scanning Laser Ophthalmoscopy Images of Cone Mosaic Features
For each eye, AO-SLO images were obtained at multiple locations in the macula. At each location, the image series was obtained by shifting the focus from the retinal nerve fiber layer to the RPE, paying particular attention to obtaining images that showed the cone mosaic. First, 3 different field-of-view images (large [L]: 1700 × 1700 μm; medium [M]: 820 × 820 μm; small [S]: 340 × 340 μm) focused on the center of the fovea were obtained, followed by 2 field-of-view images (M and S) focused 0.5 mm and 1.0 mm from the center of the fovea in each quadrant (superior, nasal, inferior, and temporal). To reduce noise, 32 images were obtained at each location of interest and averaged. Correspondence between each montage and the area of interest was verified by comparing the high-magnification AO-SLO image with the wide-field AO-SLO images for that eye. The montage of AO-SLO images was used for registration with images obtained using other imaging modalities by matching the shape of the vessels.
To evaluate cone cells, we applied the automated cone-labeling process described by Li and Roorda. After automated cone labeling, an experienced observer examined each S field-of-view image. The actual measured area included about 100 cells, avoiding shadows of vascular components, and the distance between the center of the area and the fovea was set within ±1 μm. If cone cells were visible but had not been labeled, the observer manually labeled the cone cells and entered them into the software program.
As has been reported for similar systems, our system did not always allow clear visualization of individual cone cells within much of the central fovea; however, we could clearly distinguish individual cone cells >0.2 mm from the center of the fovea. Therefore, we estimated cone density in areas 0.5 mm and 1.0 mm from the center of the fovea by using the computer software to divide the number of cone cells in each imaging area by the size of the area. The center of the fovea, defined here as the center of the foveal avascular zone, was determined from the montage of AO-SLO images. Mean cone density was calculated from the densities in each of the 4 quadrants (superior, inferior, nasal, and temporal). To obtain accurate scan lengths, we corrected the magnification effect in each eye using the adjusted AL method reported by Bennett and associates.
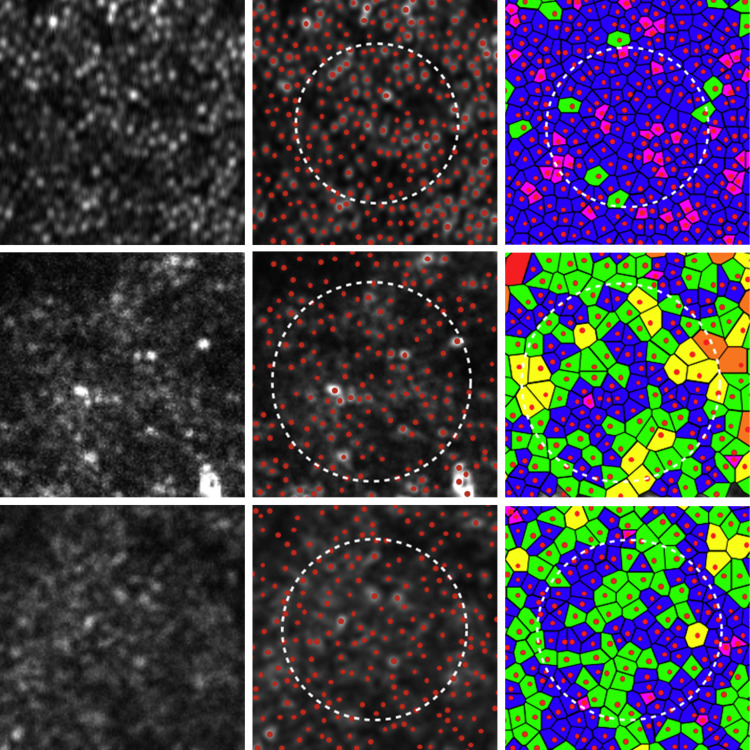
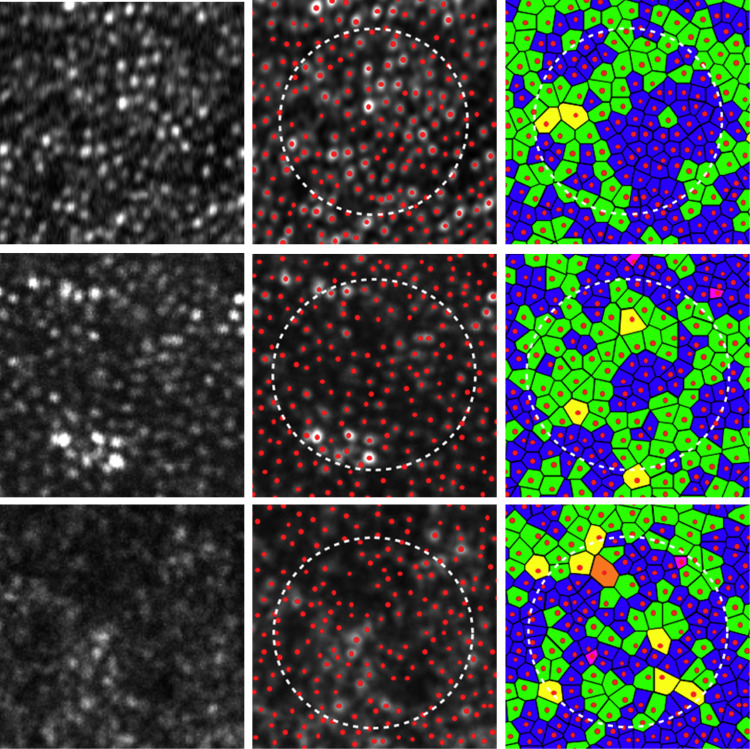
To assess the spatial organization of the cone mosaics, we examined Voronoi domains (which provide a description of the orderliness with which the cone photoreceptor array tiles the retina ) and nearest-neighbor distances associated with the cone cells in each mosaic ( Figures 1 and 2 ). Voronoi domains were constructed for each cell by defining points in the regions that were closer to that cell than to any other cell in the mosaic. The ratio of hexagonal Voronoi domains is thought to express the regularity of cellular arrangement. We determined nearest-neighbor distances by calculating the minimum distances from the center of that cell to the centers of every other cell in the mosaic. Expected nearest-neighbor distances were calculated as for a perfectly hexagonally packed mosaic with a density equal to that in each location. If both eyes were eligible for the study, 1 eye was selected at random for analysis.
Spectral-Domain Optical Coherence Tomography: Presence of Inner Segment Ellipsoid
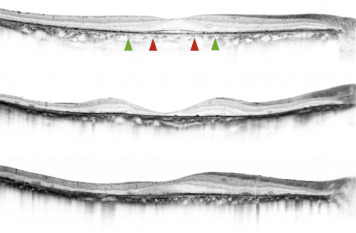
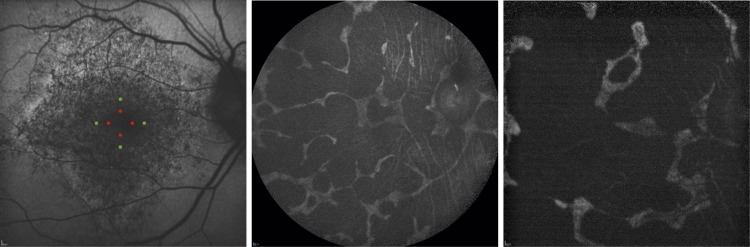
We used the Spectralis HRA+OCT system (Heidelberg Engineering, Dossenheim, Germany) to perform SD OCT in all eyes. We obtained and evaluated horizontal and vertical B-scan images (30 degrees) through the fovea of each eye. To reduce speckle noise, 100 SD OCT images were acquired at each location of interest on the retina. The Spectralis HRA+OCT system has a built-in digital caliper to measure length. We evaluated the integrity of the inner segment ellipsoid (ISe) to assess the condition of the retina, which correlates with visual function. This was done by measuring the presence of the ISe 0.5 mm and 1.0 mm from the center of the fovea in each of 4 quadrants (superior, inferior, nasal, and temporal) using OCT ( Table 1 , Figure 3 ). Similarly, to assess atrophy of the RPE, we measured 0.5 mm and 1.0 mm from the center of the fovea in each of 4 quadrants in the FAF images using HRA ( Table 1 , Figure 4 ).
Humphrey Field Analyzer (10-2 SITA Standard Program)
We used the HFA (Carl Zeiss Meditec) to evaluate macular sensitivity. Both mean deviation (MD) and mean total deviation of the central 4 points were used for analysis, with the mean total deviation reflecting the central sensitivity in a 2 × 2-degree area centered at the fovea ( Table 1 ).
Statistical Analysis
All statistical analyses were performed using SPSS (Version 21; IBM, Armonk, New York, USA). We used a Mann-Whitney U test to compare data sets and analyzed correlations using the Spearman rank correlation coefficient. A P value of < .05 was considered statistically significant.
Stay updated, free articles. Join our Telegram channel

Full access? Get Clinical Tree


