Purpose
To evaluate the thickness of the 10 retinal layers in the paramacular area of Parkinson disease patients using a new segmentation technology of optical coherence tomography (OCT) to examine whether the thickness of specific layers predicts neurodegeneration or Parkinson disease severity.
Design
Observational prospective study.
Methods
Parkinson disease patients (n = 129) and age-matched healthy subjects (n = 129) were enrolled. The Spectralis OCT system was used to automatically segment all retinal layers in a parafoveal scan using the new segmentation application prototype. Mean thickness of each layer was calculated and compared between Parkinson disease patients and healthy subjects, and between Parkinson disease patients with disease durations of less than or at least 10 years. A correlation analysis was performed to evaluate the association between retinal layer thickness, duration of disease, and Parkinson disease severity. Logistic regression analysis was performed to determine the most sensitive layer for predicting axonal atrophy.
Results
Parkinson disease patients showed statistically significant reduced thickness in the retinal nerve fiber, ganglion cell, inner plexiform, and outer plexiform layers and increased thickness in the inner nuclear layer compared with healthy subjects ( P < .05). The inner retinal layers were more affected in Parkinson disease patients with long disease duration. The ganglion cell layer thickness was inversely correlated with disease duration and Parkinson disease severity, and was predictive of axonal damage in Parkinson disease patients.
Conclusions
The segmentation application of the Spectralis OCT revealed retinal layer atrophy in Parkinson disease patients, especially in the inner layers of patients with long disease duration. Ganglion cell layer reduction was associated with increased axonal damage.
Parkinson disease is a neurodegenerative disorder in which the main pathologic changes occur in the dopaminergic neurons of the substantia nigra. The cardinal motor features of Parkinson disease are attributable primarily to the selective degeneration of dopaminergic neurons in the substantia nigra pars compacta, which leads to a severe depletion of dopamine in the striatum.
Although Parkinson disease is associated with the death of pigmented dopamine neurons in the substantia nigra, there is also loss of dopaminergic neurons in areas such as the retinal ganglion cells and the higher visual areas (eg, lateral geniculate nucleus, cholinergic neurons of the nucleus basalis of Meynert, and visual cortex). Levodopa, a dopamine precursor, is released by retinal cells as an intermediate product in the melanin biosynthetic pathway. Retinal cells that produce levodopa might be reduced in Parkinson disease patients, leading to thinning of the inner retinal layers. Retinal thickness can be measured using digital imaging technologies such as optical coherence tomography (OCT), which provide noninvasive, rapid, objective, and reproducible methods for evaluating thickness and volume of eye structures. OCT allows for cross-sectional imaging of the retina and the optic disc based on interference patterns produced by low-coherence light reflected from retinal tissues. This device is used to detect and measure ganglion cell loss in neurodegenerative diseases such as multiple sclerosis and Parkinson disease, and is considered a useful tool for evaluating the retinal nerve fiber layer (RNFL) and the retinal layers in several systemic and ophthalmic diseases.
The Hoehn & Yahr scale is commonly used to quantify the progression of Parkinson disease symptoms, and categorizes Parkinson disease patients according to 5 stages. The first stage is the mildest phase of the disease (the main symptoms are tremor, muscle stiffness, slowness of movement, and problems with posture, and occur only on 1 side of the body) and the fifth stage is the most severe phase (the patient is confined to a wheelchair or bed and requires total assistance). The Unified Parkinson’s Disease Rating Scale is used to follow the longitudinal course of Parkinson disease and includes evaluation of mentation, behavior, and mood; self-evaluation of the activities of daily life; clinician-scored motor evaluation; the Hoehn & Yahr scale; and the Schwab and England activities of daily life scale.
A recent improvement in OCT technology is the prototype of specific software that allows for automatic differentiation and quantification of the 10 retinal layers using the Spectralis OCT. In the present study, the parafoveal areas of patients with Parkinson disease and age- and sex-matched healthy subjects were analyzed using this prototype. Every parafoveal retinal layer of Parkinson disease patients was systematically compared with that of healthy controls. We also evaluated clinical applications of these measurements, looking for associations between retinal layer thickness and Parkinson disease characteristics, such as severity based on the Hoehn & Yahr scale and Unified Parkinson’s Disease Rating Scale or disease duration.
Patients and Methods
This was an observational, prospective, longitudinal study. The study and data accumulation were performed with approval from the Miguel Servet Hospital Institutional Review Board (IRB). The authors confirm that the study and data accumulation conformed to all country, federal, or state laws, and the study adhered to the tenets of the Declaration of Helsinki. Informed consent for the research was obtained from the patients or subjects.
Required inclusion criteria were as follows: best-corrected visual acuity of 20/40 or better; refractive error within ±5.00 diopters equivalent sphere and ±2.00 diopters astigmatism; transparent ocular media (nuclear color/opalescence, cortical or posterior subcapsular lens opacity <1), according to the Lens Opacities Classification System III system. Exclusion criteria included glaucoma signs (applanation intraocular pressure over 20 mm Hg, cup-to-disc ratio of 0.5 or higher, or arcuate nerve fiber bundle visual field defects), previous intraocular surgery, diabetes, or other diseases that affect the visual field or neurologic system, and current use of medications that affect visual function.
Two independent samples of 129 healthy individuals and 129 Parkinson disease patients were prospectively recruited from 1 neurologist in the area of our hospital. The diagnosis of Parkinson disease was based on criteria from the United Kingdom Parkinson Disease Society Brain Bank and the United States National Institute of Neurological Disorders and Stroke: slowness of movement (bradykinesia) plus either rigidity, resting tremor, or postural instability. In addition, 3 or more of the following features during onset or evolution were required: unilateral onset, tremor at rest, progression over time, asymmetry of motor symptoms, response to levodopa for at least 5 years, clinical course of at least 10 years, and appearance of dyskinesias induced by the intake of excessive levodopa. Related medical records were carefully reviewed, including the duration of the disease, treatment, and disease severity according to the scores on the Hoehn & Yahr scale and Unified Parkinson’s Disease Rating Scale. One neurologist tested the subjects using both the Hoehn & Yahr scale and the Unified Parkinson’s Disease Rating Scale. The neurologist, who was trained on how to apply the scales, was masked to the OCT results.
All participants underwent a full ophthalmologic examination, including clinical history, best-corrected visual acuity, biomicroscopy of the anterior segment using a slit lamp, Goldmann applanation tonometry, visual field analysis using a Humphrey Field Analyzer (Carl-Zeiss Meditec, Dublin, California, USA) with a Swedish Interactive Threshold Algorithm Standard strategy (program 30-2), ophthalmoscopy of the posterior segment, and 2 applications of the Spectralis OCT (Heidelberg Engineering, Inc, Heidelberg, Germany): the fast macular cube and the RNFL-N Axonal Analytics.
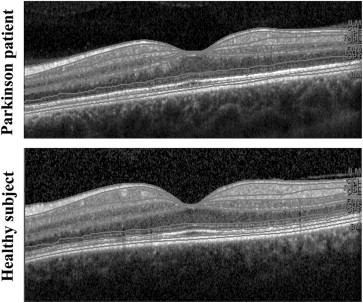
The new prototype technique for retinal segmentation using the Spectralis OCT device was performed to identify each retinal layer and to quantify its thickness. Images were acquired using the image alignment eye-tracking software (TruTrack; Heidelberg Engineering) to obtain perifoveal volumetric retinal scans comprising 25 single horizontal axial scans (scanning area: 666 square mm, centered at the fovea). Segmentation of the retinal layers in single horizontal foveal scans was performed automatically by the new segmentation application for the Spectralis OCT device, into 10 layers: 1, inner glial limiting membrane; 2, RNFL; 3, ganglion cell layer; 4, inner plexiform layer; 5, inner nuclear layer; 6, outer plexiform layer; 7, outer nuclear layer; 8, outer glial limiting membrane; 9, photoreceptors (rods and cones); 10, retinal pigment epithelium ( Figure 1 ). The 512 measurements of the peripapillary thickness of the 10 layers were registered in a database for all eyes. Mean thickness of each retinal layer was calculated.
The measurements of the peripapillary RNFL using the RNFL-N Axonal Analytics of the Spectralis OCT device for all subjects were also registered. With this instrument, RNFL thickness was measured around the disc with 16 averaged consecutive circular B-scans (diameter of 3.5 mm, 768 A-scans). An online tracking system was used to compensate for eye movements. The parameters registered were mean thickness; thickness of each of the 4 quadrants (superior, nasal, inferior, and temporal); the 6 sectors (superonasal, nasal, inferonasal, inferotemporal, temporal, and superotemporal); thickness of the papillomacular bundle; and the nasal-to-temporal ratio.
All scans were performed by the same experienced operator. Between scan acquisitions, there was a time delay and subject position and focus were randomly disrupted, meaning that alignment parameters had to be newly adjusted at the start of each image acquisition. No manual correction was applied to the OCT output. An internal fixation target was used because it is reported to provide the highest reproducibility. The quality of the scans was assessed prior to the analysis and poor-quality scans were rejected. The Spectralis OCT uses a blue quality bar in the image to indicate signal strength. The quality score range is 0 (poor quality) to 40 (excellent quality). Only images that scored higher than 25 were analyzed. Eight images with artifacts, with missing parts, or showing seemingly distorted anatomy were excluded, and these scans were repeated. Five images with bad quality owing to shaking of the head were repeated. A mean of 9 scans was required to produce each circular B-scan. Spectralis software version 5.4b was used.
Statistical Analysis
Statistical analyses were performed using the Statistical Package for the Social Sciences (SPSS 20.0; SPSS Inc, Chicago, Illinois, USA). The Kolmogorov-Smirnov test was used to assess sample distribution. Mean layer thicknesses were compared between Parkinson disease patients and healthy subjects using Student t test. P values less than .05 were considered indicative of statistically significant differences.
The Parkinson disease group was divided according to disease duration: 86 Parkinson disease patients (66.7%) were diagnosed less than 10 years ago and 43 Parkinson disease patients (33.3%) had a disease duration of at least 10 years. Retinal layer thicknesses were compared between both Parkinson disease groups using Student t test.
Linear agreement between the mean thickness of each retinal layer and 3 neurologic parameters (duration of disease; Hoehn & Yahr and Unified Parkinson’s Disease Rating Scale scores) was obtained using the Pearson correlation coefficient. A logistic regression analysis was performed to identify retinal layer thicknesses that predicted axonal damage in Parkinson disease patients.
Results
One hundred twenty-nine eyes from 129 Parkinson disease patients (72 men and 57 women) and 129 eyes of 129 healthy individuals (72 men and 57 women) were included in the study. Disease duration ranged from 1-24 years with a median of 8.40 years since diagnosis. The ages of the Parkinson disease patients ranged from 40-80 years (mean 68.75) and the ages of healthy subjects ranged from 40-89 years (mean 69.01). Mean intraocular pressure was 14.56 mm Hg in the Parkinson disease group and 14.35 mm Hg in the control group. There were no statistically significant differences in age, sex, or intraocular pressure between Parkinson disease patients and healthy subjects. The mean Hoehn & Yahr score was 2.70 and the mean Unified Parkinson’s Disease Rating Scale score was 25.10 ( Table 1 ). Best-corrected visual acuity and mean deviation of the visual field were significantly lower in Parkinson disease patients than in healthy subjects ( Table 1 ).
| Parkinson Disease Patients (n = 129) | Healthy Subjects (n = 129) | P ∗ | |||
|---|---|---|---|---|---|
| Mean (Range) | SD | Mean (Range) | SD | ||
| Age (y) | 68.75 (40-88) | 9.1 | 69.01 (40-89) | 9.6 | .329 |
| Best-corrected visual acuity (Snellen) | 0.71 (0.5-1) | 0.3 | 0.91 (0.6-1) | 0.2 | .011 |
| Intraocular pressure (mm Hg) | 14.56 (11-19) | 2.3 | 14.35 (11-20) | 2.5 | .260 |
| Mean deviation of automated perimetry | −2.36 (−19.3-2.1) | 3.9 | −0.12 (−4.9-4.8) | 2.8 | .023 |
| Average thickness (μm) | 98.41 (45-150) | 9.6 | 100.78 (61-158) | 10.2 | .018 |
| Nasal-superior thickness (μm) | 105.24 (57-149) | 18.9 | 108.55 (62-159) | 21.2 | .225 |
| Nasal thickness (μm) | 77.34 (41-106) | 15.3 | 77.93 (40-112) | 15.7 | .775 |
| Nasal-inferior thickness (μm) | 110.7 (61-149) | 24.4 | 117.35 (59-152) | 21.7 | .038 |
| Temporal-inferior thickness (μm) | 140.09 (72-198) | 20.5 | 148.41 (70-210) | 18.0 | .002 |
| Temporal thickness (μm) | 70.87 (35-106) | 11.2 | 70.22 (36-114) | 12.6 | .686 |
| Temporal-superior thickness (μm) | 133.30 (61-205) | 19.4 | 136.01 (67-208) | 19.5 | .007 |
| Papillomacular bundle thickness (μm) | 55.68 (26-80) | 10.3 | 54.15 (35-84) | 9.4 | .255 |
| Nasal-to-temporal ratio | 1.13 (0.7-1.5) | 0.3 | 1.14 (0.7-1.4) | 0.3 | .949 |
| Disease duration (y) | 8.40 (1-24) | 5.7 | – | – | – |
| Hoehn & Yahr score | 2.70 (0-5) | 0.7 | – | – | – |
| Unified Parkinson’s Disease Rating Scale | 25.10 (7-39) | 8.15 | – | – | – |
| Sex (male:female) | 72:57 | – | 72:57 | – | .931 |
∗ Significant difference ( P < .05) in Student t test between normal and Parkinson disease groups. The bold data indicates significance.
The RNFL thickness provided by RNFL-N Axonal Analytics of the Spectralis OCT device was more affected in Parkinson disease patients than in healthy subjects ( Table 1 ). Mean thickness of the RNFL and the inferonasal, inferotemporal, and superotemporal sectors was significantly reduced in Parkinson disease patients compared with healthy subjects.
Measurements of the retinal layers using the new segmentation application of the Spectralis OCT revealed statistically significant reductions in the thickness of the RNFL, ganglion cell layer, and the inner and outer plexiform layer in Parkinson disease patients compared with healthy subjects. Thickness of the inner nuclear layer was significantly increased in Parkinson disease patients compared with healthy subjects ( Table 2 ; Figure 2 ).
| Layer | Parkinson Disease Patients (n = 129) | Healthy Subjects (n = 129) | P ∗ |
|---|---|---|---|
| Inner glial limiting membrane | 5.69 ± 2.01 | 5.68 ± 1.72 | .563 |
| Retinal nerve fiber layer | 6.06 ± 1.90 | 6.26 ± 1.80 | .036 |
| Ganglion cell layer | 6.30 ± 1.89 | 6.49 ± 1.86 | .011 |
| Inner plexiform layer | 6.64 ± 1.95 | 6.77 ± 1.92 | .016 |
| Inner nuclear layer | 7.39 ± 1.94 | 7.14 ± 1.90 | .033 |
| Outer plexiform layer | 7.17 ± 1.93 | 7.31 ± 1.91 | .028 |
| Outer nuclear layer | 7.89 ± 1.91 | 7.95 ± 1.92 | .085 |
| Outer glial limiting membrane | 8.20 ± 1.90 | 8.25 ± 1.96 | .220 |
| Photoreceptors | 8.26 ± 1.98 | 8.29 ± 1.95 | .139 |
| Retinal pigment epithelium | 8.58 ± 1.88 | 8.63 ± 1.89 | .397 |
Stay updated, free articles. Join our Telegram channel

Full access? Get Clinical Tree


