Purpose
To objectively quantify choroidal thickness and choroidal volume using fully automated choroidal segmentation software applied to images obtained from enhanced depth imaging spectral-domain optical coherence tomography (EDI SD OCT) in a population-based study; and evaluate the ocular and systemic determinants of choroidal thickness and choroidal volume.
Design
Prospective cross-sectional study.
Methods
Participants ranging in age from 45 to 85 years were recruited from the Singapore Malay Eye Study-2 (SiMES-2), a follow-up population-based study. All participants (n = 540) underwent a detailed ophthalmic examination, including EDI SD OCT for measurements of thickness and volume of the choroid.
Results
The intrasession repeatability of choroidal thickness at 5 measured horizontal locations and macular choroidal volume using automated choroidal segmentation software was excellent (intraclass correlation coefficient, 0.97-0.99). Choroid was significantly thicker under the fovea (242.28 ± 97.58 μm), followed by 3 mm temporal (207.65 ± 80.98 μm), and was thinnest at 3 mm nasal (142.44 ± 79.19 μm) location. The mean choroidal volume at central macular region (within a circle of 1 mm diameter) was 0.185 ± 0.69 mm 3 . Among the range of ocular and systemic factors studied, age, sex, and axial length were the only significant predictors of choroidal thickness and choroidal volume (all P < .05).
Conclusions
Using a new automated choroidal segmentation software, we provide fast, reliable, and objective measurements of choroidal thickness and volume in a population-based sample. Male sex, younger age, and shorter axial length are the factors independently associated with thicker choroid and larger choroidal volume. These factors should be taken into consideration when interpreting EDI SD OCT–based choroidal thickness measurements in clinics.
The choroid contributes blood supply to the outer retina and is therefore associated with the pathogenesis of major diseases of the posterior segment of the eye. Until recently, the choroid was imaged by invasive techniques with limited image resolution. Although the use of enhanced depth imaging (EDI) in spectral-domain optical coherence tomography (SD OCT) is noninvasive and has now allowed visualization of the choroidal structure in detail, the quantification of choroidal thickness for evaluating chorioretinal diseases is mostly performed manually and often at 1 or few points around the foveal center.
Owing to unavailability of automated choroidal segmentation software, previous investigators have used a manual (mostly single-point) measurement technique using built-in calipers to evaluate choroidal thickness. However, measurements of a few sampling points are influenced by focal thickening or thinning of the choroid, or by irregularity of the inner chorioscleral border, and thus are highly dependent on location of measurements. In addition, manual methods are further subject to intra- and interobserver variation. Given the high anatomic variability of choroid, these are impractical for clinical use and epidemiologic research involving large samples, which makes the measurements tedious and time consuming. Thus, an objective and comprehensive assessment of the choroid, such as choroidal thickness maps and volumetric analysis, is required but is still unavailable.
A few studies have calculated choroidal volume using the built-in software. However, the segmentation of the choroid-scleral interface (CSI) is still done manually. For EDI SD OCT to become a clinically practical tool to determine choroidal thickness, an automatic and accurate measurement algorithm must be developed.
This study used new, fully automated choroidal segmentation software to objectively quantify choroidal thickness and choroidal volume in the macular area, acquired using EDI SD OCT in a population-based setting. We aimed to obtain accurate distribution of choroidal thickness and choroidal volume and to determine their associations with ocular and systemic determinants at the macula. In addition, we also assessed the intrasession repeatability of both choroidal thickness and choroidal volume measures.
Subjects and Methods
Study Population
Data for this analysis were derived from the Singapore Malay Eye Study-2 (SiMES-2), a comprehensive, detailed population-based cohort study of 3280 Singaporean Malay adults aged 45-85 years. Details of the baseline study design, sampling plan, and methodology (SiMES-1 2004-2006) have been reported elsewhere. The follow-up examination, SiMES-2, started from 2011 and is ongoing. For this analysis, we enrolled consecutive participants of the SiMES-2 from February 2012 to April 2013. Participants recruited in SiMES-2 underwent standardized and detailed ophthalmic examination, including Spectralis EDI SD OCT. Ethics approval was obtained from the institutional review board (IRB) of the Singapore Eye Research Institute, and the IRB approved a protocol for the prospective study. The study was conducted in accordance with the World Medical Association’s Declaration of Helsinki. Written informed consent was obtained from all subjects.
Enhanced Depth Imaging Optical Coherence Tomography Image Acquisition Protocol
Choroidal thickness was obtained using SD OCT (Spectralis; Heidelberg Engineering, Heidelberg, Germany) with EDI modality after pupil dilation using tropicamide 1% and phenylephrine hydrochloride 2.5%. A 7-horizontal-line scan (30 × 5 degrees) centered on the fovea was performed, with 100 frames averaged in each B-scan. Each scan was 8.9 mm in length and spaced 240 μm apart from each other.
All OCT scans were acquired by a single examiner (P.G.), who is experienced at performing scans using EDI-Spectralis. After each capture, each of 7 B-scans was scrutinized manually in each eye by the same examiner (P.G.), and images that had motion artifacts (n = 14) or were poorly focused (n = 26) were excluded from the analysis. Measurements of both eyes of each study participant were obtained. However, because of intereye correlation issues, only the right eye was used for this analysis.
Measurements of Choroidal Thickness and Volume
Following Spectralis user manual guidelines, subjects’ keratometry readings and the most recent refraction were entered into the software program to estimate optical magnification and, therefore, to allow for more accurate comparisons across individuals. The choroidal thickness at each location was defined as the distance between the Bruch membrane (lower boundary of retinal pigment epithelium [RPE]) and the CSI. In our study, Bruch membrane and CSI were delineated with the automatic segmentation algorithm developed by Tian and associates. The authors evaluated the accuracy of their algorithm with the ground truth (manual measurement of choroidal thickness) and demonstrated good consistency between the manual labelings and their algorithm (the average of the Dice coefficients over 45 tested images was 90.5% with standard deviation of 3%).
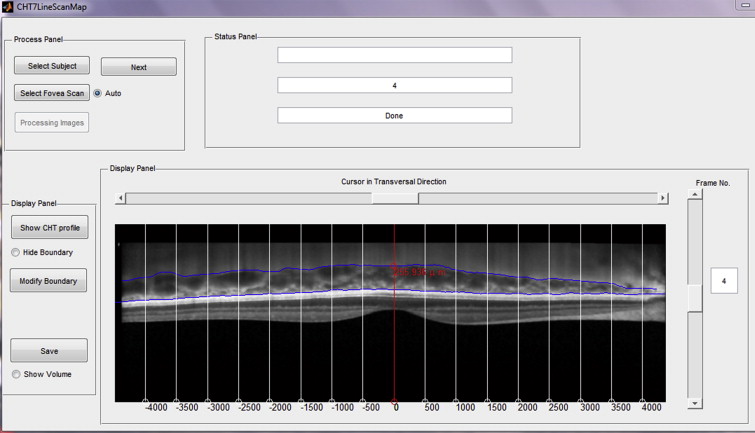
In our study, from the 7-horizontal-line scan, the line passing through the fovea was selected by an experienced examiner and the center of the fovea was detected as the lowest point of internal limiting membrane automatically. The choroidal thickness profile at the fovea and at 500-μm intervals up to 3 mm temporal and nasal to the fovea in horizontal section ( Supplemental Figure ; available at AJO.com ) was then automatically measured and created. Figure 1 shows an example of an EDI SD OCT scan of the macula with the automated segmentation lines. Furthermore, the choroidal volume of the 7-line scan (8.9 mm × 1.5 mm) of the region {(x,y)| −3 mm < x < 3 mm, 720 μm < y < 720 μm} was calculated with the automatically detected fovea as the center of origin, (0,0), and the measurement points between lines were measured with linear interpolation as illustrated in Figure 2 . In addition, choroidal volume in a 1-mm-diameter circle at the fovea and thickness maps were obtained for all subjects.

Assessment of Repeatability of Automated Measurements
To access the intrasession repeatability using EDI SD OCT and automated choroidal segmentation software, images from the same eye of 20 subjects were obtained twice at an interval of 10 minutes. Two images from the same eyes were each measured by segmentation software to assess the repeatability of choroidal thickness and choroidal volume measurements.
Measurement of Ocular Factors
All participants underwent a standardized examination procedure. The refraction of each eye was measured using an autorefractor (Canon RK 5 Auto Ref-Keratometer; Canon Inc Ltd, Tochigiken, Japan). Spherical equivalent (SE) was calculated as the sum of the spherical power and half of the cylinder power. Best-corrected visual acuity (BCVA) was measured monocularly using a logarithm of the minimal angle of resolution (logMAR) chart (Lighthouse International, New York, New York, USA) at a distance of 4 m. Biometry measurements (ie, axial length [AL], corneal curvature, and anterior chamber depth [ACD]) were measured with noncontact partial coherence laser interferometry (IOL Master V3.01; Carl Zeiss Meditec AG, Jena, Germany) and the mean of 5 measurements was used in the analysis. Intraocular pressure (IOP) was measured using Goldmann applanation tonometry (Haag-Streit, Bern, Switzerland) before pupil dilation. Central corneal thickness (CCT) was measured with an ultrasound pachymeter (Advent; Mentor O & O, Norwell, Massachusetts, USA) and the mean of 5 measurements was used in the analysis.
Assessment of Demographic, Lifestyle, and Systemic Factors
All study participants underwent a detailed interview using standardized questionnaires. Information on demographic status, lifestyle risk factors (eg, smoking, alcohol consumption), medication use, and self-reported history of systemic diseases such as arterial hypertension and diabetes mellitus were collected. Systolic and diastolic blood pressures (BP) were measured using a digital automatic blood pressure monitor (Dinamap model Pro Series DP110X-RW, 100V2; GE Medical Systems Information Technologies, Inc, Milwaukee, Wisconsin, USA), after subjects were seated for at least 5 minutes with legs uncrossed. A total of 3 measurements were taken, and the average of the 2 closest BP readings was taken as each participant’s BP. Mean ocular perfusion pressure (OPP) was calculated using the following equation: mean OPP = (2/3 × MAP – IOP), where MAP (mean arterial pressure) = diastolic BP + (1/3 × [systolic BP – diastolic BP]). Systolic and diastolic OPP were calculated using the following equations: systolic OPP = systolic BP – IOP and diastolic OPP = diastolic BP –IOP, respectively. Body mass index (BMI) was calculated as body weight (in kilograms) divided by body height (in meters) squared. Smoking status was defined as those currently smoking, ex-smokers, and nonsmokers. Nonfasting venous blood samples were analyzed at the National University Hospital Reference Laboratory for biochemical testing of serum total cholesterol, high-density lipoprotein (HDL) cholesterol, low-density lipoprotein (LDL) cholesterol, triglycerides, glycosylated hemoglobin (HbA1c), glucose, and creatinine.
Statistical Analysis
Statistical analysis was performed using MedCalc version 12.3 (Medcalc Software, Ostend, Belgium) and SPSS version 20.0 (SPSS, Inc, Chicago, Illinois, USA). Univariate and multiple linear regression analyses were performed to determine the associations of subfoveal choroidal thickness and choroidal volume (dependent variables) with ocular and systemic factors (independent variables). For multiple linear regression, factors showing suggestively significant association in univariate analysis ( P < .10) were included. Eyes with other ocular diseases, such as refractive errors, cataract, glaucoma, and retinopathy, were not excluded if the quality of OCT image was sufficient to be evaluated, as we aimed to determine the choroidal thickness distribution in a general population sample. In the assessment of associations with ocular and systemic factors, we included glaucoma status, diabetic retinopathy, and age-related macular degeneration in the regression models to adjust for potential confounding.
The intrasession repeatability of the choroidal thickness and choroidal volume were measured by the absolute agreement model of the intraclass correlation coefficient (ICC). An ICC value of 0.81-1.00 indicates good agreement. Values of less than 0.40 indicate poor to fair agreement. We also performed Bland-Altman plot analyses to see the mean difference between the repeated measurements. All P values were 2-sided and considered statistically significant when the values were less than .05; 95% confidence intervals (CIs) were presented.
Results
A total of 540 eyes from 540 consecutive subjects (251 men and 289 women) with a mean (SD) age of 62.70 (8.91) years were included in the study. In none of the images did the automated software fail to detect the RPE and choroidal borders; therefore, no eyes were excluded from the analysis. The demographics and ocular and systemic characteristics of the study population are shown in Table 1 .
| Characteristic | Value (N = 540 Subjects) |
|---|---|
| Age (y) | 62.70 (8.91) |
| Sex, male | 251 (46.5) |
| Axial length, mm | 23.59 (0.96) |
| Anterior chamber depth, mm | 3.17 (0.34) |
| Corneal curvature, mm | 7.66 (0.24) |
| Spherical equivalent, D | 0.11 (1.74) |
| Best-corrected visual acuity, logMAR | 0.16 (0.20) |
| Central corneal thickness, μm | 541.76 (35.15) |
| Intraocular pressure, mm Hg | 14.49 (3.10) |
| Ocular perfusion pressure, mm Hg | 55.55 (8.19) |
| Systolic blood pressure, mm Hg | 139.56 (19.68) |
| Diastolic blood pressure mm Hg | 76.90 (10.66) |
| Mean arterial pressure, mm Hg | 97.78 (12.37) |
| Body mass index, kg/m 2 | 26.87 (5.07) |
| Serum glucose, mmol/L | 7.22 (3.52) |
| HbA1c, % | 6.35 (1.43) |
| Total cholesterol, mmol/L | 5.36 (1.29) |
| Triglycerides, mmol/L | 1.92 (1.30) |
| Blood creatinine, mmol/L | 83.23 (41.23) |
| Current smoking, % | 98 (18.1) |
| Diabetes mellitus, % | 143 (26.5) |
| Arterial hypertension, % | 323 (59.8) |
| Alcohol consumption, % | 7 (1.3) |
Table 2 shows the intrasession repeatability of measurements of choroidal thickness and choroidal volume using automated choroidal segmentation software. Repeatability of choroidal thickness at 5 measured horizontal locations and macular choroidal volume was excellent (ICC ranging from 0.97 to 0.99).
| Locations of Measurement | Intraclass Correlation (95% Confidence Interval) | Mean Difference a (95% Limits of Agreement) |
|---|---|---|
| Choroidal thickness | ||
| Subfoveal | 0.996 (0.992-0.998) | −0.4 (−21.5 to 20.7) |
| Nasal, 1.5 mm | 0.992 (0.981-0.997) | −2.1 (−29.1 to 24.9) |
| Nasal, 3 mm | 0.996 (0.991-0.998) | 1.6 (−15.6 to 18.8) |
| Temporal, 1.5 mm | 0.995 (0.989-0.998) | 0.1 (−26.2 to 26.4) |
| Temporal, 3 mm | 0.979 (0.949-0.992) | 0.5 (−38.2 to 39.2) |
| Choroidal volume of 7-line scan (8.9 mm × 1.5 mm) | 0.999 (0.997-0.999) | 0.0 (−0.08 to 0.09) |
a Mean difference was determined from the first measurement minus second measurement.
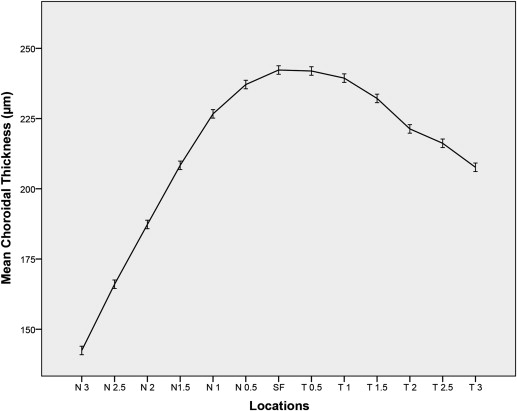
Table 3 shows the mean choroidal thickness and choroidal volume. Choroidal thickness was measured at 13 different locations on the horizontal axis ( Figure 3 ). Choroid was thickest at the subfovea (242.28 ± 97.58 μm), followed by temporal, and thinnest at the 3 mm nasal (142.44 ± 79.19 μm) location (which is the last point measured using the software). The mean macular (1 mm diameter) and 7-line-scan choroidal volume were 0.185 ± 0.071 mm 3 and 1.889 ± 0.69 mm 3 , respectively.
| Location of Measurements | Mean (SD) |
|---|---|
| Choroidal thickness in μm | |
| Subfoveal | 242.28 (97.58) |
| Nasal, 0.5 mm | 237.11 (97.72) |
| Nasal, 1 mm | 226.68 (98.10) |
| Nasal, 1.5 mm | 208.35 (98.20) |
| Nasal, 2 mm | 187.29 (94.21) |
| Nasal, 2.5 mm | 166.02 (89.72) |
| Nasal, 3 mm | 142.44 (79.19) |
| Temporal, 0.5 mm | 241.93 (96.58) |
| Temporal, 1 mm | 239.39 (92.83) |
| Temporal, 1.5 mm | 232.17 (89.42) |
| Temporal, 2 mm | 221.31 (84.12) |
| Temporal, 2.5 mm | 216.19 (81.93) |
| Temporal, 3 mm | 207.65 (80.98) |
| Choroidal volume in mm 3 | |
| Choroidal volume of 7-line scan (8.9 × 1.5 mm) | 1.889 (0.693) |
| Choroidal volume at central macula (within 1-mm-diameter circle) | 0.185 (0.071) |
In the univariate analysis ( Table 4 ), among the ocular factors only SE and AL showed significant association with subfoveal choroidal thickness (both P < .001). For each 1-mm increase in AL, subfoveal choroidal thickness on average decreased by 19.63 μm ( P < .001). A decrease in mean choroidal thickness by 10.77 μm was observed for each myopic diopter increase ( P < .001). Among the systemic factors, younger age, male sex, higher serum cholesterol or triglyceride levels, current smoking, and lack of arterial hypertension were found to be significantly associated with thicker subfoveal choroidal thickness (all P < .05).
| Univariate Analysis | Multivariate Analysis a | |||||
|---|---|---|---|---|---|---|
| Unstandardized Beta Coefficient | Standardized Beta Coefficient | P Value | Unstandardized Beta Coefficient | Standardized Beta Coefficient | P Value b | |
| Ocular factors | ||||||
| Spherical equivalent, D | 10.773 | 0.192 | <.001 | – | – | – |
| Axial length, mm | −19.638 | −0.197 | <.001 | −32.111 | −0.317 | <.001 b |
| Corneal curvature, mm | −33.037 | −0.084 | .063 | 20.160 | 0.051 | .303 |
| Anterior chamber depth, mm | 0.870 | 0.003 | .944 | – | – | – |
| Central corneal thickness, μm | 0.164 | 0.059 | .170 | – | – | – |
| Intraocular pressure, mm Hg | 0.473 | 0.015 | .727 | – | – | – |
| Ocular perfusion pressure, mm Hg | 0.269 | 0.023 | .600 | – | – | – |
| Systemic factors | ||||||
| Age, y | −3.104 | −0.284 | <.001 | −4.139 | −0.366 | <.001 b |
| Sex (female vs male) | −19.432 | −0.099 | .021 | −30.869 | −0.158 | .001 b |
| Mean arterial pressure, mmHg | 0.172 | 0.022 | .612 | – | – | – |
| Body mass index, kg/m 2 | −1.233 | −0.064 | .137 | – | – | – |
| Serum glucose, mmol/L | 0.556 | 0.020 | .651 | – | – | – |
| HbA1c, % | 3.230 | 0.047 | .279 | – | – | – |
| Total cholesterol, mmol/L | 9.110 | 0.121 | .005 | 4.495 | 0.060 | .163 |
| Triglycerides, mmol/L | 7.209 | 0.096 | .027 | 4.180 | 0.057 | .185 |
| Blood creatinine, mmol/L | −0.035 | −0.015 | .734 | – | – | – |
| Current smoking, (yes vs no) | 36.601 | 0.145 | .001 | −1.028 | −0.004 | .930 |
| Diabetes mellitus, (yes vs no) | 1.472 | 0.007 | .878 | – | – | – |
| Arterial hypertension, (yes vs no) | −21.077 | −0.106 | .014 | −3.723 | −0.019 | .678 |
| Alcohol consumption, (yes vs no) | 34.549 | 0.040 | .353 | – | – | – |
Stay updated, free articles. Join our Telegram channel

Full access? Get Clinical Tree


