Development of Color Vision in Infants
Israel Abramov
James Gordon
Color vision is often ignored in clinical practice because it is assumed that even if a deficit is found, nothing can be done about it. No magical glasses can be prescribed.
It is important, however, to understand the topic and to test infants for color vision: Specific color deficits are often early markers for other diseases. For example, S-cone deficits are associated with diabetes, retinopathies, and dementias (1,2). Also, teaching aids for preschoolers are often color-coded and scholastic tests in the pre-K range include correct use of color names. A toddler who has problems with color vision may fail to use color names correctly, which can be wrongly ascribed to cognitive problems.
To understand infants’ color vision, we must first understand the mechanisms of normal adult color vision. Only then can we examine whether color vision exists in infants, whether it is innate, and how it compares with adult color vision.
Basic Requirements for Color Vision
Color vision is the ability to discriminate lights of different spectra, regardless of their relative intensities. For example, consider a bi-partite field illuminated on the left with one wavelength and on the right with another wavelength (Fig. 8.1A). If the observer can adjust the intensity of the right side so that it appears the same as the left (cannot be distinguished from it), then that observer does not have complete color vision as do most of the general human population.
An observer with any form of color vision must have at least two types of receptors whose spectral sensitivities are different. This derives from the univariance of visual receptors. Each receptor contains a photopigment whose mole- cules absorb incident photons; each photon that is absorbed initiates a small electrical signal; this receptor signal is the same for any photon that is absorbed. The magnitude of the electrical signal is simply related to the total number of photons that the receptor’s pigment absorbs. Wavelength determines only the probability that a photon will be absorbed; once the photon is absorbed, response is independent of wavelength.
Figure 8.1A shows the spectral sensitivity curve of a single type of receptor; in this case, a human adult’s L-cone; the curve shows the percentage of incident photons that will be absorbed (for simplicity, the curve is set at 100% at its “best” wavelength, although in a real receptor that amount would be considerably less than 100%). The field is illuminated on the left with light of wavelength 590 nm and on the right with 630 nm. Initially, if the same number of photons is delivered at each wavelength, the two sides will appear different, simply because the receptors illuminated by the light on the left will absorb a greater percentage of 590-nm photons than will the receptors illuminated by 630-nm photons. An example is given in the inset table (with the
caution that the numbers are only for illustrative purposes; it is physically impossible to guarantee delivery of an exact number of photons). If the number of photons is readjusted to take into account the differences in percentages absorbed, however, the numbers absorbed by the receptors on each side will be the same, the electrical signals from receptors on each side will be the same, and the two sides will appear identical.
caution that the numbers are only for illustrative purposes; it is physically impossible to guarantee delivery of an exact number of photons). If the number of photons is readjusted to take into account the differences in percentages absorbed, however, the numbers absorbed by the receptors on each side will be the same, the electrical signals from receptors on each side will be the same, and the two sides will appear identical.
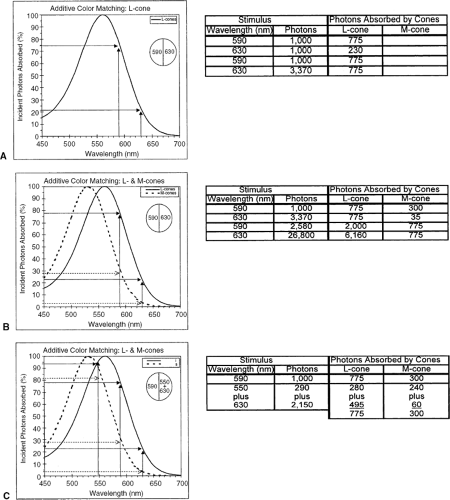 Figure 8.1 Photopigments and additive color matching. Bi-partite stimulus field illuminated on the left with a light of 590 nm; participant adjusts intensity of light on the right (matching field) to make the two half-fields appear identical. Tables show the numbers of photons incident on the cones, and the numbers absorbed. A: Assuming all the cones contain the same photopigment, as shown, the intensity of the matching field can be adjusted to produce the same number of absorptions from both half-fields. B: Assuming the participant has the two cone types shown and that they are equally distributed across the entire field, the intensity of the matching field can be adjusted to equate the two sides for either one or the other cone type, but not simultaneously for both. C: Same as (B), except that the matching field is an additive mix of two wavelengths; these can be adjusted separately so that the total numbers absorbed by each cone type are the same across the entire field. (Based on Gordon J, Abramov I. Color vision. In: Goldstein EB, ed. The Blackwell Handbook of Perception, Ch. 4. Oxford, UK: Blackwell; 2001:92–127 .) |
Only if the two sides of the field illuminate two different types of receptor will it be impossible to make the two sides appear the same simply by readjusting intensity. This is illustrated in Figure 8.1B, which shows spectral sensitivities of two adult cone types: M- and L-cones. From the table with the figure, it can be seen that the numbers of photons delivered on each side can be adjusted either to equate them for absorptions by the M-cones or by the L-cones. It is impossible, however, to adjust intensities so that each cone type on each side of the field simultaneously absorbs the same number of photons, which is what is needed for the two sides to appear identical. If a second wavelength is introduced on one side, however, a match is possible. Figure 8.1C shows the addition of photons of 550 nm to the photons of 630 nm on the right side. Now, the intensities of these two wavelengths can be separately adjusted so that the receptors on the right absorb some photons at one wavelength and some at the other wavelength such that the total number of photons absorbed by each receptor type is the same as the numbers absorbed by the receptors from the single wavelength presented on the left. The two sides match!
What do we mean by “match?” To most adults, light of 590 nm “looks” yellow, 550 nm looks green, and 630 nm looks red. Once the match is made, both sides appear identical and both appear yellow, although physically the stimuli are very different. The appearance of a light is a sensory response and is the result of processing by a particular nervous system. Chromatically different stimuli that elicit identical sensory responses are referred to as metamers.
Additive color mixing of the sort described above tells how many independent dimensions are needed to describe a particular form of color vision. The light(s) that are combined to make a match are referred to as primaries, and the number of primaries corresponds to the number of dimensions. If all receptors have the same photopigment, only one primary is needed to match all other lights (Fig. 8.1A) and such an observer is described as a monochromat. (Note that most humans are monochromats when they are fully dark-adapted and vision is governed only by the rods, all of which contain the same photopigment.). If two primaries are needed (Fig. 8.1C), the observer is a dichromat, and if three are needed the observer is a trichromat.
Adult Color Vision
Trichromacy
The normal human retina has four distinct populations of receptors: rods and three types of cone whose spectral sensitivities are shown in Fig. 8.2A. The curves are for a situation in which the same numbers of photons at each wavelength is delivered to the retinal receptors; the cones are labeled S, M, L for the simple reason that one is more sensitive to longer wavelengths, one to middle wavelengths, and one to shorter wavelengths. The wavelengths of maximal sensitivity of the different cone types are approximately 430, 530, and 560 nm. Figure 8.2B shows the same receptor functions, but now in terms of equal numbers of photons at each wavelength delivered to the cornea. Sensitivity to the shorter wavelengths seems greatly depressed. This is an artifact caused by the usual procedure in psychophysical studies of color vision in which the light stimulus is measured at the cornea: the ocular media, especially the lens, absorb many of the shorter wavelength photons before they reach the retina and so these lights seem less effective for vision; of course, one can allow for this by readjusting the number of photons delivered to the cornea (more on this later).
Because receptors are sensitive to some degree to the entire spectrum, it is misleading to refer to cones as red, green, or blue receptors; all receptors are simply light receptors. For wavelengths longer than about 520 nm, however,
the S-cones are so insensitive compared with L- and M-cones that these longer wavelengths effectively stimulate only the latter two types of cones; thus, anyone with normal color vision is a dichromat when the spectrum is limited to middle and long wavelengths. And, that is why a color-normal observer can make the match shown in Figure 8.1C: 590 nm = 550 nm + 630 nm, which is known as the Rayleigh match, enshrined in the Nagel anomaloscope. The necessary ratio of intensities of the 550 and 630nm lights is determined by the exact form of the L- and M-cone spectra (see Fig. 8.1C), which makes the anomaloscope a useful diagnostic tool; any significant deviation from the settings of the general population means that the observer has cones with unusual spectra. A genetic dichromat who lacks either M- or L-cones only has one photopigment in the spectral range of the anomaloscope; that person is effectively a monochromat over this range and so can match 590 nm with any ratio of 530 + 560 nm lights.
the S-cones are so insensitive compared with L- and M-cones that these longer wavelengths effectively stimulate only the latter two types of cones; thus, anyone with normal color vision is a dichromat when the spectrum is limited to middle and long wavelengths. And, that is why a color-normal observer can make the match shown in Figure 8.1C: 590 nm = 550 nm + 630 nm, which is known as the Rayleigh match, enshrined in the Nagel anomaloscope. The necessary ratio of intensities of the 550 and 630nm lights is determined by the exact form of the L- and M-cone spectra (see Fig. 8.1C), which makes the anomaloscope a useful diagnostic tool; any significant deviation from the settings of the general population means that the observer has cones with unusual spectra. A genetic dichromat who lacks either M- or L-cones only has one photopigment in the spectral range of the anomaloscope; that person is effectively a monochromat over this range and so can match 590 nm with any ratio of 530 + 560 nm lights.
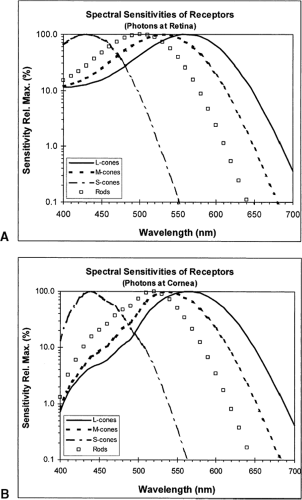 Figure 8.2 Spectral sensitivities of the four types of receptors in the human retina: rods and three types of cones (L-, M-, and S-cones). A: Sensitivities when the same numbers of photons at each wavelength are delivered directly to the receptors. B: Sensitivities of the same receptors when equal numbers of photons are delivered to the cornea. The differences at the shorter wavelengths are caused by losses in light transmission through the ocular media. |
The Rayleigh match is deliberately limited to part of the spectrum because most color defects, especially of the genetic variety, involve only M- and L-cones. A person lacking L-cones is termed a protanope, one lacking M-cones is a deuteranope, and one lacking S-cones (a very rare person) is a tritanope. A normal adult has three classes of cones and is a trichromat; to match all possible lights, that individual needs to mix three primaries in the additive mixing field. Thus, merely making a normal Rayleigh match does not guarantee trichromacy; a tritanope, is a dichromat, but has the usual M- and L-cones and so would make normal Rayleigh matches.
Although we will continue to refer to three types of cone, it should be noted that this is not strictly correct. In fact, multiple forms of the genes exist that code for the L- and M-cone photopigments and many individuals express multiple forms (3,4). All individuals with normal color vision, however, still require only three primaries to match all other lights; regardless of how many different L- and M-cones we have, we are still rigorously trichromats, meaning that somehow the nervous system must combine signals from the variants of each cone type into signals that behave as if they came from single cone types (5).
Neuronal Color Channels
Possession of different cones does not, by itself, guarantee color vision. There must also be a nervous system that compares the responses of the various cones to assess which responded more strongly and, thereby, gain information about the portion of the spectrum that stimulated the retina.
We start with retinal ganglion cells because they represent the output after all the processing at the level of the retina. Responses of
ganglion cells in the primate retina can be divided into two broad classes: spectrally opponent and spectrally nonopponent types. As with all ganglion cells in the higher mammals, they have circular receptive fields with concentric zones of excitation and inhibition; they are all spatially opponent, but what matters for color vision is which receptors drive these antagonistic responses. Two examples of the different organizations are shown in Fig. 8.3.
ganglion cells in the primate retina can be divided into two broad classes: spectrally opponent and spectrally nonopponent types. As with all ganglion cells in the higher mammals, they have circular receptive fields with concentric zones of excitation and inhibition; they are all spatially opponent, but what matters for color vision is which receptors drive these antagonistic responses. Two examples of the different organizations are shown in Fig. 8.3.
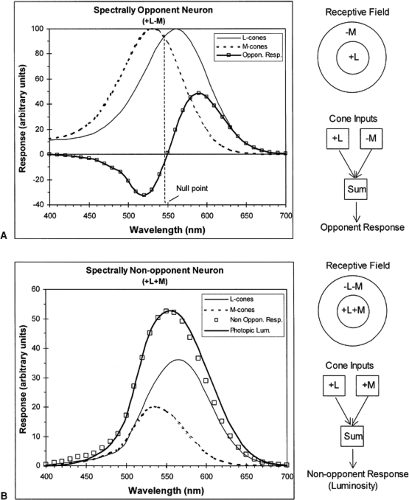 Figure 8.3 Spectral responses of two types of primate ganglion cells to lights of equal intensities covering their entire receptive fields. A: Spectrally opponent neuron that combines equally weighted responses of L- and M-cones, where one excites the neuron (+L) and the other inhibits it (-M). Spatial organization of the receptive field is on upper right; lower right shows a schematic combination of the responses of the two cone types. B: Spectrally nonopponent neuron that combines, with the same signs, the responses of the L- and M-cones. Spectral responses of the neuron to the cone inputs weighted as shown, closely matches the Commission Internationale de l’Eclairage (CIE) photopic luminosity function, Vλ. (Redrawn from Gordon J, Abramov I. Color vision. In: Goldstein EB, ed. The Blackwell Handbook of Perception, Ch. 4. Oxford, UK: Blackwell; 2001:92–127. ) |
Both examples deal only with responses driven by L- and M-cones. Although these cones are more or less uniformly interspersed across each region of the retina, the responses from each of the receptive field’s concentric zones can be strongly biased toward one or the other cone type. Thus, for the spectrally opponent neuron in Fig. 8.3A, the center’s excitatory responses are driven by L-cones, whereas M-cones drive the inhibitory inputs that predominate in the surround. This neuron is reporting the net sum of its cone inputs (by convention, excitatory inputs are positive and inhibitory ones are negative). The result is that the neuron’s responses are spectrally opponent; a monochromatic light that covers the receptive field elicits one type of response for wavelengths to which the L-cone is the more sensitive, and the opposite sort of response when the M-cone is the more sensitive. Note, that a point in the spectrum exists to which this neuron does not respond, the point at which the L-and M-cones are equally sensitive so that their opposed inputs cancel. The location of this null point depends on the relative strengths of the L- and M-cone inputs to the particular cell.
By contrast, the neuron in Fig. 8.3B is spectrally nonopponent: both L-and M-cones contribute to responses of the excitatory center and the inhibitory surround so that any wavelength elicits the same type of response. In this example, it is assumed that L-cones are weighted more strongly and that the excitatory center is stronger than the surround, leading to the spectral responses shown.
The axons of the ganglion cells form the optic nerves that terminate in the lateral geniculate nucleus (LGN) of the thalamus. In primates (e.g., humans and macaque monkeys, species with very similar color vision), the LGN is a distinctively layered structure. The upper layers are termed parvocellular and the cell bodies of their neurons are small generically; they are called P-cells. The lower layers are magnocellular, cells that have larger bodies, called M-cells (beware of the distinction between M-cell and M-cone). A new category of very small cells, lying between some of the layers, has recently been described: these are termed koniocellular (K-cells) (6).
In macaques, all P-cells and some K-cells are spectrally opponent, whereas M-cells are spectrally nonopponent. All these cells have a spontaneous rate of firing action potentials in the absence of any light stimulus; excitation is signaled by an increase in firing rate from spontaneous, whereas inhibition is signaled by a decrease. The spectrally opponent cells can be divided into four subtypes, based on their spectral responses to monochromatic lights (7,8). Differences in the signs and relative weights of cone-derived inputs determine the particular responses: two (P-cells) are driven only by L- and M-cones, but with reversed signs (+L-M and +M-L), and the other two (K-cells) are driven by all three cone types (S vs. L+M). M-cells fall into two basic classes: some are excited to some degree by all wavelengths, whereas others are inhibited by all wavelengths; however, both types are driven only by L- and M-cones under light-adapted (photopic) conditions and by rods under dark-adapted (scotopic) conditions (9).
Psychophysiologic Linking Hypotheses
Normal human color vision is trichromatic, which means that it is defined by three independent dimensions, such as the intensities of the three primaries needed to match additively any other light. But this simply reduces color to this set of intensity axes, or some linear transformation of them as in a standard CIE chromaticity diagram (10). The matches specify when two lights appear the same, not what they appear like—red, pink, turquoise, and so on. Many possible trios of independent dimensions could be used. Sensations of color appearance are usually described using the three dimensions of hue (red, orange, yellow, and so on), saturation (quantity of hue: is it washed out and desaturated, or pure and saturated?), and brightness (in its everyday meaning of dim vs. bright).
How do we get from responses of neurons to such sensations? We must specify the linkages, the ways in which neuronal responses must be combined, presumably at higher levels of the central nervous system, to arrive at the sensations in which we are interested (11). Several things can be stated immediately: First, only the spectrally opponent cells can signal hue; when wavelength is changed, they are the only ones
whose responses change qualitatively, rather than just quantitatively. Second, the spectrally nonopponent cells respond in the same qualitative fashion to the entire spectrum, and so can only signal some intensive aspect of the stimulus (e.g., luminosity). Indeed, the nonopponent cells are probably the entire basis for the spectral sensitivity function; when the eye is light-adapted, the sensitivity of these cells matches the psychophysical photopic luminosity function (the particular function in Fig. 8.3B is the photopic luminosity function), and when dark-adapted, their sensitivity matches the scotopic luminosity function (9).
whose responses change qualitatively, rather than just quantitatively. Second, the spectrally nonopponent cells respond in the same qualitative fashion to the entire spectrum, and so can only signal some intensive aspect of the stimulus (e.g., luminosity). Indeed, the nonopponent cells are probably the entire basis for the spectral sensitivity function; when the eye is light-adapted, the sensitivity of these cells matches the psychophysical photopic luminosity function (the particular function in Fig. 8.3B is the photopic luminosity function), and when dark-adapted, their sensitivity matches the scotopic luminosity function (9).
As far as hue is concerned, the four types of spectrally opponent LGN neurons were originally thought to underlie the four basic hue sensations of red (R), yellow (Y), green (G), and blue (B) (7). That early hypothesis, however, was incomplete. It is now clear that the responses of the LGN cells do not exactly match color appearance functions, such as those obtained from direct hue-scaling psychophysics. The LGN opponent cells, however, are the necessary inputs to higher cortical levels at which they are compared with each other and recombined to produce mechanisms that directly specify hue sensations (5,8,12, 13).
The cortical recombination of spectrally opponent LGN responses produces two generic hue mechanisms: +R-G and +Y-B (the signs are arbitrary and serve only to distinguish qualitatively opposed responses). In this model, when the +R-G hue mechanism is excited, the sensation includes red; the exact sensation depends on the simultaneous activity in the other hue mechanism, +Y-B. If both are excited, the sensation will include some red and some yellow, the precise ratio depending on the degree to which each mechanism is excited. Note that the hue mechanisms have spectral null points, at which their opposed inputs cancel each other; for example, the +R-G mechanism has such a point at approximately 575 nm. At that point, the sensation includes neither red nor green, but the other mechanism, +Y-B, is strongly excited, leading to a sensation of unique yellow. Similar comparisons apply to all the other points in the spectrum; across the spectrum, hue shades continuously from R through RY, to Y, GY, G, BG, B, and finally BR.
The final sensory dimension of saturation probably involves a comparison of responses of spectrally opponent and nonopponent neurons. For example, if only the luminosity-signaling nonopponent cells respond to some stimulus, then a sensation of light would occur, but with no hue—the stimulus would have elicited a sensation that was completely desaturated. As soon as one or more of the opponent neurons also responds, a sensation of some hue must occur, whose saturation would be determined by the total hue-signaling responses relative to all the responses elicited by the stimulus.
A genetic dichromat cannot have the same range and variation of hue sensations for the simple reason that the opponent neuronal channels can only compare responses of two cone types. One consequence is that there will be some narrow portion of the spectrum in which the responses of these two cones are equal to each other; at that point, the responses of the opponent channels will cancel each other, eliminating any sensation of hue. The only sensation at that point will be caused by nonopponent channels that will produce a sensation that is completely desaturated. Each dichromat has a spectral neutral point. The spectral region of this neutral point varies with the type of dichromacy; protanopes and deuteranopes have neutral points in the vicinity of 490 to 510 nm, with those of deuteranopes being slightly longer; tritanopes have their neutral point in the vicinity of 465 to 475 nm.
Testing Infants’ Color Vision
Infants cannot respond to verbal instructions, and their motoric and cognitive abilities are limited; their vision cannot be evaluated in the same way as that of an adult. Additionally, several a priori reasons exist why infant color vision may not be simply a miniaturized version of adult color vision. We describe first the major testing techniques and then consider some of the general problems in evaluating infants’ color vision in particular. Only then can will we be equipped to face the often contradictory findings on their color vision. The goal is to develop psychophysical and physiologic methods that relate behavior and physiology to physical stimuli.
Many of the methods were initially developed to examine infants’ capacities beyond the purely visual. We concentrate on the variants that have been used to assay color vision.
Many of the methods were initially developed to examine infants’ capacities beyond the purely visual. We concentrate on the variants that have been used to assay color vision.
Behavioral Methods
Habituation
An infant presented with a novel stimulus will “take notice” of it, usually with some sort of orienting response. Basically, a stimulus is presented over and over until it is no longer “novel” and the infant stops responding to its presentation—“habituation” has occurred. At that point, another stimulus that is physically different from the first is presented. If the infant detects the change, dishabituation occurs and the infant reorients to the changed stimulus. Discrimination thresholds can be measured by refining the change in the stimulus that is needed to elicit dishabituation.
Orienting responses, especially in very young infants, are based mostly on eye movements. In most studies, an eye-tracking apparatus is not used and infant’s gaze is assessed by experienced testers looking carefully at the infant’s face when a stimulus is presented and, typically, there is acceptable agreement among testers. Usually, one measures the amount of time spent looking at the stimulus before looking away. Habituation is indicated by a short latency to looking away and dishabituation by a subsequent increase in looking time.
For testing color vision, one method used a series of large, neutral stimuli (whites, grays) of markedly different intensities, presented in random order until the infant’s looking time dropped to some low, criterion level; because the only difference among the stimuli was intensity, it was assumed that this dimension became less “interesting.” At that point, a test stimulus was presented: either another neutral stimulus, but of an intensity not included in the habituation series, or a chromatic stimulus; dishabituation should occur if the infant perceives a change that is not simply in intensity (14,15).
Forced-choice Preferential Looking
Infants generally prefer to look at “something” rather than “nothing.” The method of forced-choice preferential looking (FPL)(16) is widely used in many forms of vision testing: the infant looks at a large, uniform field on which an optically projected test stimulus is embedded either on the left or right side. If the infant orients toward the side with the stimulus, the stimulus is assumed to be visibly different from the surrounding field for the infant.
To avoid biases caused by the tester’s knowledge of where the stimulus was presented, the tester can only see the infant’s face (directly, or on a TV monitor) and must vote, based only on the infant’s responses, where the stimulus was located (Fig. 8.4A). If the infant cannot detect the difference between the stimulus and the surround, the tester’s voting accuracy must fall to 50%; the tester’s percent correct increases as the stimulus becomes more discriminable and elicits more obvious orienting responses.
The resulting psychometric function can be used to derive a threshold (Fig. 8.4B). For example, if a test stimulus differs from the surround only in intensity (I), the function can be used to define the increment in intensity (Δ I) that produces a just noticeable difference at that value of I: some level of percent correct is chosen to represent threshold (in this two-alternative case, usually 75%) and the associated I is found by interpolation. Sensitivity is simply the reciprocal of that threshold.
To extend this approach to measuring color vision, the test stimulus can be chromatically different from the surround. Any indication of discrimination by the infant, however, may not result from a perception of a difference in hue; the chromatic stimulus may appear achromatic, but of a different intensity from the surround. The common way of ruling this out is to present the test stimulus at different intensities across trials, so that on any one trial it is above, below, or equal to the intensity of the surrounding field. The assumption is that at least one of the test intensities will match surround intensity for the individual infant being tested. Thus, if the infant is color-blind, at some stimulus the test stimulus matches the surround, and the tester’s performance will drop to chance; however, if the infant has color vision and can discriminate the test from the surround regardless of intensity, the tester should detect mostly the orienting responses (Fig. 8.4C). Choice of the set of
intensities to use is not simple; we deal with some of the issues below.
intensities to use is not simple; we deal with some of the issues below.
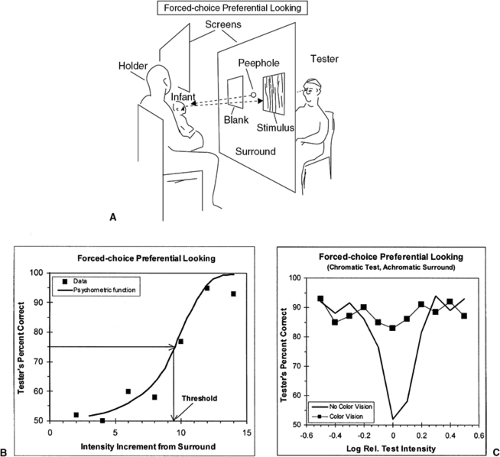 Figure 8.4 Forced-choice preferential looking psychophysical procedure. A: Typical arrangement for testing infants. Tester must choose which side of a large field contained the test stimulus based only on observation of infant’s orienting responses. To avoid biasing the infant’s behavior, the holder cannot see the stimulus array. B: Typical data showing tester’s performance when infant is presented with achromatic test stimuli of different increments above the intensity of the surround. Data are fitted with a psychometric function and threshold found by interpolation. C: Typical data for a chromatic test and an achromatic surround. One infant shows no evidence of chromatic discrimination and performance dips to chance when test and surround intensities are the same. The other discriminates test from surround at all intensities of test relative to surround and is presumed to have some form of color vision. |
A simpler variant that does not require an optical system to produce stimuli is derived from the Teller Acuity Cards (TAC) widely used to measure acuity (17). The version for testing color vision uses large gray cards with a central peephole for the tester to view the infant (18). A chromatic sample from the Munsell series of colored papers is attached on one side or other of the peephole to test whether it attracts the infant’s attention; because the tester is unaware of the side on which the test stimulus appears, the procedure still has the benefits of forced-choice psychophysics. The background cards have different gray levels to ensure that discrimination
is based only on chromatic differences between sample and the gray background (see Controlling Intensity, below).
is based only on chromatic differences between sample and the gray background (see Controlling Intensity, below).
Finally, failure to demonstrate discrimination may not be true failure to discriminate by the infant. An infant may detect a stimulus change but not prefer to look at it (19). Ideally, stimuli should be equated initially for an infant’s spontaneous preference, not an easy thing to do.
Eye Movements
Visible, moving stimuli can capture attention and elicit pursuit eye movements. This is especially so when a large part of the visual field consists of a repeating pattern drifting in one direction, as, for example, a grating moving continuously within a large aperture. Such large patterns reflexively entrain optokinetic nystagmus (OKN) with alternating phases of smooth pursuit of the pattern and return saccades (20). Such stimulus-evoked eye movements can be measured by eye-tracking optical and electronic systems, and even married to FPL: a grating of alternating black and white stripes can drift horizontally either leftward or rightward; a tester viewing only the output of the tracker must choose on each trial the direction of stimulus motion. On successive trials, the pattern can be degraded to find the threshold at which the tester no longer reliably detects the motion (21).
The above procedure can be referred to as directionally appropriate movement (DAM), and can be used to study color vision using a grating whose stripes alternated only in wavelength. A variant is the motion nulling (MN) technique, in which two gratings drift in opposite directions. Each, by itself, would elicit DAM in its direction; when both are present and equally visible, their elicited motion tendencies cancel—motion is nulled. For example, one grating might be of yellow and black bars drifting across a screen in one direction; superimposed on this, is another grating, one with blue and black bars, drifting in the opposite direction. Each direction will tend to elicit OKN in its direction. Intensity of one of the chromatic bars is varied until a motion null is found (i.e., no longer is any overt OKN present because the two gratings have been made equally visible and the opposed OKN tendencies have canceled each other). The relative intensities of the chromatic bars define the infant’s sensitivity to those wavelengths; repeating the process with other wavelengths can yield a complete spectral function (22).
Typically, the MN is found by having a tester observe the infant’s eyes and specify whether clear following eye movements occurred. Note, this method assumes that the neuronal center controlling OKN receives the same spectral information as do the other areas subserving color vision. Evidence suggests that the rules are not the same for infants and adults (23). In adults, the luminance contrast needed to detect a drifting grating is the same as the contrast needed to identify the direction of the motion; however, for isoluminant chromatic gratings, more than detection contrast is needed to identify direction. With infants, however, both the detection and direction-discrimination contrast thresholds are similar.
Metamers
When the spectral sensitivities of the receptors are known, it is possible to create, by additive combination, stimuli of different spectral content but which will elicit the same responses from the receptors (i.e., metamers can be fashioned; see Basic Requirements for Color Vision).
Infants are known to have cones at birth, but their spectral sensitivities are not necessarily known. If, however, we assume their spectral sensitivities are the same as those of adults, we can ask which, in fact, are present and functioning. If adult metamers are equivalent for the infant, then the hypothesized photopigments exist and contribute to the infant’s vision. Because four receptor types can contribute to infants’ discriminations (L-, M-, and S-cones and rods), four primary lights must be added to create complete metamers. This cumbersome arrangement can be simplified by confining the spectrum to middle and long wavelengths, as in the examples in Fig. 8.1. Now, only three primaries suffice, which can be combined to create a set of metamers for any pair of L- and M-cones, and rods; when one metamer is replaced by another spectrally different one,
any response to the change must be caused by a functioning version of the third receptor type (24). Furthermore, the magnitudes of any changes can be used to measure the spectral sensitivity of that third unmatched receptor (25).
any response to the change must be caused by a functioning version of the third receptor type (24). Furthermore, the magnitudes of any changes can be used to measure the spectral sensitivity of that third unmatched receptor (25).
More generally, the spectra of the cones can be used to define a color space (26), within which it is possible to modulate a stimulus such that only specific combinations of cones respond to the changes. For example, stimuli can be modulated only along an L/M axis: the stimuli can vary in appearance from R, through Y, to G without changing the stimulation of S-cones, which would not contribute to any discrimination.
Any of the behavioral methods described, as well as the physiologic methods discussed below, could be used to test whether adult metamers are also infant metamers at any given age.
Physiologic Methods
Many physiologic methods are available for studying sensory systems. Only two, however, have been productively applied to infant vision: the electroretinogram (ERG) and the visually evoked potential (VEP).
Electroretinogram
Recording an ERG can be invasive in that often a contact lens with an electrode is applied directly to the cornea. This records the gross potential developed across the retina in response to a light flash. Typically, to increase signal-to-noise ratio, responses are averaged across several stimulus presentations. Both response and noise amplitudes, however, are lower in infants than adults so that fewer repetitions are required.
The advantage of the ERG is that its component waveforms are well-known and can be related to specific neuronal layers. Because all the retinal neurons, except for the ganglion cells, contribute to the response, the ERGs is a good indicator of distal processing in the visual system. But this means that ERGs are rod-dominated, because most receptors are rods; obtaining cone-driven (photopic) ERGs, calls for special methods (e.g., intense backgrounds and fast flicker rates) (27).
Visually Evoked Potentials
The VEP is a much less-invasive technique; it is recorded from electrodes placed on the scalp over the visual areas of the cerebral hemispheres, usually the occipital lobe. The VEP is a special case of the electroencephalogram, which is a very noisy response and rarely shows a clear response to a single presentation of a simple visual stimulus. As with the ERG, the responses must be averaged across many trials. Because of the distance of the electrodes from the responding tissue and the complexity of cerebral architecture, it is not always obvious which areas contribute to the recorded responses and to what degree. It is widely accepted, however, that in adults VEPs, unlike ERGs, are dominated by photopic mechanisms (27).
It must also be emphasized that these methods describe particular neuronal mechanisms, and not necessarily those that underlie awareness and many of the behavioral methods. For example, when stimuli are presented on a computer monitor, flicker occurs at the frame-rate of the display; while participants are completely unaware of this flicker, their occipital VEPs will show large responses associated with the frame rate (28).
General Problems with Tests of Infants
None of the above methods is “fool-proof.” Ultimately the caveats found in virtually every paper can only be resolved by convergent lines of evidence from different studies, using different methods, and making different assumptions.
Group Functions
It is difficult to get complete data sets from every infant, mostly because of limited attention spans. Infants, therefore, are often lumped together by age to compute group average functions. Because each infant contributes only some of the data, it is difficult to estimate error variances associated with each point on a function. And even when each infant contributes an entire set of data, each infant may have been tested across several sessions on separate days. Furthermore, choosing which infants to include in an average depends on arbitrary age
boundaries for each group. For example, a group designated as 2-month-old infants could span a range of 7 to 9 weeks, variations that represent appreciable fractions of an infant’s entire existence.
boundaries for each group. For example, a group designated as 2-month-old infants could span a range of 7 to 9 weeks, variations that represent appreciable fractions of an infant’s entire existence.
Stay updated, free articles. Join our Telegram channel

Full access? Get Clinical Tree


