Purpose
To evaluate the correlation between tear film lipid layer thickness and other objective measurements such as tear film break-up time (TBUT), upper and lower meibomian gland losses, and Schirmer 1 test in patients with obstructive meibomian gland dysfunction (MGD) and normal controls.
Design
Cross-sectional study.
Methods
Thirty eyes of 30 patients with obstructive MGD and 25 eyes of 25 normal controls were enrolled. Lipid layer thickness was measured using an interferometer. Tear film stability and tear production were evaluated by TBUT and Schirmer 1 test. Upper and lower meibomian gland losses were evaluated using noncontact meibography. The correlations among variables were evaluated in the obstructive MGD group and the control group.
Results
TBUT was significantly shorter in the obstructive MGD group than in the control group ( P < .001). Upper and lower meibomian gland losses were higher in the obstructive MGD group than in the control group ( P < .001 and P < .001, respectively), and lipid layer thickness was significantly thicker in the control group than in the obstructive MGD group ( P = .028). Lipid layer thickness was significantly negatively correlated with upper and lower meibomian gland losses in both groups.
Conclusions
Lipid layer thickness objectively measured with the interferometer was significantly thicker in the control group than in the obstructive MGD group. Lipid layer thickness was negatively correlated with upper and lower meibomian gland losses in the control group as well as in the obstructive MGD group.
Meibomian gland dysfunction (MGD) is characterized by inadequate meibomian gland secretions, dry eye symptoms, and fluorescein staining of the cornea attributable to a chronic, diffuse abnormality of the meibomian glands. MGD is a well-known cause of evaporative dry eye. A lipid mixture secreted by the meibomian glands protects the ocular surface by reducing tear film evaporation. When the lipid layer is damaged or absent, tear film stability is disturbed and tear film evaporation increases. Recently, MGD was defined by the International Workshop on Meibomian Gland Dysfunction as a chronic and diffuse abnormality of the meibomian glands that is commonly characterized by terminal duct obstruction and/or qualitative/quantitative changes in the glandular secretion, and it may result in alteration of the tear film, symptoms of eye irritation, clinically apparent inflammation, and ocular surface disease.
Meibomian glands are arranged separately in a single parallel row within the tarsal plates of the upper and lower eyelids. Upper meibomian glands are larger in number than lower meibomian glands and have a longer length. Therefore, the secretory capacity of the upper meibomian glands may be larger than that of the lower meibomian glands. However, the difference in the secretory capacity between the upper and lower meibomian glands has not been evaluated. Most studies have focused on the lower meibomian glands because of the better accessibility of the lower eyelids.
Noncontact meibography is a technique to visualize the meibomian gland structure by retroillumination using an infrared filter. This technique provides information regarding meibomian gland structure, morphology change, and meibomian gland dropout. An interferometer is a device that measures tear film lipid layer thickness by assessing tear film interference. In a few previous studies, lipid layer thickness were semi-quantitatively graded from grade 1 to grade 5 based on the interference color pattern. However, the LipiView interferometer (TearScience Inc, Morrisville, North Carolina, USA) can quantitatively measure the average lipid layer thickness in 20 seconds.
This study was to evaluate the correlation between the quantitative measurements of tear film lipid layer thickness by LipiView interferometer and other objective measurements such as tear film break-up time (TBUT), upper and lower meibomian gland losses, and Schirmer 1 test in patients with obstructive MGD and normal controls.
Methods
Study Population
This cross-sectional study was conducted at the Department of Ophthalmology in the Korea University College of Medicine. Two groups of subjects, the obstructive MGD group and the control group, were enrolled between June 1, and August 31, 2012 from our institute. This study adhered to the tenets of the Declaration of Helsinki and approval for retrospective review of clinical records was obtained from the Korea University Guro Hospital Institutional Review Board.
The obstructive MGD group contained subjects with clinical signs of MGD, terminal duct obstruction, plugging of the meibomian glands, turbid secretions or turbid secretions with clumps, inflammation and swelling of the eyelid margin, vascular injection of the posterior lid margin, and symptoms of MGD for at least 3 months. Participants in the control group did not have any clinical signs and/or symptoms of MGD, dry eye, or significant ocular surface disease and were not using eye drops or eye medications. Exclusion criteria included: (1) aged less than 18 years old; (2) presence of any uncontrolled systemic diseases; (3) previous ocular surgery; (4) use of contact lens; and (5) allergic to fluorescein sodium or topical anesthetic (eg, Alcaine, proparacaine hydrochloride 0.5%).
Study Protocol
All participants completed a patient history questionnaire. Afterward, an ophthalmic examination with slit-lamp biomicroscopy was performed for observation of lid margin and meibomian gland orifices. Clinical measurements were performed in the following order to remove the effect of previous measurement on the result of the other measurements: (1) lipid layer thickness; (2) corneal and conjunctival surface staining using fluorescein; (3) TBUT; (4) Schirmer 1 test; and (5) meibography. There was at least a 10-minute rest period between each test.
Subject Examination
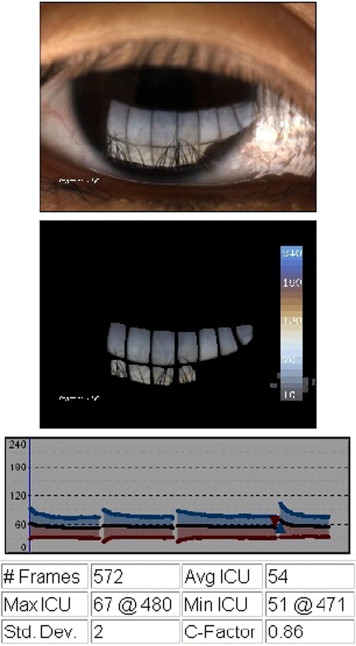
Lipid layer thickness was measured using the LipiView interferometer (TearScience Inc, Morrisville, North Carolina, USA) ( Figure 1 ). The LipiView interferometer works according to the principle of white light interferometry, and the tear film is measured using an interferometry color assessment by specular reflection. The unit of measurement is interferometry color units (ICU), which is an index of thickness and is estimated on the basis of the observed mean interference colors. Participants were seated facing the LipiView interferometer, and the chin and forehead were positioned fully forward onto the chin rest and firmly against the forehead rest. Participants were instructed to maintain fixation on the internal target (3 light-emitting diodes). Camera adjustment was conducted until the pupil appeared in the center of the live video screen and the reflected tear film image was within the green targeting rectangle. The camera focus was then adjusted for the clear tear film image. During image capture, participants were instructed to blink naturally. Image capture typically takes 20 seconds.
Grading of corneal and conjunctival surface staining was conducted according to the Oxford scoring scheme. Tear film stability was determined by TBUT using sodium fluorescein. Schirmer 1 test was conducted during 5 minutes without anesthesia.
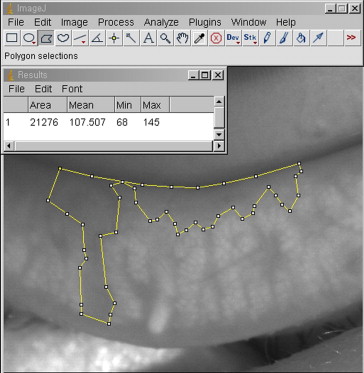
Integrity of meibomian glands was assessed using a BG-4M Non-Contact Meibography System (Topcon Corp, Tokyo, Japan). The BG-4M Non-Contact Meibography System was mounted on slit lamps. This system employs a background illumination device with an infrared light transmittance filter that illuminates the meibomian glands to assess their integrity. Photographs of meibography were quantified with ImageJ (1.43u; http://rsb.info.nih.gov/ij/ ; National Institutes of Health, Bethesda, Maryland, USA). The ratio of meibomian gland dropout area to the total area (meibomian gland loss; %) was calculated using the polygon selection tool of ImageJ ( Figure 2 ). The area of the central two-thirds on both upper and lower tarsal conjunctiva, in which meibomian glands were best visible, was selected for analysis.
To evaluate the intraobserver reliability of the LipiView interferometer, a second measurement was taken by the same examiner 10 minutes later. To assess interobserver reliability of meibomian gland dropout rate, the area of meibomian gland dropout was measured by another observer (J.S.L.). The observers were masked to the results of the other tests when measuring the area of meibomian gland dropout.
Statistical Analysis
Statistical analyses were performed using linear regression analysis, Mann-Whitney test, Fisher exact test, and Pearson correlation analysis in SPSS version 12.0 (SPSS Inc, Chicago, Illinois, USA). The intraclass correlation coefficient (ICC) was calculated to assess the intraobserver and interobserver reliability. Results were considered statistically significant if the P value was <.05.
Results
Fifty-five eyes (30 with MGD and 25 normal) were enrolled. The study included 17 male and 38 female subjects, and there was no significant difference in sex distribution between the 2 groups. Detailed data for the results of each test were summarized in Table 1 (patients with MGD) and Table 2 (normal controls). Table 3 shows the comparison of clinical characteristics between the 2 groups. The MGD group had a significantly higher Oxford score than the control group ( P = .001), and the mean lipid layer thickness in the control group (65.0 ± 19.1 ICU) was significantly thicker than that of the MGD group (54.2 ± 17.9 ICU) ( P = .028). The MGD group showed higher mean values of meibomian gland loss in the both upper (19.4 ± 14.6%) and lower meibomian glands (25.2 ± 17.5%) when compared with the control group (8.1 ± 4.4% and 10.2 ± 6.2%, respectively). The MGD group had a significantly shorter TBUT (3.3 ± 1.2 sec) than the control group (10.7 ± 7.2 sec). However, there was no significant difference in the results of Schirmer 1 test between the 2 groups.
| No. | Age, Sex | Oxford Score | LLT (ICU) | Upper MGL (%) | Lower MGL (%) | Upper and Lower MGL (%) | TBUT (sec) | Schirmer (mm) |
|---|---|---|---|---|---|---|---|---|
| 1 | 43, F | 1 | 27 | 27.2 | 24.2 | 25.7 | 1 | 6 |
| 2 | 41, M | 1 | 32 | 27.9 | 18.1 | 23.0 | 3 | 6 |
| 3 | 71, F | 0 | 33 | 21.4 | 48.1 | 34.8 | 6 | 16 |
| 4 | 27, M | 0 | 34 | 60.3 | 73.8 | 67.1 | 2 | 9 |
| 5 | 42, F | 0 | 36 | 15.5 | 41.1 | 28.3 | 4 | 11 |
| 6 | 45, F | 0 | 37 | 32.4 | 49.8 | 41.1 | 3 | 9 |
| 7 | 39, M | 0 | 39 | 45.5 | 27.7 | 36.6 | 2 | 16 |
| 8 | 64, M | 0 | 41 | 55.8 | 20.6 | 38.2 | 2 | 4 |
| 9 | 33, M | 0 | 43 | 9.9 | 15.2 | 12.6 | 4 | 24 |
| 10 | 36, F | 1 | 47 | 3.8 | 9.8 | 6.8 | 2 | 13 |
| 11 | 55, M | 0 | 48 | 9.9 | 37.3 | 23.6 | 3 | 16 |
| 12 | 34, F | 0 | 48 | 14.4 | 24.9 | 19.7 | 4 | 19 |
| 13 | 53, F | 0 | 49 | 26.9 | 37.1 | 32.0 | 3 | 13 |
| 14 | 27, M | 0 | 51 | 24.2 | 10.6 | 17.4 | 2 | 6 |
| 15 | 52, F | 0 | 52 | 11.4 | 9.5 | 10.5 | 4 | 5 |
| 16 | 36, F | 1 | 53 | 6.5 | 9.5 | 8.0 | 3 | 12 |
| 17 | 37, F | 1 | 54 | 18.3 | 46.8 | 32.6 | 3 | 7 |
| 18 | 41, F | 0 | 54 | 13.1 | 39.1 | 26.1 | 4 | 12 |
| 19 | 37, F | 1 | 54 | 24.5 | 20.7 | 22.6 | 4 | 5 |
| 20 | 59, F | 1 | 55 | 9.6 | 21.0 | 15.3 | 1 | 24 |
| 21 | 34, F | 0 | 55 | 4.1 | 23.7 | 13.9 | 3 | 10 |
| 22 | 50, F | 0 | 61 | 11.2 | 4.4 | 7.8 | 3 | 9 |
| 23 | 41, M | 1 | 66 | 3.7 | 4.9 | 4.3 | 4 | 5 |
| 24 | 57, M | 0 | 67 | 18.6 | 58.3 | 38.5 | 2 | 12 |
| 25 | 50, F | 1 | 67 | 15.4 | 5.1 | 10.3 | 3 | 11 |
| 26 | 51, F | 0 | 68 | 4.5 | 8.0 | 6.3 | 4 | 21 |
| 27 | 60, F | 1 | 75 | 5.4 | 17.4 | 11.4 | 4 | 5 |
| 28 | 53, F | 1 | 83 | 32.8 | 15.0 | 23.9 | 6 | 6 |
| 29 | 46, F | 0 | 96 | 7.7 | 11.6 | 9.7 | 4 | 9 |
| 30 | 68, F | 0 | 101 | 21.0 | 22.0 | 21.5 | 5 | 6 |
| Mean | 46.1, – | 0.4 | 54.2 | 19.4 | 25.2 | 22.3 | 3.3 | 10.9 |
| No. | Age, Sex | Oxford Score | LLT (ICU) | Upper MGL (%) | Lower MGL (%) | Upper and Lower MGL (%) | TBUT (sec) | Schirmer (mm) |
|---|---|---|---|---|---|---|---|---|
| 1 | 37, M | 0 | 41 | 1 7.2 | 19.3 | 18.2 | 10 | 7 |
| 2 | 28, M | 0 | 44 | 7.0 | 5.8 | 6.4 | 8 | 11 |
| 3 | 35, M | 0 | 45 | 16.8 | 18.6 | 17.7 | 28 | 5 |
| 4 | 25, F | 0 | 45 | 6.6 | 7.6 | 7.1 | 7 | 13 |
| 5 | 26, M | 0 | 45 | 3.2 | 16.8 | 10.0 | 26 | 14 |
| 6 | 58, F | 0 | 49 | 8.4 | 27.6 | 18.0 | 15 | 7 |
| 7 | 39, F | 0 | 51 | 13.7 | 14.0 | 13.8 | 9 | 6 |
| 8 | 26, F | 0 | 52 | 6.4 | 8.3 | 7.4 | 6 | 15 |
| 9 | 28, F | 0 | 54 | 11.4 | 3.3 | 7.3 | 7 | 7 |
| 10 | 27, F | 0 | 57 | 3.2 | 11.3 | 7.2 | 6 | 6 |
| 11 | 33, F | 0 | 58 | 12.2 | 5.6 | 8.9 | 8 | 11 |
| 12 | 30, F | 0 | 61 | 11.1 | 18.0 | 14.6 | 8 | 15 |
| 13 | 29, F | 0 | 63 | 2.3 | 11.5 | 6.9 | 7 | 19 |
| 14 | 32, F | 0 | 64 | 15.0 | 7.0 | 11.0 | 7 | 13 |
| 15 | 25, F | 0 | 69 | 6.0 | 11.7 | 8.9 | 8 | 16 |
| 16 | 32, F | 0 | 69 | 10.3 | 10.1 | 10.2 | 6 | 26 |
| 17 | 26, F | 0 | 71 | 9.3 | 3.7 | 6.5 | 5 | 22 |
| 18 | 26, F | 0 | 71 | 5.4 | 5.3 | 5.4 | 6 | 14 |
| 19 | 26, F | 0 | 71 | 8.5 | 4.2 | 6.4 | 9 | 14 |
| 20 | 29, F | 0 | 74 | 9.8 | 3.9 | 6.9 | 15 | 12 |
| 21 | 28, F | 0 | 79 | 2.4 | 5.8 | 4.1 | 30 | 8 |
| 22 | 27, M | 0 | 82 | 5.1 | 12.6 | 8.9 | 7 | 9 |
| 23 | 32, M | 0 | 93 | 3.5 | 12.7 | 8.1 | 6 | 11 |
| 24 | 31, F | 0 | 95 | 4.0 | 8.6 | 6.3 | 6 | 26 |
| 25 | 26, M | 0 | 122 | 4.4 | 2.2 | 3.3 | 17 | 14 |
| Mean | 30.4, – | 0.0 | 65.0 | 8.1 | 10.2 | 9.2 | 10.7 | 12.8 |
Stay updated, free articles. Join our Telegram channel

Full access? Get Clinical Tree


