Purpose
To find possible correlations between the morphologic macular changes revealed by fundus autofluorescence (FAF) and the functional parameters such as visual acuity and retinal sensitivity in patients with chronic central serous chorioretinopathy (CSC).
Design
Prospective, cross-sectional study.
Methods
Forty-six eyes (39 consecutive patients) with chronic CSC were studied with FAF and microperimetry (MP). Retinal sensitivity value maps were exactly superimposed over FAF images. The following microperimetric parameters were applied: central 10-degree visual field, 4-2-1 strategy, 61 stimulation spots, white monochromatic background, stimulation time 200 ms, stimulation spot size Goldmann III. A possible relationship between MP and FAF was investigated.
Results
Mean best-corrected visual acuity (BCVA) was 20/32 (median 20/25, range 20/20–20/200). BCVA was significantly correlated with FAF findings (Mann-Whitney test; P < .0001). A positive concordance between FAF and MP evaluation was also found (total concordance of 0.720 with a kappa of Cohen of 0.456). The hypo-autofluorescent areas showed decreased retinal sensitivity, while adjacent areas of increased FAF could be associated to both normal and decreased retinal sensitivity. Absolute scotoma, defined as 0 dB retinal sensitivity, corresponded with absence of autofluorescence.
Conclusions
Altered FAF in chronic CSC patients has a functional correlation quantified by microperimetry. This study confirms the impact of FAF changes on retinal sensitivity and their value to reflect the functional impairment in chronic CSC.
Central serous chorioretinopathy (CSC) is a condition characterized by the accumulation of fluid in the subretinal space through a defect of the retinal pigment epithelium (RPE) layer. The disease often resolves spontaneously but sometimes recurs or becomes chronic. After acute episodes, central vision usually returns to normal. However, some patients may experience residual visual impairment including shallow relative scotoma, reduced contrast sensitivity, or mild dyscromatopsia. Chronic and recurrent forms are often associated with progressive and irreversible visual loss secondary to degenerative and atrophic changes at the level of the neurosensory retina and the RPE.
In CSC changes of the photoreceptor layer revealed by optical coherence tomography (OCT) have been correlated with visual acuity in a series of studies. The degree to which the associated alterations of the RPE interfere with the visual function in the same eyes remains still unknown.
Fundus autofluorescence (FAF) is a noninvasive technique that allows imaging of degenerative changes of the photoreceptor-RPE complex and was recently used to analyze eyes with CSC. FAF shows in vivo the intensity and spatial distribution of lipofuscin and precursors of A2E. Its abnormal accumulation at the level of the outer segments of photoreceptors and RPE, usually preceding their degradation, is associated with visual acuity and retinal sensitivity impairment.
The MP1 microperimeter is a recently introduced automatic fundus perimeter that has been shown to be effective in assessing macular function in several macular pathologies. This technique allows exact correlating and quantifying the retinal sensitivity in the macular region with fundus changes.
The aim of this study was to find a possible correlation between the morphologic aspects observed by means of FAF and functional parameters such as visual acuity and retinal sensitivity in patients with chronic CSC. As a secondary outcome we also correlated visual acuity and retinal sensitivity in the same group of patients.
Subjects and Methods
This prospective cross-sectional study had approval by the local Institutional Review Board, Eye Hospital, Torino, Italy. The data collection complies with Italian law. An informed consent was obtained from all the patients, and all research and data collection complied with the Declaration of Helsinki.
We enrolled consecutive cases of chronic CSC seen at the retina department of our clinic between January 1, 2011 and May 31, 2012. Each patient had a documented history of CSC persisting for more than 6 months or recurrent episodes of CSC. The inclusion criteria were: chronic epitheliopathy on fluorescein angiography (FA); choroidal vascular hyperpermeability on indocyanine green angiography (ICGA); neurosensory retinal detachment or pigment epithelium detachment and choroidal thickening on OCT examination; macular areas of FAF abnormalities (hyper- or hypo-autofluorescence); best-corrected visual acuity (BCVA) ≥20/200. The exclusion criteria were: significant media opacities; presence of choroidal neovascularisation complicating the CSC; previous treatments with thermal laser photocoagulation, photodynamic therapy, or intravitreal anti–vascular endothelial growth factor drugs; diabetic retinopathy; high myopia (>6 diopters); glaucoma; other intraocular diseases (age-related macular degeneration, polypoidal choroidal vasculopathy, epiretinal membrane, or amblyopia); history of ocular surgery. Both eyes were included when the pathology was bilateral.
Each patient underwent to a complete ophthalmic examination including BCVA, anterior segment evaluation, intraocular pressure measurement by applanation tonometry, and detailed fundus examination. OCT, FAF, FA, ICGA, and microperimetry (MP) were then performed. BCVA was measured by a certified operator (D.G.) with the Early Treatment Diabetic Retinopathy Study (ETDRS) charts. LogMAR values were recorded and Snellen equivalent was calculated with the conversion tables. FA and ICGA were performed by the HRA (Heidelberg Retina Angiograph 2 [HRA2]; Heidelberg Engineering, Heidelberg, Germany). OCT was performed using the RTVue (Optovue, Fremont, California) model. After pupillary dilation, the cross-line and the macular thickness protocol (6 consecutive 6-mm-long scans containing 512 axial profiles [A-scans] at equally spaced angular orientations in a radial spoke pattern centered on the fovea) were obtained from each eye.
Microperimetry
Retinal sensitivity determination and fixation stability were carried out with the fundus-related perimeter (MP1 Microperimeter; Nidek Technologies, Albignasego, Italy) by 1 experienced ophthalmologist (F.T.) under standardized conditions with the room lights off. For each participant, a pretest training examination was also performed. After the pupils were dilated (1% tropicamide), all subjects underwent microperimetry after 15 minutes of dark adaptation. A reference frame was obtained with the integrated infrared camera. We used a customized radial grid pattern of 61 stimuli centered on the fovea with a 4-2-1 double staircase test strategy. A Goldmann III stimulus size and a projection time of 200 ms with a 1000-ms interval between stimuli was projected onto the central 10 degrees. A bright red cross 2 degrees in size was used for the fixation target. White background illumination was 4 apostilbs, and the starting stimulus light attenuation was set at 10 dB. During examination, a stimulus was projected onto the patient’s blind spot at 60 s, allowing the examiner to check the patient’s reliability. At the end of each examination, a color fundus photograph was acquired.
Mean sensitivity (MS) was assessed, and results were reported in decibels (dB). Retinal sensitivity was defined as normal if MS was >16 dB, relative scotoma if MS was between 16 and 1 dB, and absolute scotoma if MS was 0 dB. In addition to macular function, fixation patterns and fixation localizations were assessed by MP. For assessment of fixation, the fundus movements were tracked during examination with the electronic eye-tracking system integrated in the MP1. Fixation stability was calculated as the percentage of fixation points inside the 2-degree-diameter circle. Eyes having more than 50% of the preferred fixation points located within the central fixation area were classified to have predominantly central fixation. Eyes having less than 50% of the preferred fixation points within the central area were classified to have eccentric fixation. Fixation was regarded as stable if more than 75% of the fixation points were inside the 2-degree-diameter circle and as unstable if less than 75% of the fixation points were inside the 2-degree-diameter circle.
Fundus Autofluorescence
Short-wavelength FAF images were acquired by retinal angiograph HRA2 (Heidelberg Engineering). A view mode of a 30-degree field was used, with an image resolution of 768 × 768 pixels. A wavelength of 488 nm was used for excitation, and emitted light above 500 nm was detected with a barrier filter. For each image 15 single images were averaged using the compute mean tool (automated software) averaging mode to obtain a high-quality mean image.
Qualitative analysis of FAF abnormalities on macular area was performed. For each eye, FAF image was imported into the MP1 software and aligned with the color and infrared images and overlapped onto the microperimetric values map. After this overlapping, the FAF pattern of each retinal point tested with MP was analyzed by 2 retina specialists (C.M.E. and C.A.). Hyper-autofluorescence and hypo-autofluorescence were defined as brighter and darker FAF on the basis of the intensity of the background FAF pattern encountered just immediately peripheral to the superior temporal arcade.
Statistical Analysis
The mean, standard deviation, median, and range were used, as appropriate. Correlation analysis was performed to correlate visual acuity (VA) and macular sensitivity with FAF changes (statistical analyses: SPSS ver. 12.0; SPSS Inc, Chicago, Illinois, USA). Moreover, concordance analysis was performed to show an agreement between FAF and microperimetric findings. The 1-way ANOVA correlation analysis was used to evaluate the correlation between VA and central MS. All statistics were 2-tailed, and P < .05 indicated significance.
Results
This study included 46 eyes of 39 patients with chronic CSC. The mean age was 53.67 years (median 54, range 32–77 years). Thirty-two of 39 subjects (82.1%) were male, and 7 (17.9%) showed bilateral CSC. All eyes presented a history of CSC lasting for more than 6 months, and fundus biomicroscopy as well as OCT examination revealed signs of chronic CSC, in particular focal serous retinal detachment, RPE atrophy and photoreceptor loss, or intraretinal cystic degeneration in the macula, with a mean central foveal thickness of 300 ± 140 μm (median 256, range 160–820). The mean Snellen BCVA of the affected eyes was 20/32 (median 20/25, range 20/20–20/200).
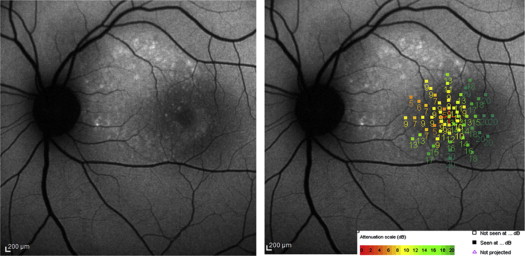
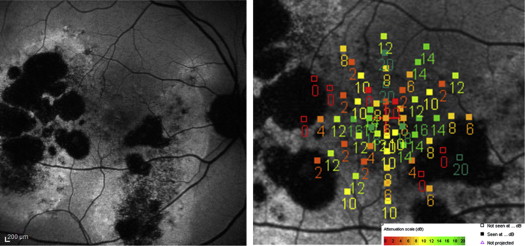
Abnormal FAF included the foveal center in 26 of 46 eyes (56.5%). Granular hyper- or hypo-autofluorescent pattern was found in 28 of 46 eyes (60.9%) ( Figure 1 , Left and Figure 2 , Left) and confluent hypo-autofluorescence in 18 (39.1%) ( Figure 3 , Left). According to FAF pattern mean BCVA was 20/25 (median 20/20, range 20/20–20/50) and 20/40 (median 20/40, range 20/25–20/200) for the granular hyper-/hypo-autoflurescent and the confluent group, respectively. This difference between the mean BCVA of the 2 groups of fundus autofluorescence patterns by nonparametric Mann-Whitney test was statistically significant ( P < .0001).
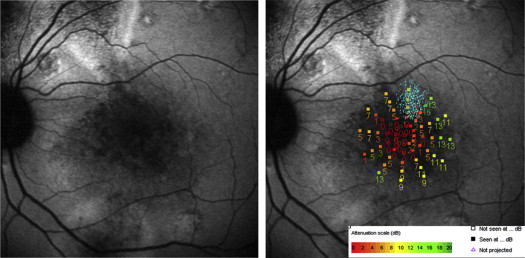
Fixation was central and stable in 34 of 46 eyes (73.9%) and eccentric and unstable in 12 (26.1%) ( Figure 1 , Right). Of the 34 subjects with stable fixation, 22 (64.7%) presented a granular hypo-hyper-autofluorescent pattern and 12 (35.3%) a confluent hypo-autofluorecence. Five of the 12 patients (42%) with eccentric fixation presented a granular hypofluorescent pattern, while 7 (58%) presented a central confluent hypo-autofluorescence. The eccentric fixation locus was detected on the iso-autofluorescent area nearest to the central fovea. In particular, eccentric fixation was superior, nasal, and temporal to the macula in 6 (50%), 4 (33.3%), and 2 (16.7%) patients, respectively. In each case of eccentric fixation an absolute scotoma was present corresponding to the area of central hypo-autofluorescence.
Sixty-one points for each eye were examined with the microperimetry, for a total of 2806 points. Mean retinal sensitivity was normal in 628 of 2806 points tested (22.4%); a relative scotoma was found in 1796 points (64%) and an absolute scotoma in 382 points (13.6%).
After the FAF image was overlapped onto a retinal sensitivity value map, the same 2806 points were also analyzed for FAF findings. Of these, 1986 points (70.8%) presented iso-FAF when compared to background FAF just peripheral to the superior temporal arcade, while 380 (13.5%) and 440 points (15.7%) showed hyper- and hypo-autofluorescence, respectively.
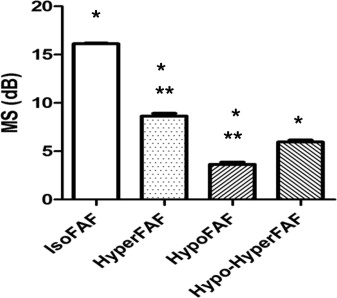
The qualitative analysis of correlation between the MS and FAF demonstrated that the mean retinal sensitivity corresponding to points of iso-FAF was 16.12 ± 3.13 dB, while the MS was reduced in both hyper-FAF and hypo-FAF points to 8.64 ± 5.65 dB and 3.65 ± 4.74 dB, respectively ( Figure 2 , Right). The differences between MS of iso-FAF and those of hyper-FAF and hypo-FAF were statistically significant (Student t test; P < .0001) ( Figure 4 ). Moreover, 240 of 440 points (54.5%) of hypo-FAF presented an MS of 0 dB ( Figure 3 , Right). The analysis of concordance between the FAF findings (iso-autofluorescence and hyper-/hypo-autofluorescence) and the mean retinal sensitivity (normal retinal sensitivity and relative or absolute scotoma) showed a total concordance of 0.720 with a kappa of Cohen of 0.456.