Purpose
To address the misrepresentation of the eye in retinal optical coherence tomography (OCT) images and to examine the effect of this misrepresentation on retinal thickness measurements.
Design
Prospective case series.
Methods
Five subjects with recent orbital magnetic resonance imaging (MRI) scans and normal eye examinations were consented from the clinics of the Duke Eye Center. Each subject had both eyes imaged using a retinal spectral-domain OCT system and ocular biometry measured. Two types of individualized optical models of the subject eyes—numerical and analytical—were used to determine the spatial paths of the OCT A-scans. These paths were used to reorient the A-scans in the associated retinal OCT images and generate corrected images. Using curvature as a general measure of shape, the radii of curvature of the retinal pigment epithelium in the original and corrected OCT images were compared to the ocular radii of curvature in the MRI images. Differences between the retinal thickness maps derived from the original and corrected OCT images were then determined.
Results
The retinal curvatures were substantially flatter in the original OCT than in the MRI images (mean paired difference: 52.8 ± 41.8 mm, P < .001). Correcting the OCT images decreased the paired differences between OCT and MRI (numerical: 1.6 ± 2.3 mm, P = .091; analytical: 1.9 ± 4.3 mm, P = .278). Retinal thickness measurements between the corrected and uncorrected images differed, with a root mean square difference of 5.61 μm over the entire 6-mm extent of the image; this difference was greater peripherally (6.02 μm) than centrally (2.54 μm).
Conclusions
Optically based algorithms can be used to correct the shape of the retina as represented in OCT; this correction makes OCT more consistent with other clinical imaging techniques. Resultant retinal thickness maps were minimally affected by the change in shape. Ocular shape correction should be considered in future development of posterior segment OCT-based morphologic measurements.
Optical coherence tomography (OCT) is a noninvasive, micrometer-scale tomographic imaging modality in widespread clinical use for retinal imaging. OCT can be thought of as the optical analog of ultrasound imaging. Energy—light, in the case of OCT—is delivered into the eye, and the locations of reflectors (cornea, lens, retina, among others) along that path constitute a linear A-scan. Regularly sampling across the eye then generates a series of A-scans that compose the familiar 2-dimensional B-scan image or 3-dimensional volume.
When viewing B-scan images from commercially available ultrasound and OCT instruments, there is a difference between the represented shape of the posterior segment of the eye from each modality ( Figure 1 ). In ultrasound images, the posterior segment is circular, as would be expected for the eye globe. In contrast, the retina typically appears nearly flat in OCT images, even accounting for the smaller field of view.
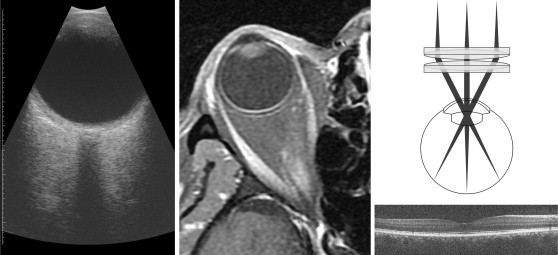
The source of this discrepancy lies in the display of the retina presented by OCT. Both posterior segment OCT and ophthalmic ultrasound are sector scanning technologies: the A-scans originate or pass through a common pivot point and sweep across the curved posterior eye. In ultrasound images, A-scans are presented in an arc (or fan) shape consistent with this scan pattern. In contrast, the A-scans in posterior segment OCT images from all current-generation commercial systems are presented in a parallel format, resulting in a rectangular display inconsistent with the actual scan geometry.
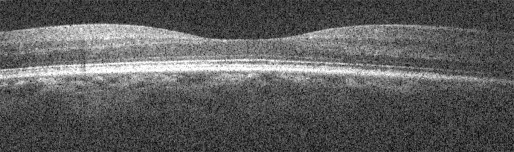
Because of this inconsistency between the display and the actual scanning, the true shape and relative position of ocular structures is incorrectly represented in typical posterior segment OCT. The displayed retina is in effect “distorted.” Figure 2 shows a spectral-domain OCT (SDOCT) image of an apparently convex retina from a normal subject. In this extreme case, the displayed retina is nonphysiologic, but in reality, the subject has a normal posterior segment. As quantitative morphometric analyses and measures are increasingly applied to OCT image data sets, such display distortions could have increasingly severe consequences on such analyses.
The purpose of this study was to develop methods to correct the ocular shape in posterior segment OCT images using optical models of the true OCT scan paths. To validate the derived algorithms, the corrected posterior segment OCT representations were compared to a reference non–optical imaging technique (magnetic resonance imaging, MRI). Finally, we characterized the effect of uncorrected and corrected retinal OCT images on current clinical measures of the retina.
Methods
This study was a prospective, single-center observational case series. Prospective approval from the Duke University Medical Center Institutional Review Board was obtained prior to initiating the study. Informed consent for the research was obtained from each enrolled subject prior to beginning any study activity, and the study was performed in accordance with HIPAA regulations.
Correction of Posterior Segment Optical Coherence Tomography Images
To correct the posterior segment OCT images, the true paths of the A-scans through the eye need to be recovered. Each component A-scan within the OCT image can then be reoriented in angle and space to its correct position within the sector scan.
We developed 2 methods to recover the scan path information in this study. The first (termed “numerical,” Figure 3 , Left) entailed detailed ray-traced optical modeling of posterior segment SDOCT imaging. Ocular biometric measurements were obtained from the imaged eye using Scheimpflug photography (Pentacam; Oculus; Wetzler, Germany) for corneal radii of curvature and thickness and using partial coherence interferometry (IOLMaster; Carl Zeiss Meditec, Dublin, California, USA) for anterior chamber depth and axial length. These values are necessary because the cornea and lens serve as the final focusing objectives of the retinal OCT system ( Figure 1 , Top right). These biometric values were then used to populate and customize a wide-field, schematic model eye representing the imaged eye. Using optical design software (ZEMAX SE; RadiantZemax, Redmond, Washington, USA), a current-generation retinal SDOCT system with 2 single-axis orthogonal galvanometers and the galvanometer image conjugate at the pupil was modeled. The angular scan range was measured from the actual SDOCT system and entered into the model. A virtual volumetric posterior segment SDOCT sector scan on the individualized schematic model eye was then simulated via ray tracing to recreate the paths taken by each A-scan during imaging. The model was optimized to minimize the spot size at the retinal surface of the model eye across the entire scan range. Based on the imaged model retinal surface data, a second reference surface was created that had equivalent optical path lengths to that of the center (0 degree, 0 degree) scan configuration to allow remapping of the A-scan depths. This was done because depth in an OCT image represents optical path lengths and not physical distances. Each A-scan was then repositioned according to its modeled path to produce the final corrected posterior segment OCT image.
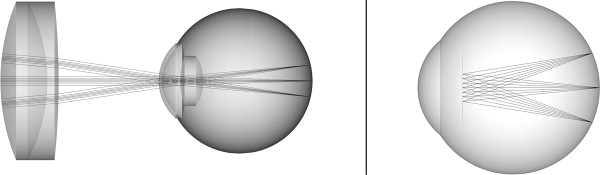
To simplify the modeling and computational complexity inherent to the first model, we conceived a second model (termed “analytical,” Figure 3 , Right) that assumed all scanning light entering the eye shared a common pivot located at the nodal point of a reduced model eye. For the purposes of this model, all points on the scanned retina were assumed to be equidistant to the nodal point. Hence the physical distance light traveled from the pivot to the retina was equivalent to the distance from the nodal point to the retina—17.2 mm for Listing’s reduced eye model. The system manufacturer’s reported scan width determined the extent of the scan across the retina. This information was then used to reposition each A-scan to its correct path in this simplified model.
Comparison of Corrected Optical Coherence Tomography Images With a Reference Technique (Magnetic Resonance Imaging)
To validate the numerical and analytical methods, the corrected posterior segment OCT representations were compared to a reference non–optical imaging technique (MRI).
Five patients (4 male, 1 female) from the neuro-ophthalmology clinics of the Duke Eye Center were enrolled into this study. These subjects were included because they had a recent head or orbital MRI but did not have ocular pathology (other than refractive error) on ophthalmic examination. The clinical MRI images were acquired using systems with 1.5 tesla magnetic field strength (GE Healthcare Signa HDxt, Milwaukee, WI, USA; and Siemens MAGNETOM Avanto, Erlangen, Germany) with slice spacing between 3 and 7 mm (mean ± 1 standard deviation: 4.40 ± 1.52 mm) and an in-plane pixel width between 0.3125 and 0.625 mm (0.477 ± 0.147 mm). The mean age of the subjects was 56.38 ± 16.23 years. All eyes were phakic with a mean spherical equivalent refraction of −1.28 ± 2.50 diopters.
Both eyes of each subject were imaged using Scheimpflug photography, partial coherence interferometry, and retinal SDOCT (Bioptigen, Research Triangle Park, North Carolina, USA). The retinal SDOCT volumes consisted of 1024 × 1000 × 100 pixels (depth × A-scans × B-scans) taken at a 20-kHz A-scan rate with a nominal scan width of 6.7 mm, per the manufacturer.
After fully automated layer boundary segmentation of the retinal surface and retinal pigment epithelial (RPE) layers, both correction algorithms (numerical and analytical) as implemented in MATLAB (MathWorks, Natick, Massachusetts, USA) were used to reorient the imaged A-scans to their modeled paths, as described earlier. For ease of comparison and spatial accuracy, we also converted the standard anisotropic SDOCT pixel resolution (axial pixel pitch higher than lateral) to an isotropic pixel resolution (identical axial and lateral pixel pitch) for both the original and corrected images. The radius of curvature of the RPE was calculated as a general quantitative measure of the shape of the posterior eye for the standard uncorrected rectangular SDOCT images and for both types of corrected images.
On the corresponding axial T1 MRI image slabs of the subjects’ eyes, the inner eye wall was manually segmented by a single grader using custom written software, repeated 3 times. The volumetric mean radius of curvature of the inner eye wall for the 3 sessions was then calculated and used as the reference measure.
For each subject eye, the MRI-derived radius of curvature was compared to the corresponding SDOCT-derived radius of curvature. Paired nonparametric Wilcoxon signed rank tests using generalized estimating equations to account for multiple imaged eyes per person were used to identify any significant differences from zero (with α = 0.05) between the SDOCT measures and reference MRI measurements.
Clinical Retinal Thickness Maps From Uncorrected and Corrected Retinal Optical Coherence Tomography Images
To determine the effect of correcting the shape of the displayed retina on current clinical measures, retinal thickness maps from the uncorrected and numerically corrected OCT images were compared. For the purposes of this study, retinal thickness was defined as the vertical (parallel to the OCT image z-axis) difference between the automatically segmented retinal surface and the RPE.
Because axial motion artifacts between B-scans can affect thickness measurements in the numerically corrected OCT images, volumes with numerical correction only within the B-scan planes were created for this comparison. This mitigated axial motion artifacts by eliminating differences between the original and corrected retinal surfaces in the y- (slow) axis direction, where axial motion artifacts are grossly apparent between B-scans. Individual B-scans were acquired in 50 msec, so motion artifacts within individual B-scans are limited.
The thickness maps from the uncorrected and numerically corrected retinal OCT images were then subtracted from each other to create difference maps, and the root mean square deviation (RMSD) was calculated to describe the difference between the 2 thickness maps. The RMSD first takes the differences at each equivalent pixel location between the original thickness map and the one derived from the numerically corrected retinal images. The differences are squared, summed, and divided by the number of pixels to normalize for the number of points. The square root of the result is then taken to return the result back to the original units.
To examine differences between the central and more peripheral regions of the volume, the thickness maps were also compared for 2 regions: a central 3-mm zone and a peripheral zone outside of the 3-mm zone.
Results
Correction of Posterior Segment Optical Coherence Tomography Images
Figure 4 shows a representative standard uncorrected retinal SDOCT image and retinal images corrected using the numerical and analytical models. The uncorrected retina is visually flatter than either of the corrected images, as is reflected in the radius of curvature measures. The Table shows the curvature values for all the eyes from all modalities in this study. For comparison, reported values of retinal curvature for anatomically accurate schematic eye models in the literature range from 11.06-14.1 mm, with a mean of 12.05 mm.


