Purpose
To evaluate optic disc drusen, extracellular protein deposits known to contain numerous aggregates of mitochondria, using multimodal modalities featuring optical coherence tomography (OCT) and autofluorescence imaging.
Design
Retrospective observational case series.
Methods
Eyes with optic nerve drusen were examined with enhanced depth imaging (EDI)-OCT, swept source OCT, and fundus autofluorescence using a fundus camera.
Results
Twenty-six eyes of 15 patients with optic disc drusen were evaluated. EDI-OCT and swept source OCT showed multiple optic disc drusen at different levels; most were located immediately anterior to the lamina cribrosa. The drusen were ovoid regions of lower reflectivity that were bordered by hyperreflective material, and in 12 eyes (46.2%) there were internal hyperreflective foci. The mean diameter of the optic disc drusen as measured in OCT images was 686.8 (standard deviation ± 395.2) μm. There was a significant negative correlation between the diameter of the optic disc drusen and the global retinal nerve fiber layer thickness (r = −0.61, P = .001). There was a significant negative correlation between proportion of the optic disc drusen area occupied by optic nerve drusen as detected by autofluorescence imaging and the global retinal nerve fiber layer thickness (r = −0.63, P = .001).
Conclusions
Deeper-penetration OCT imaging demonstrated the internal characteristics of optic disc drusen and their relationship with the lamina cribrosa in vivo. This study also showed that both the larger the drusen and the more area of the optic canal occupied by drusen, the greater the associated retinal nerve fiber layer abnormalities.
Optic disc drusen are yellow-white autofluorescent collections that accumulate within the optic nerve and can be associated with a variety of ocular and systemic diseases, such as retinitis pigmentosa, Alagille syndrome, and pseudoxanthoma elasticum. In most patients, though, there are no apparent associated predisposing ocular or systemic conditions. Drusen near the surface of the nerve can be directly visualized, while those located somewhat deeper often may alter the contour of the nerve and sometimes cause a congested, swollen appearance. Histologic evaluation in a series of enucleated eyes showed a prevalence of 1% and in an autopsy series the prevalence was 2.4%. Clinically recognized optic disc drusen appears to have a much lower prevalence. If drusen are suspected, diagnostic tests such as contact B-scan ultrasonography, autofluorescence imaging, computed axial tomography, and scanning laser ophthalmoscopy can help confirm the diagnosis. These tests typically are used only when the clinical examination raises suspicion about the optic nerve. These same imaging modalities have low resolution and offer little useful information about depth localization or internal characteristics of the optic disc drusen.
Independent of any challenge they may pose in making a diagnosis, optic disc drusen are associated with significant ocular morbidity. With increasing age, eyes with optic disc drusen may develop visual field defects, optic nerve pallor, choroidal neovascularization, vascular occlusions, and hemorrhage. The pathophysiologic mechanisms for drusen formation, or for the pathologic sequella, are not known. Light microscopic histologic examination of optic nerve drusen has demonstrated hyaline material within the nerve and this material frequently shows flecks of calcium. In 1981 Tso published a landmark study showing electron microscopic findings of optic disc drusen. He found that the drusen were composed of aggregates of extracellular mitochondria contained within a filamentous protein matrix. Many of the extracellular mitochondria, and also the intracellular mitochondria in adjacent neurons, contained calcium crystals. The extracellular mitochondria were thought to be the result of cellular death with release of the intracellular contents into the extracellular space.
One significant contributing factor to the general lack of knowledge about optic disc drusen in vivo is the paucity of high-resolution imaging that could be used in the clinic. Recently developed optical coherence tomography (OCT) methodologies, such as enhanced depth imaging (EDI) or swept source OCT, are capable of obtaining cross-sectional anatomic information of structures not directly visible by ophthalmoscopy with details far surpassing other imaging modalities. A multimodal approach combining these methods of OCT imaging with other imaging information would optimize the opportunity to evaluate eyes with optic disc drusen. In this report we show the size, location, and internal structure of optic disc drusen and show their association with nerve fiber layer defects using multimodal techniques.
Patients and Methods
The study had institutional review board approval by the Western Institutional Review Board, Olympia, Washington; complied with the Health Insurance Portability and Accountability Act of 1996; and adhered to the tenets of the Declaration of Helsinki. The patients examined in this study were evaluated at a private retinal referral practice in New York. All patients had signed an informed consent for study participation. We retrospectively reviewed and analyzed patients with optic disc drusen who were examined between September 2010 and January 2013. These patients were identified through computerized medical and billing records and this study included all identified patients examined by the senior author (R.F.S.). Some eyes had a known diagnosis of optic disc drusen or had readily visible drusen on the surface of the nerve, while others were discovered serendipitously as part of their standard examination. Routine autofluorescence imaging is done in our practice for patients with age-related macular degeneration. Approximately half of cases of optic nerve drusen in this series were initially detected through visualization of hyperautofluorescent structures within the optic nerve tissue by autofluorescence imaging. All patients had a comprehensive ophthalmic examination including best-corrected visual acuity, slit-lamp biomicroscopy, color fundus photography, and autofluorescence imaging with a fundus camera (Topcon TRC-50DX; Topcon Medical Systems, Oakland, New Jersey, USA) with an excitation range of 535-585 nm and a barrier filter with a range of 605-715 nm. EDI-OCT was performed using the Heidelberg Spectralis (Heidelberg Engineering, Heidelberg, Germany). The nerve was scanned with either 5 × 15-degree or 10 × 15-degree volumes, and 100 scans were averaged for each section. The greatest diameter, location, and depth of each optic disc drusen were determined using EDI-OCT. Four eyes of 2 patients were imaged using swept source OCT (DRI-OCT1; Topcon Medical Systems). This OCT system has an A-scan repetition rate of 100 000 Hz. The light source is a wavelength tunable laser centered at 1050 nm with a 100-nm bandwidth.
The Heidelberg Spectralis also was used to obtain retinal nerve fiber layer thickness measurements. The resultant nerve fiber layer thicknesses are shown graphically in a pie chart that represents the classification results as compared with nomographic data. The pie chart is divided into 6 standard sectors representing the subclassification of superotemporal, superonasal, temporal, nasal, inferotemporal, and inferonasal sectors of the optic disc. These sectors are segregated into 3 categories: the lower one percentile, which has the descriptor “outside normal limits”; a range from the second through fifth percentile, termed “borderline”; and the remaining upper 95% that is considered “within normal limits.” Image measurement parameters derived from the planimetry software within Topcon ImageNet was used in conjunction with Adobe Photoshop CS3 (Adobe Systems Incorporated, San Jose, California, USA) to measure the area of hyperautofluorescence within the nerve associated with optic disc drusen. All data were done by 2 masked examiners independently, and if the measurement difference between the 2 examiners exceeded 15% of the mean of the 2 values, there was open adjudication with the senior author.
Statistical Analysis
The visual acuity measurements were converted to logarithm of the minimal angle of resolution (logMAR) units before analysis. Summary statistics were calculated, group comparisons were made with the Mann-Whitney U test, and categorical data were compared with the χ 2 test. A P value <.05 was considered statistically significant. The statistical analyses were performed with SPSS software version 20.0.0 (SPSS, Inc, Chicago, Illinois, USA).
Results
We retrospectively identified 15 patients; of these, EDI-OCT was not available for 2 eyes, 1 patient only had unilateral optic disc drusen and 1 eye was severely myopic with extensive peripapillary atrophy and consequently the retinal nerve fiber layer measurement was not possible, leaving 26 eyes for analysis. The mean age of subjects undergoing EDI-OCT was 64.4 years (standard deviation ± 13.9 years) and 9 of 15 (60.0%) were female. The median best-corrected visual acuity was 20/63 and showed a range from 20/20-20/400. Among 26 eligible eyes, 8 eyes (30.8%) had visible optic disc drusen and 18 eyes (69.2%) had buried optic disc drusen on ophthalmoscopy. The sector of hyper–fundus autofluorescence and the location of EDI-OCT and the retinal nerve fiber layer measured outside normal limits of the 6 standard sectors of the optic disc are summarized in Figure 1 .
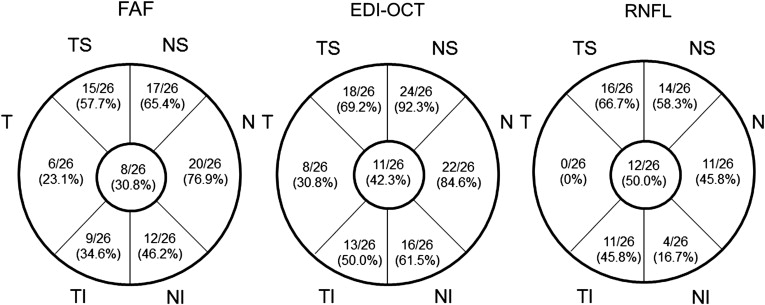
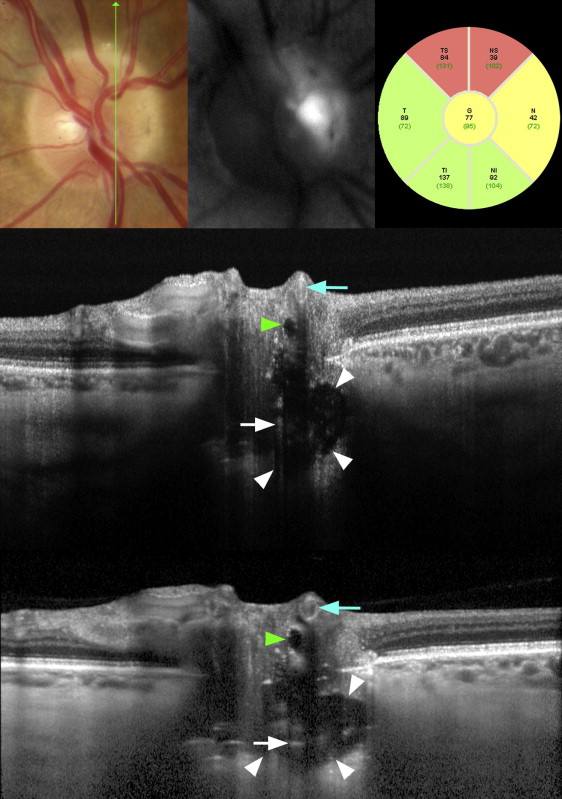
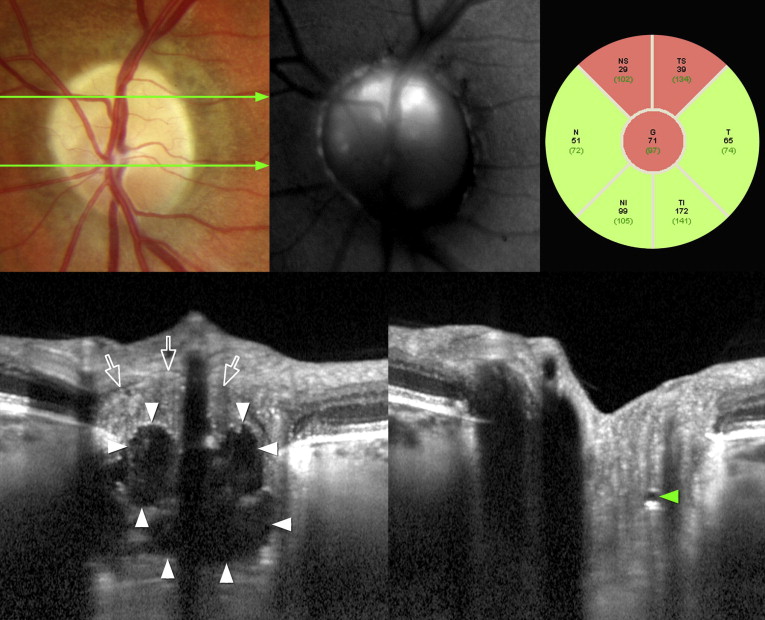
EDI-OCT and swept source OCT showed multiple optic disc drusen of various sizes located at different levels anterior to the lamina cribrosa. The drusen were seen to be hyporeflective round or ovoid structures often bordered by hyperreflective curvilinear bands, particularly around the more external portions of the drusen ( Figures 2 and 3 ). There were internal hyperreflective foci in 12 eyes (46.2%) ( Figures 2 and 3 ). The mean greatest diameter of the optic disc drusen was 686.8 (±395.2) μm. In 6 eyes with more marked pallor, the tissue of the optic nerve appeared to be composed of 2 different components ( Figure 3 ). The more internal aspect of the nerve had a reflectance consistency similar to the adjacent nerve fiber layer. A second region below that, and nearer to the optic nerve drusen, had more granular reflectance characteristics.
Of the 26 eyes, autofluorescence imaging detected optic disc drusen in 23 (88.5%) in regions that co-localized with the hyporeflective intraneural tumefactions seen using EDI-OCT. The mean area of hyperautofluorescence within the nerve was 0.56 (±0.43) mm 2 . The mean area of optic disc was 1.93 (±0.42) mm 2 , and the mean hyperautofluorescence-to–disc area ratio was 0.28 (±0.21). Of interest was that 3 of these patients had no apparent focal autofluorescence signaling from their fellow eyes but when examined with EDI-OCT had small tumefactions (155, 229, and 271 μm), consistent in appearance with the larger optic disc drusen in their fellow eyes.
There was a significant negative correlation between the diameter of optic disc drusen using EDI-OCT and the mean global retinal nerve fiber layer thickness (r = −0.61, P = .001, Spearman correlation coefficient test). There was a significant negative correlation between the area ratio of the optic disc drusen area to disc area as measured by autofluorescence and the global retinal nerve fiber layer thickness (r = −0.63, P = .001, Spearman correlation coefficient test). There was a significant positive correlation between the diameter of optic disc drusen using EDI-OCT and the number of sectors in which the retinal nerve fiber layer measured outside normal limits (r = 0.57, P = .002, Spearman correlation coefficient test).
Age showed no significant relationship with the optic disc drusen area–to–disc area ratio using fundus autofluorescence imaging (r = −0.05, P = .81, Spearman correlation coefficient test) or the greatest diameter of optic disc drusen using EDI-OCT (r = 0.11, P = .58, Spearman correlation coefficient test). The visual acuity also showed no significant relationship with the optic disc drusen area–to–disc area ratio using fundus autofluorescence imaging (r = −0.25, P = .22, Spearman correlation coefficient test) or the greatest diameter of optic disc drusen using EDI-OCT (r = −0.05, P = .81, Spearman correlation coefficient test). Among eyes with hyperreflective internal foci, the mean global retinal nerve fiber layer thickness was 58.8 ± 11.2 μm as compared to 88.6 ± 16.5 μm in eyes having no internal hyperreflective foci, a difference that was significant ( P < .001 Mann-Whitney U test).
Results
We retrospectively identified 15 patients; of these, EDI-OCT was not available for 2 eyes, 1 patient only had unilateral optic disc drusen and 1 eye was severely myopic with extensive peripapillary atrophy and consequently the retinal nerve fiber layer measurement was not possible, leaving 26 eyes for analysis. The mean age of subjects undergoing EDI-OCT was 64.4 years (standard deviation ± 13.9 years) and 9 of 15 (60.0%) were female. The median best-corrected visual acuity was 20/63 and showed a range from 20/20-20/400. Among 26 eligible eyes, 8 eyes (30.8%) had visible optic disc drusen and 18 eyes (69.2%) had buried optic disc drusen on ophthalmoscopy. The sector of hyper–fundus autofluorescence and the location of EDI-OCT and the retinal nerve fiber layer measured outside normal limits of the 6 standard sectors of the optic disc are summarized in Figure 1 .


