Purpose
To describe a technique to obtain combined images of vitreoretinal and choroidal structures using spectral-domain (SD) optical coherence tomography (OCT) and to evaluate applicability in normal eyes and limitations in eyes with cataract.
Design
Prospective, observational case series.
Methods
Three different foveal scans, including conventional SD OCT, enhanced depth imaging OCT and the novel method called combined depth imaging (CDI) OCT, were obtained in 42 eyes of healthy volunteers and in 26 eyes with cataract using the Heidelberg Spectralis HRA (Heidelberg Engineering). The CDI OCT images were obtained manually using an image modification process that enhances the vitreoretinal interface first and then the choroid, while averaging 100 separate OCT scans. The visualization of the inner border of the preretinal pocket and the outer border of the choroid was graded by independent masked observers for each OCT scan method.
Results
The CDI technique was able to create a good-quality combined image of the posterior structures in all the eyes, including eyes with cataract. The agreement between the grading performed by the independent observers was high for both the inner border of the vitreal pocket (κ, 0.86; P < .001) and the outer choroidal border (κ, 0.90; P < .001). CDI OCT was equivalent to conventional SD OCT in visualizing the vitreal pocket ( P = .445 for normal eyes, P = .162 for eyes with cataract) and was equivalent to enhanced depth imaging OCT in visualizing the outer choroidal border ( P = .660 for normal eyes, P = .329 for eyes with cataract). CDI OCT was superior to conventional SD OCT and enhanced depth imaging OCT in visualizing both of the structures ( P < .001).
Conclusions
The manual technique of CDI OCT is highly sensitive to visualize posterior vitreoretinal and choroidal structures into a single full-depth image and is not affected by mild to moderate cataract.
Spectral-domain (SD) optical coherence tomography (OCT) has emerged as the gold standard noninvasive technique to visualize fine retinal details and to evaluate retinal structural changes for many ocular treatments. Commercially available SD OCT devices achieve axial scanning speeds of 20 000 to 52 000 A-scans per second, with an axial resolution of 5 to 7 μm in the eye, allowing histologic-like cross-sectional images of the vitreoretinal interface and the retinal structures. High image quality may be achieved by the image averaging system; commercially available software averages 8 to 100 images and increases signal-to-noise ratio in proportion to the square root of the number of images averaged. Some SD OCT devices have automated eye tracking as a feature to ensure that all the images to be averaged are obtained from the same retinal location.
For clinical ophthalmic purposes, typical SD OCT instruments use near-infrared wavelengths of approximately 850 nm that penetrate well into the retina and the subretinal space, whereas deeper penetration is limited because of scattering induced by the retinal pigment epithelium and the vascular nature of the choroid. Other reasons for the choice of wavelengths of approximately 850 nm, versus 1000 or 1300 nm, are the better contrast of retinal structures and better axial resolution. Moreover, typically the point of maximum sensitivity on SD OCT (known as the zero delay line ) is located in the vitreous. As a result, with increasing depth into the tissue, the signal is reduced and details of the choroid are not visible.
More recently, the ability to visualize the choroidal anatomic features has been improved with the development of the enhanced depth imaging (EDI) technique on SD OCT and with the new generation of experimental prototypes of swept-source OCT (SS OCT). The EDI acquisition software automatically captures cross-sectional images with the choroid close to the zero delay line to maximize sensitivity on the outer limit of the choroid, using the current 830- to 880-nm probing light of the conventional SD OCT. Alternatively, SS OCT prototypes (not yet commercially available) use a longer center wavelength (1040 to 1060 nm) and higher scan rate (100 000 Hz) of the light source, allowing deeper penetration into the choroid and the sclera. Clearly, these new techniques allow a great detection of the choroidal borders and fine detail; however, detection of the inner retinal surface is reduced using the EDI OCT, and the posterior vitreous is not visible. Moreover, so far no SS OCT device has been approved by the Food and Drug Administration. In addition, the axial resolution and retinal contrast depends on the wavelength; at higher wavelengths, the resolution deceases and retinal contrast reduces.
To overcome this imaging limitation and to obtain a single comprehensive image of both the vitreoretinal interface and choroid, we developed a novel imaging method using a commercially available SD OCT device. The aims of the present study were: (1) to describe in detail this technique, (2) to test its ability to visualize vitreoretinal and choroidal structures in a series of normal eyes, and (3) to evaluate its limitations in eyes with mild to moderate cataract.
Methods
This prospective study was approved by the Institutional Review Board of the University of California, San Diego, and was conducted at the University of California, San Diego, Shiley Eye Center in adherence to the tenets of the Declaration of Helsinki.
Patients
For this prospective observational study, 42 eyes of 21 healthy volunteers with no known eye disease were included consecutively, as well as 26 eyes of 17 patients with known cataract. Exclusion criteria included known posterior vitreous detachment and diffuse corneal opacity. After obtaining written informed consent to participate in this research, all subjects underwent axial length measurement using ocular biometry (IOLMaster; Carl Zeiss Meditec, Jena, Germany) and pupillary dilation with tropicamide 1%. In the group of patients with cataract, lens opacities were graded after dilation according to the Lens Opacities Classification System III.
Derivation of the Combined Depth Imaging Technique
This simple technique that we called combined depth imaging (CDI), is an image process modification that combines conventional SD OCT B-scans with EDI OCT B-scans into a single image. The Spectralis HRA (Heidelberg Engineering, Carlsbad, California, USA) is an SD OCT device that has a real-time eye-tracking system (TruTrack active eye-tracking; Heidelberg Engineering) and is capable of averaging up to 100 separate OCT scans at any arbitrary location. The device achieves an axial scanning speed of 40 000 A-scans/second with an axial digital resolution of 3.9 μm and an axial optical resolution of 5 to 7 μm. By convention, structures nearer to the zero delay are imaged at the top of the screen, and deeper structures are imaged further down in the screen. By default, the device operates with the inner retina closest to the zero delay line to maximize the sensitivity of the retina and vitreoretinal interface. To enhance the choroid, the EDI acquisition software is available on the device, with a dedicated button on the keypad; when the EDI button is selected, the choroid is placed closer to the zero delay line. The CDI OCT image derives from an image modification process that enhances first the vitreoretinal interface, and then the choroid, while averaging 100 separate OCT scans. Indeed, while averaging at least 50 conventional SD OCT scans, the vitreoretinal interface is highly enhanced; by selecting the EDI button after averaging 50 scans, the choroid of the subsequent scans becomes enhanced and the device is able to merge conventional scans with EDI OCT scans into a single comprehensive image showing good sensitivity through the full imaging depth.
Optical Coherence Tomography Scanning Protocol
All patients were imaged using the Spectralis HRA SD OCT device through dilated pupils by a single experienced physician (G.B.). The Spectralis HRA was set to perform a 9-mm high-resolution horizontal B-scan, centered on the fovea. An internal fixation light was used to center the scanning line on the fovea. The averaging system was set to 100 OCT scans. A sequence of 3 different images was performed for each eye of the patients.
Conventional optical coherence tomography
After positioning the OCT B-scan at the upper half of the screen, the operator activated the averaging system of the device, and the image was captured after reaching at least 50% of the averaging.
Enhanced depth imaging optical coherence tomography
After positioning the OCT B-scan at the lower half of the screen, the operator activated the EDI acquisition software and subsequently the averaging system of the device. The image was captured after reaching at least 50% of the averaging.
Combined depth imaging optical coherence tomography
After positioning the OCT B-scan in the middle of the screen, the operator first activated the averaging system of the device using the conventional SD OCT (as described above). After reaching 50% of the averaging, he manually activated the EDI acquisition software using the dedicated button on the keypad. The combined image that resulted was captured as soon as a good-quality image was visualized in the middle of the screen.
Optical Coherence Tomography Imaging Analysis
The 3 images for each eye were saved as maximum quality JPEG image files in native resolution. All images then were masked, removing features identifying OCT scan method and patient information, and then were mixed randomly. Two independent masked physicians (S.E.-E., L.G.) reviewed each image on the same monitor with same resolution at different time points and graded visualization of the inner border of the preretinal pocket and of the outer border of the choroid separately. Grade 0 indicated that the border was not seen, grade 1 indicated that the border was barely seen, and grade 2 indicated that the border was clearly seen.
Statistical Analysis
The interobserver agreement for the grading of the inner border of the vitreal pocket and the outer border of the choroid was assessed using the Cohen κ. A Bland-Altman plot was used to assess the clinically relevant magnitude of the difference between grading and observers. A paired-samples t test was used to compare grading of the inner border of the vitreal pocket and the outer border of the choroid among the 3 OCT images for each eye. Statistical analysis was performed using SPSS statistical software version 20.0 (SPSS Inc, Chicago, Illinois, USA). A P value less than .05 was considered to be statistically significant.
Results
Normal volunteers had mean age of 38 years (range, 23 to 64 years) and mean axial length of 23.9 mm (range, 21.9 to 26.4 mm). Subjects with cataract had mean age of 66 years (range, 52 to 82 years) and mean axial length of 23.4 mm (range, 20.9 to 24.9 mm). Cataract grading ranged from Lens Opacities Classification System III grade N02-NC2 to grade N04-C3.
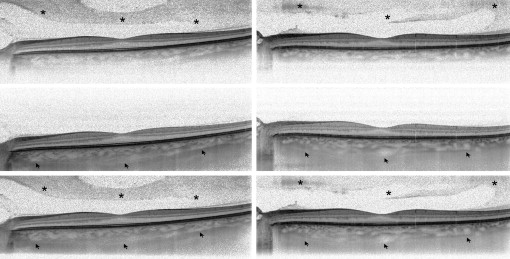
In all the eyes, normal or with cataract, the Heidelberg Spectralis HRA was able to create a good-quality combined image of the posterior structures in a few seconds during image averaging using the CDI technique. Examples of comparison between different OCT methods are shown in Figure 1 .
Stay updated, free articles. Join our Telegram channel

Full access? Get Clinical Tree


