Purpose
To evaluate macular choroidal thickness after reduced-fluence photodynamic therapy (PDT) for chronic central serous chorioretinopathy (CSC).
Design
Prospective, consecutive, interventional case series.
Methods
Twenty-two eyes with chronic CSC were treated with reduced-fluence PDT. Macular choroidal thickness was examined using spectral-domain optical coherence tomography with a 3-dimensinonal radial scan protocol in the choroidal mode before and 1, 3, and 6 months after the treatment. The mean choroidal thickness in the Early Treatment Diabetic Retinopathy Study grid (center, inner circle, and outer circle) was compared between before and after therapy, as well as between treated eyes and 54 volunteer normal eyes.
Results
Chronic CSC eyes showed significantly thicker choroids in the macular area compared with normal controls ( P < .0001). After the single treatment session, subretinal fluid resolved completely in all eyes, and there were no recurrences during the study period. Choroidal thickness within the center area and inner circle showed a significant reduction at all time points after treatment ( P < .05). The choroidal thickness in the outer circle showed a statistically significant reduction at 1 and 3 months but not at 6 months. After treatment, the choroidal thickness reduced to the normal values at the center and inner circle, but was still significantly thicker in the outer circle ( P < .01).
Conclusion
Chronic CSC eyes showed significantly thicker choroids in the macular area. After reduced-fluence PDT, macular choroidal thickness became thinner within 6 months of treatment.
It was previously thought that a breakdown of the outer blood-retinal barrier leads to leakage from the retinal pigment epithelium in central serous chorioretinopathy (CSC). Recent studies using indocyanine green angiography have revealed delayed choroidal infusion, choroidal venous dilation, and choroidal vascular hyperpermeability in eyes with CSC. It is now generally thought that the choroid is the primary site involved in CSC pathology. In addition, enhanced-depth imaging optical coherence tomography (OCT) showed that eyes with CSC have thicker choroids at the fovea than contralateral unaffected eyes or healthy normal eyes. A comparison of choroidal thickness between regions with and without choroidal vascular hyperpermeability showed greater choroidal thickness in the region with choroidal vascular hyperpermeability. The choroidal thickening diffuses, extending over the macula, rather than just being localized subfoveally.
Photodynamic therapy (PDT) with verteporfin resolves leakage and subsequently resolves subretinal fluid in chronic CSC. A possible mechanism of action of PDT in CSC involves damage to the choriocapillaris leading to decreased choroidal vascular hyperpermeability and a subsequent reduction in leakage from the retinal pigmented epithelium. Most reports on post-PDT changes in choroidal thickness in CSC eyes, however, have focused on the subfoveal choroidal thickness; there have been few reports focusing on changes in perifoveal choroidal thickness. Moreover, no reports have compared whole macular choroidal thickness measurements between the reduced-fluence PDT-treated eyes and normal control eyes.
In the present study, we scanned the whole macular area of patients with CSC by high-resolution spectral-domain OCT using a 3-dimensional radial scan protocol. The choroidal thickness maps were used to study changes in choroidal thickness before and after reduced-fluence PDT and to compare reduced-fluence PDT–treated eyes and normal control eyes.
Methods
This study was approved by the Ethics Committee at Kagawa University Faculty of Medicine and conducted in accordance with the tenets of the Declaration of Helsinki. The current prospective, interventional study included consecutive patients presenting with unilateral treatment-naïve active chronic CSC between July 2, 2012 and March 29, 2013 at the Kagawa University Hospital. Inclusion criteria were as follows: age >20 years and diagnosis of active CSC for at least 6 months, defined as the presence of subretinal fluid involving the macula. The leakage points were unclear with idiopathic diffuse leaks from the damaged retinal pigment epithelium or involved the fovea in fluorescein angiography.
The control group consisted of 54 normal eyes (28 eyes in 21 men and 26 eyes in 16 women; mean age, 54.1 ± 16.8 years). No significant differences existed between the control and CSC patient groups with respect to age, sex, and refractivity. The criteria for exclusion from the study included multiple retinal pigment epitheliopathy, ocular hypertension >21 mm Hg, myopia <−6.0 diopters (D), and a history of intraocular surgery.
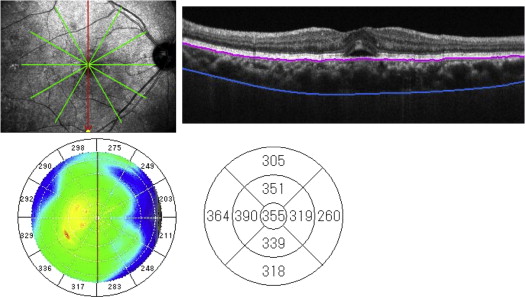
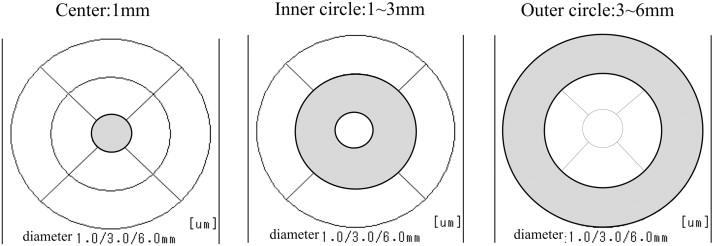
The macular area was examined using the RS-3000 Advance system (NIDEK, Gamagori, Japan) in the choroidal mode ( Figure 1 ). The radial scan consisted of 9-mm line scans in 6 radial directions. The super-fine choroidal mode provides high-resolution images of the choroid. The lines of the retinal pigment epithelium–Bruch membrane complex and the chorioscleral border were segmented automatically by the equipped software with manual correction, if necessary. A choroidal thickness map on the macular area was made and the average choroidal thickness at each Early Treatment Diabetic Retinopathy Study (ETDRS) grid was calculated by the equipped software. Choroidal thickness measurements were taken before and 1, 3, and 6 months after reduced-fluence PDT. The ETDRS map was fused to 3 areas ( Figure 2 ): center, the central circle within a 1-mm diameter; inner circle, a donut-shaped ring with an inner diameter of 1 mm and an outer diameter of 3 mm; and outer circle, a donut-shaped ring with an inner diameter of 3 mm and an outer diameter of 6 mm.
All eyes with chronic CSC underwent reduced-fluence PDT. The maximum diameter of PDT irradiation covered the area of choroidal vascular hyperpermeability in the indocyanine green angiography image and the area with fluorescence leakage in fluorescein angiography. Verteporfin (Visudine; Novartis, Basel, Switzerland) was infused at 6 mg/m 2 body surface area over 10 minutes, and then PDT was performed with a light fluence of 25 J/cm 2 by using a Visulus PDT system 690S (Carl Zeiss Meditec AG, Jena, Germany) 5 minutes after infusion completion.
Statistical analysis was performed by a multiple comparison using the Bonferroni method for changes in choroidal thickness in each sector after PDT and by the Dunnett test for the comparison of choroidal thickness between PDT-treated eyes and normal control eyes (SPSS software version 18.0; IBM Corp, Armonk, New York, USA). P values <.05 were considered statistically significant.
Results
A total of 22 patients (15 men and 7 women) who had 1 eye with active chronic CSC were enrolled. The mean age of the subjects was 55.0 ± 12.2 years. The mean duration of CSC prior to study entry was 8.9 ± 2.7 months (median, 8 months; range, 6–18 months). The leakage point locations observed by fluorescein angiography are shown in Table 1 . One month after reduced-fluence PDT treatment, subretinal fluid resolved completely in all 22 CSC patients, and there were no cases of recurrence during the study period.
| Case | Age (y) | Sex | Affected Eye | Duration of Central Serous Chorioretinopathy (mo) | Leakage Point on Fluorescein Angiography | Photodynamic Therapy Laser Spot Size (μm) | logMAR Visual Acuity | Choroidal Thickness, μm (Pretreatment) | Choroidal Thickness, μm (6 Months) | |||||
|---|---|---|---|---|---|---|---|---|---|---|---|---|---|---|
| Pretreatment | 6 Months | Center | Inner Circle | Outer Circle | Center | Inner Circle | Outer Circle | |||||||
| 1 | 46 | M | OD | 6 | Outer a superior | 4900 | 0.05 | −0.18 | 486 | 456 | 422 | 388 | 368 | 298 |
| 2 | 54 | M | OS | 6 | Inner b temporal | 3800 | −0.08 | −0.18 | 545 | 436 | 343 | 260 | 257 | 237 |
| 3 | 53 | M | OD | 7 | Outer nasal | 4950 | 0.00 | −0.08 | 511 | 492 | 411 | 358 | 344 | 308 |
| 4 | 35 | M | OS | 8 | Inner temporal | 4800 | 0.30 | −0.06 | 533 | 524 | 466 | 357 | 350 | 326 |
| 5 | 47 | F | OD | 9 | Center | 4100 | 0.22 | 0.22 | 365 | 367 | 322 | 319 | 334 | 312 |
| 6 | 51 | M | OD | 10 | Center | 5100 | 0.22 | 0.22 | 527 | 509 | 461 | 458 | 444 | 397 |
| 7 | 51 | M | OS | 11 | Outer temporal | 4050 | −0.18 | −0.18 | 526 | 508 | 453 | 538 | 511 | 429 |
| 8 | 41 | M | OD | 12 | Inner temporal | 3450 | 0.40 | 0.10 | 580 | 543 | 431 | 366 | 350 | 307 |
| 9 | 47 | M | OD | 6 | Inner temporal | 5300 | 0.00 | 0.00 | 368 | 365 | 332 | 250 | 256 | 255 |
| 10 | 55 | M | OD | 7 | Inner nasal | 4850 | 0.10 | 0.05 | 259 | 258 | 227 | 253 | 248 | 232 |
| 11 | 42 | M | OD | 7 | Inner nasal | 3850 | 0.00 | −0.18 | 253 | 267 | 280 | 187 | 213 | 247 |
| 12 | 69 | F | OS | 8 | Center | 4100 | 0.22 | 0.05 | 200 | 192 | 169 | 158 | 154 | 148 |
| 13 | 48 | M | OD | 9 | Inner nasal | 5100 | 0.15 | 0.00 | 347 | 331 | 295 | 309 | 296 | 275 |
| 14 | 77 | M | OD | 10 | Outer nasal | 5050 | 0.52 | 0.22 | 317 | 299 | 255 | 260 | 256 | 235 |
| 15 | 52 | M | OS | 12 | Inner inferior | 4100 | 0.40 | 0.30 | 238 | 237 | 229 | 172 | 188 | 198 |
| 16 | 71 | F | OS | 8 | Outer superior | 4350 | 0.52 | 0.00 | 306 | 304 | 299 | 236 | 233 | 244 |
| 17 | 67 | F | OD | 9 | Outer nasal | 3300 | 0.05 | 0.00 | 277 | 282 | 292 | 334 | 333 | 315 |
| 18 | 52 | M | OD | 7 | Inner nasal | 4600 | 0.22 | 0.10 | 345 | 337 | 307 | 217 | 224 | 233 |
| 19 | 73 | F | OS | 8 | Inner temporal | 4600 | 0.70 | 0.30 | 534 | 417 | 310 | 329 | 320 | 289 |
| 20 | 64 | F | OD | 18 | Center | 2250 | 0.15 | 0.00 | 396 | 369 | 305 | 341 | 322 | 270 |
| 21 | 41 | M | OS | 7 | Center | 2500 | 0.10 | −0.18 | 290 | 279 | 222 | 210 | 210 | 171 |
| 22 | 78 | F | OS | 10 | Outer nasal | 5500 | 0.40 | 0.15 | 383 | 381 | 343 | 394 | 389 | 362 |
a Outer, 1.5–3 mm from the foveal center.
Postoperative Photodynamic Therapy Changes in Choroidal Thickness
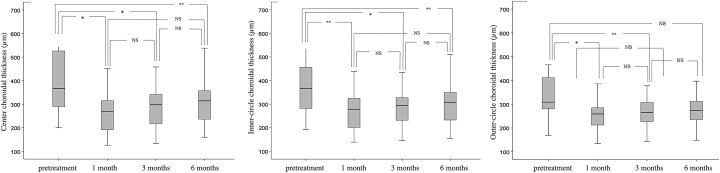
Eyes with chronic CSC showed thickened choroid in the macular area. However, choroidal thickness was reduced after reduced-fluence PDT. The mean center choroidal thickness (390.3 ± 116.3 μm prior to PDT) decreased to 278.1 ± 90.1 μm, 286.6 ± 82.2 μm, and 303.4 ± 92.3 μm ( P = .002, P = .005, and P = .026) at 1, 3, and 6 months post PDT, respectively ( Figure 3 ). In the inner circle there was also a significant decrease from baseline in choroidal thickness at 1, 3, and 6 months post PDT ( P = .03, P = .008, and P = .047, respectively). In the outer circle, however, there was a significant decrease from baseline in choroidal thickness at 1 and 3 months post PDT ( P = .005 and P = .02) but no significant difference from baseline choroidal thickness at 6 months ( P = .118).
Case Report
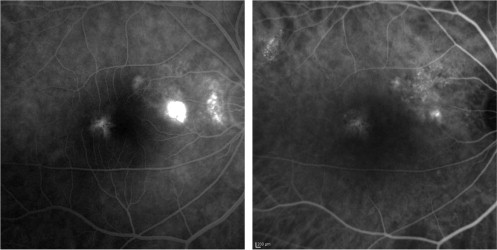
A 53-year-old man had visual disturbance in the right eye from chronic CSC. Extensive serous retinal detachment was seen in the macular area. Fluorescein angiogram showed diffuse leakages. Indocyanine green angiogram showed several areas of choroidal hyperpermeability and punctuate hyperfluorescent spots ( Figure 4 ). His choroidal thickness was 511 μm in the center, 492 μm in the inner circle, and 411 μm in the outer circle. The right eye was treated with reduced-fluence PDT to the areas of choroidal hyperpermeability. Serous retinal detachment resolved completely 1 month after the treatment. No recurrence was seen during the study period. The choroidal thickness decreased to 265 μm in the center, 334 μm in the inner circle, and 261 μm in the outer circle at 1 month post PDT. However, it gradually increased between 3 and 6 months; choroidal thickness increased to 358 μm in the center, 344 μm in the inner circle, and 308 μm in the outer circle at 6 months ( Figure 5 ).
Stay updated, free articles. Join our Telegram channel

Full access? Get Clinical Tree


