Purpose
To investigate the association between corneal biomechanical parameters using the Ocular Response Analyzer (ORA) and glaucoma severity.
Design
Observational cross-sectional study.
Methods
Two hundred ninety-nine eyes of 191 patients with confirmed or suspect glaucoma were recruited at the University of California, San Diego. Corneal hysteresis (CH) and corneal resistance factor (CRF) were obtained from all participants. Standard automated perimetry was done using the 24-2 Swedish Interactive Threshold Algorithm. Retinal nerve fiber layer (RNFL) thickness measurements were obtained using GDx ECC and spectral-domain optical coherence tomography (SD-OCT). The association between ORA parameters and disease severity was evaluated using univariable and multivariable regression models.
Results
CH and CRF were both positively associated with mean defect (MD) (R 2 = 0.03; P < .01 and R 2 = 0.10; P < .01, respectively). In multivariable analysis, the association between CRF and MD remained significant while CH to MD did not ( P < .01 and P = .77). In the GDx ECC subgroup (204 eyes), there was a weak association between CH and CRF and average RNFL thickness (R 2 = 0.07; P < .01 and R 2 = 0.05; P < .01, respectively), which was not observed in the SD-OCT subgroup (146 eyes) (R 2 = 0.01; P = .30 and R 2 = 0.01; P = .21). After adjusting for central corneal thickness, age, and axial length, the relationship of CH and CRF to RNFL thickness no longer reached statistical significance.
Conclusions
The current study found only a weak relationship between corneal biomechanical parameters and measures of structural and functional damage in glaucoma.
Central corneal thickness (CCT) has been identified as a strong predictor for the development of primary open-angle glaucoma (POAG) and shown to be associated with severity of the disease. Recently, it has been suggested that understanding the biomechanical properties of the cornea other than CCT might lead to improvements in the diagnosis and management of glaucoma. Parameters such as elasticity and viscous properties may also influence corneal resistance to applanation and, therefore, intraocular pressure (IOP) measurements obtained by Goldmann applanation tonometry (GAT). Further, there is speculation that corneal biomechanical properties could reflect structural vulnerabilities of the globe that predispose it to the development of glaucoma. A model of eye-wall stress, incorporating CCT, axial length, and IOP, has previously been shown to be able to predict progression to glaucoma. Clinical measurements of biomechanical parameters of the cornea were facilitated by the advent of the Ocular Response Analyzer (ORA; Reichert Ophthalmic Instruments Inc, Depew, New York, USA). The ORA measures the corneal hysteresis (CH) and the corneal resistance factor (CRF) by analyzing the responses of the cornea when submitted to air jet–induced deformation.
Previous studies have shown that CH and CRF are significantly reduced in glaucoma patients compared to normal subjects. Further, they appear to be risk factors for glaucoma progression independent of CCT. In addition, it was observed recently that CH, but not CCT, is associated with optic disc surface deformation induced by acute IOP rise. In this study, it was concluded that corneal biomechanics are related to distensibility of the optic nerve complex, itself serving as a surrogate for the predictive factor of glaucoma pathogenesis.
All these studies, however, only studied the relationship between corneal properties and functional measures of glaucoma. The aim of the current study was to investigate whether there is an association between corneal biomechanical parameters and the severity of glaucoma as defined by the visual field and retinal nerve fiber layer (RNFL) thickness using both spectral-domain optical coherence tomography (SD-OCT) and GDx ECC measurements.
Methods
This was an observational cross-sectional study. Subjects included were part of the longitudinal Diagnostic Innovations in Glaucoma Study (DIGS) conducted at the Hamilton Glaucoma Center, University of California, San Diego.
Each participant underwent a complete ophthalmologic examination, including visual acuity assessment, slit-lamp biomicroscopy, gonioscopy, dilated fundoscopic examination using 78-diopter (D) lens, stereoscopic disc photography, and standard automated perimetry using the 24−2 Swedish Interactive Threshold Algorithm (SAP-SITA; Carl Zeiss Meditec, Inc, Dublin, California, USA). CCT was measured using an ultrasound pachymeter (Pachette DGH 500; DGH Technology, Inc, Philadelphia, Pennsylvania, USA) over an undilated pupil and the mean of 3 readings was recorded. Corneal curvature was obtained using an autorefractor (Humphrey-Zeiss model S97; Carl Zeiss Meditec). Axial length was acquired with the IOLMaster (Carl Zeiss Meditec). To study the influence of corneal biomechanical parameters as measured by the ORA on the visual field and RNFL thickness, we included eyes suspected of having the disease as well as those with confirmed glaucoma. Fellow eyes were excluded if any of the following criteria were met: 1) quality of ORA, visual field, SD-OCT, and/or GDx examinations did not meet minimum quality criteria (see below) or 2) were diagnosed as “normal.”
Ocular Response Analyzer
Participants underwent testing with the Ocular Response Analyzer (software version 2.02, ORA; Reichert Ophthalmic Instruments). Only readings with a waveform score (WS) of ≥7 in a software-generated scale of 0 to 10 were included in data analysis. At least 2 measurements were obtained per eye and the one with the highest-quality WS was retained for the analysis. Briefly, the ORA uses an applied force-displacement relationship by delivering a collimated air pulse on the cornea. The difference between the inward and outward motion applanation pressures (P1 and P2, respectively) owing to the delivered air jet is called corneal hysteresis, and this is measured in millimeters of mercury (mm Hg). CH is assumed to reflect the viscous properties of the cornea as well as its dampening and energy absorption capacity. The ORA also provides the corneal resistance factor, which seems to be an indication of the overall “resistance” or elasticity of the cornea. It is derived from the formula (P1 − kP2), where k is a constant determined from an empirical analysis of the relationship between both P1 and P2 in studies evaluating eyes that underwent corneal change induced by laser in situ keratomileusis (LASIK). The device also provides a Goldmann-correlated intraocular pressure measurement (IOPg) (average of P1 and P2) and a corneal-compensated intraocular pressure (IOPcc). IOPcc is considered to be less affected by corneal properties such as the central corneal thickness.
Standard Automated Perimetry
To be classified as glaucomatous, patients had to have at least 2 consecutive, reliable (fixation losses and false negatives ≤33%, and <15% false positives) and repeatable abnormal standard automated perimetry (SAP) tests using the 24-2 Swedish Interactive Threshold Algorithm with either a pattern standard deviation (PSD) outside the 95% normal limits or a glaucoma hemifield test (GHT) result outside the 99% normal limits. Patients considered suspect for glaucoma had an IOP > 21 mm Hg and/or glaucomatous optic disc damage based on standardized assessment of simultaneous stereophotographs by 2 experienced graders with a minimum of 2 reliable SAP visual fields without evidence of repeatable visual field damage. The Visual Field Assessment Center (VisFACT) reviewed all visual fields and checked for the presence of artifacts such as lid and rim artifacts, fatigue effects, inattention, or inappropriate fixation.
Retinal Nerve Fiber Layer Thickness Measurements
Thickness of the RNFL was measured with the GDx enhanced corneal compensation (GDx ECC; Carl Zeiss Meditec, Dublin, California, USA) and Spectralis SD-OCT (Heidelberg Engineering, Heidelberg, Germany). When there were multiple images during the same visit, the one with the highest-quality scores was chosen for statistical analysis. Measurements with SAP, GDx ECC, SD-OCT, and ORA were taken within 6 months of each other. Since most participants had either SD-OCT or GDx ECC scans, we divided them into an SD-OCT and a GDx ECC subgroup.
Patients were imaged using a commercially available scanning laser polarimeter with enhanced corneal compensation (GDx ECC; Carl-Zeiss Meditec). The general principles of scanning laser polarimetry and the algorithms used for enhanced corneal compensation have been described in detail elsewhere. An experienced examiner masked to the subject’s identity and results of the other tests assessed the quality of the GDx images. A good-quality image required a focused and evenly illuminated reflectance image with a centered optic disc. The image quality score had to be greater than or equal to 7 and the typical scan score (TSS) greater than or equal to 80. RNFL retardation measurements were obtained on a 3.2-mm-diameter calculation circle around the optic nerve head. The GDx provides measurements of RNFL retardation, which are converted to estimated RNFL thickness using a fixed conversion factor.
The Spectralis OCT (Spectralis HRA+OCT, software version 5.3.0.0; Heidelberg Engineering) device uses a dual-beam SD-OCT and a confocal laser scanning ophthalmoscope that works by emitting a superluminescent diode light with a center wavelength of 870 nm and an infrared scan to simultaneously provide images of ocular microstructures. The Spectralis OCT device incorporates a real-time eye tracking system that couples confocal laser scanning ophthalmoscope and SD-OCT scanners to adjust for eye movements and to ensure that the same location of the retina is scanned over time. The protocol used was the RNFL circle scan, which consists of 1024 A-scan points from a 3.45-mm circle centered on the optic disc. All patients had their corneal curvature input into the machine before the examination. The examiner is required to manually place the scan around the optic disc. The acquisition rate of the device is 40 000 A-scans per second at an axial resolution of 3.9 μm. The instrument includes scan averaging to reduce noise, thus increasing the effective acquisition time. To be included, all images were reviewed for noncentered scans and had to have a signal strength >15 dB. The images were reviewed by the Information and Data Evaluation Analysis (IDEA) reading center, based at the University of California, San Diego.
Statistical Analysis
Data are presented as means and standard deviations (SD). Initially, the associations between variables were evaluated using scatterplots and locally weighted scatterplott smoothing (LOWESS). A linear regression modeling technique was used to study the effect of biomechanical properties of the cornea (CCT, CRF, and CH) on visual field mean defect (MD), PSD, and RNFL thickness measurements. Initially, univariable regression models were fitted with MD, PSD, or average RNFL thickness (for the SD-OCT and GDx ECC groups) as dependent variables and CH as independent variable. Similar models were built with CRF as independent variable. Subsequently, multivariable models were built to evaluate the effect of corneal biomechanical properties on visual field indices and RNFL thickness while adjusting for other parameters such as age, CCT, and axial length. As measurements from both eyes of the same individual are likely to correlate, the use of standard statistical methods for parameter estimation can lead to underestimation of standard errors and to confidence intervals that are too narrow. Therefore, to account for the fact that both eyes of some patients were included in the analyses, generalized estimating equations (GEE) with robust standard errors (Huber-White sandwich variance estimator) were used to adjust for these potential correlations.
All tests were 2-sided and a P value less than .05 was considered statistically significant. Statistical analyses were performed using Stata 10.0 (StataCorp, College Station, Texas, USA).
Results
This study included a total of 299 eyes of 191 participants (151 suspect and 148 glaucoma eyes), of which 146 eyes of 92 participants had undergone SD-OCT imaging (84 suspect and 62 glaucoma eyes) and 204 eyes of 142 participants had GDx ECC imaging (98 suspect and 106 glaucoma eyes). The mean age of the participants was 68.1 years (SD 11.0 years; range 30−91 years). Of these, 182 (60.8%) were female. Forty-three individuals (51 eyes) participated in both subgroups. There was no significant difference in their demographic characteristics from the rest of the study population. Demographic and clinical characteristics are compared in Table 1 .
| Variable | Visual Field Group | SD-OCT Subgroup | GDx ECC Subgroup | ||||||
|---|---|---|---|---|---|---|---|---|---|
| Suspect Glaucoma | Established Glaucoma | P Value | Suspect Glaucoma | Established Glaucoma | P Value | Suspect Glaucoma | Established Glaucoma | P Value | |
| (n = 151 eyes) | (n = 148 eyes) | (n = 84 eyes) | (n = 62 eyes) | (n = 98 eyes) | (n = 106 eyes) | ||||
| Age (years) | 65.5 ± 11.4 | 70.9 ± 9.9 | <.01 | 65.4 ± 10.9 | 71.8 ± 8.1 | <.01 | 64.9 ± 11.9 | 70.5 ± 10.7 | <.01 |
| Sex (female) | 100 (66%) | 82 (55%) | .18 | 55 (65%) | 35 (56%) | .55 | 58 (59%) | 58 (55%) | .56 |
| Ancestry (African descent) | 31 (20%) | 56 (37%) | .04 | 22 (26%) | 25 (40%) | .04 | 12 (12%) | 37 (35%) | <.01 |
| MD (dB) | −0.38 ± 1.6 | −3.3 ± 3.3 | <.01 | −0.4 ± 1.3 | −3.8 ± 3.5 | <.01 | −0.3 ± 1.8 | −3.0 ± 3.3 | <.01 |
| PSD (dB) | 1.6 ± 0.9 | 4.0 ± 3.0 | <.01 | 1.5 ± 0.3 | 4.5 ± 3.1 | <.01 | 1.7 ± 1.2 | 3.8 ± 2.9 | <.01 |
| CCT (μm) | 561.9 ± 41.9 | 546.1 ± 39.9 | <.01 | 557.3 ± 39.1 | 539.6 ± 42.2 | <.01 | 567.2 ± 43.6 | 545.9 ± 38.7 | <.01 |
| AL (mm) | 23.9 ± 1.2 | 23.9 ± 1.2 | .88 | 24.0 ± 1.2 | 23.8 ± 1.0 | .27 | 24.2 ± 1.3 | 23.9 ± 1.3 | .26 |
| Average RNFL thickness | — | — | — | 92.8 ± 11.5 | 82.5 ± 16.4 | <.01 | 48.4 ± 5.2 | 45.0 ± 7.7 | <.01 |
| ORA parameters | |||||||||
| CH (mm Hg) | 10.4 ± 1.7 | 9.4 ± 1.7 | <.01 | 10.1 ± 1.7 | 9.2 ± 1.7 | <.01 | 10.6 ± 1.7 | 9.4 ± 1.7 | <.01 |
| CRF (mm Hg) | 10.7 ± 2.1 | 9.4 ± 2.0 | <.01 | 10.5 ± 2.0 | 8.9 ± 2.1 | <.01 | 10.8 ± 2.2 | 9.5 ± 2.0 | <.01 |
| IOPg (mm Hg) | 16.6 ± 4.5 | 15.0 ± 5.6 | <.01 | 16.6 ± 4.7 | 13.7 ± 5.9 | <.01 | 16.3 ± 4.3 | 15.3 ± 5.3 | .11 |
| IOPcc (mm Hg) | 16.9 ± 4.1 | 16.6 ± 5.4 | .22 | 17.3 ± 4.4 | 15.7 ± 5.8 | .14 | 16.5 ± 3.7 | 16.9 ± 5.1 | .55 |
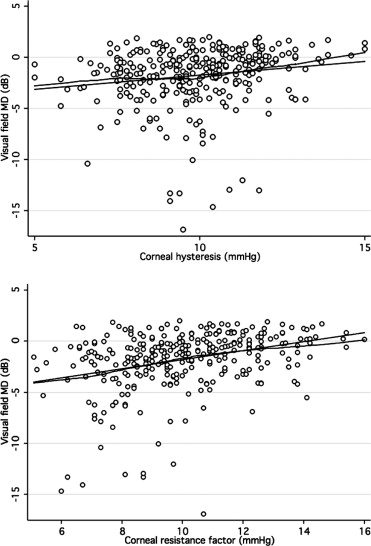
Figure 1 shows scatterplots of ORA parameters (CH and CRF) vs visual field MD. The observed relationship was close to linear. There was a significant, albeit weak, positive correlation between CH and MD (R 2 = 0.03; P < .001) as well as PSD (R 2 = 0.01; P < .02). Similar correlations were found between CRF and MD (R 2 = 0.1; P < .001) and CRF and PSD (R 2 = 0.1; P < .001). CCT was also positively associated with MD and PSD (R 2 = 0.06; P < .01 and R 2 = 0.04; P < .01, respectively). Men had lower mean CH (9.6 vs 10.1 mm Hg) and CRF (9.8 vs 10.2 mm Hg) than women, although these differences were not statistically significant. A negative correlation was found between age and CH (R 2 = 0.09; P < .01) and CRF (R 2 = 0.09; P < .01). This relationship was equally strong for both sexes. In multivariable regression models adjusting for CCT, age, and axial length, the relationship between CRF and both visual field indices remained statistically significant ( P < .01 for both MD and PSD) while the association between CH and visual field indices did not ( P = .78 for MD and P = .60 for PSD) ( Table 2 ). CCT was significantly related to PSD and MD in the multivariable models that included CH.
| Dependent Variable | Independent Variable | Coefficient (RSE) | P Value |
|---|---|---|---|
| MD | CH (mm Hg) | 0.03 (0.10) | .78 |
| Age (years) | −0.03 (0.01) | .04 | |
| CCT (μm) | 0.02 (0.01) | <.01 | |
| Axial length (mm) | −0.01 (0.12) | .97 | |
| CRF (mm Hg) | 0.34 (0.11) | <.01 | |
| Age (years) | −0.02 (0.01) | .24 | |
| CCT (μm) | 0.01 (0.01) | .23 | |
| Axial length (mm) | 0.07 (0.17) | .72 | |
| PSD | CH (mm Hg) | −0.05 (0.10) | .60 |
| Age (year) | 0.01 (0.01) | .60 | |
| CCT (μm) | −0.01 (0.01) | .02 | |
| Axial length (mm) | −0.10 (0.17) | .54 | |
| CRF (mm Hg) | −0.38 (0.11) | <.01 | |
| Age (year) | −0.01 (0.01) | .54 | |
| CCT (μm) | −0.01 (0.00) | <.97 | |
| Axial length (mm) | −0.18 (0.16) | .27 |
Stay updated, free articles. Join our Telegram channel

Full access? Get Clinical Tree


