Identification tests
Thresholds tests
Identification and threshold tests
Identification, threshold, and discrimination tests
University of Pennsylvania Smell Identification Test (UPSIT) (Doty et al. 1984)
T&T olfactometer (Takagi 1987)
Connecticut Chemosensory Clinical Research Center Test (CCCRC) (Cain et al. 1983)
Smell diskettes test (Briner and Simmen 1999)
Alcohol sniff test (AST) (Davidson and Murphy 1997)
Combined olfactory test (COT) (Robson et al. 1996)
Eloit and Trotier Olfactory Test (Trotier et al. 2007)
Odorant confusion matrix (Wright 1987)
Random test (Kobal et al. 2001)
Dutch odor identification test (GITU) (Hendriks 1988)
YN-odor identification test (YN-OIT) (Corwin 1989)
San Diego odor identification test (SDOIT) (Murphy et al. 2002)
Cross-Cultural Smell Identification Test (CC-SIT) (Doty et al. 1995)
Candy Smell Test (CST) (Renner et al. 2009)
Culturally Adjusted University of Pennsylvania Smell Identification Test (CA-UPSIT) (Ahlskog et al. 1998)
Scandinavian Odor-Identification Test (SOIT) (Nordin et al. 1998)
Pocket Smell Test (Duff et al. 2002)
Kremer et al. (1998)
Sniffin’ Sticks screening test (Hummel et al. 2001)
Barcelona Smell Test (BAST-24) (Guilemany et al. 2009)
Nez du vin Smell Test (McMahon and Scadding 1996)
Retronasal test of olfactory function (Heilmann et al. 2002)
30.2.1 Orthonasal Olfactory Function
The evaluation of the orthonasal olfactory function is most often performed using psychophysical test such as Sniffin’ Sticks test (Kobal et al. 1996; Hummel et al. 2007b) or the University of Pennsylvania Smell Identification Test (UPSIT) (Doty et al. 1984). The majority of odor tests are forced choice, meaning that the subject must provide a response even if no odor is perceived. The Sniffin’ Sticks test (Fig. 30.1) consists of pen-like odor-dispensing devices that are presented in front of the nose of the patient. There exist two versions of the Sniffin’ Sticks test: the screening test and the extended version. The screening test version is based on an odor identification test of 12 different odorants (Hummel et al. 2001). The extended version encompasses three different approaches, namely, tests for odor threshold (T), odor discrimination (D), and odor identification (I). The odor thresholds for n-butanol are assessed using a single-staircase, three-alternative forced-choice procedure. The odor discrimination is also assessed using a triple forced-choice procedure. Triplets of pens are presented to the subject, with two containing the same and one containing one different odorant. Finally, odor identification is assessed for 16 common odors using a multiple-choice task identification of individual odors from a list of four descriptors. To judge olfactory function, results from the three subtests are summed up to provide a total TDI score with a maximum of 48 points (Kobal et al. 1996; Hummel et al. 2007b). The UPSIT uses 40 items. It encompasses four “scratch and sniff” booklets. Odorants are embedded in microcapsules placed on strips at the bottom of the page of booklets. The stimuli are released by scratching the strip with a pencil, and subjects have to choose one of the four proposed descriptors that best correspond to the respective odor (Doty et al. 1984; Tourbier and Doty 2007).
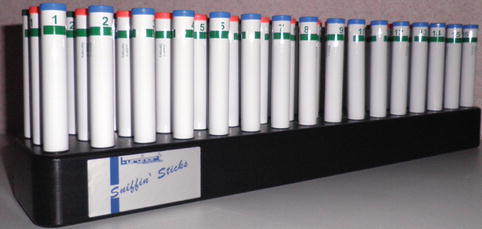
Fig. 30.1
Sniffin’ Sticks test. The Sniffin’ Sticks test consists of pen-like odor-dispensing devices that are presented in front of the nose of the patient. The extended version encompasses three different approaches, namely, tests for odor threshold (T), odor discrimination (D), and odor identification (I). To judge olfactory function, results from the 3 subtests, each quoted out of 16, are summed up to provide a total TDI score with a maximum of 48
30.2.2 Retronasal Olfactory Function
Retronasal olfaction is assessed following a standardized method using a row of 20 items. The substances presented to the subjects are grocery store condiments and food items available in powder (e.g., spices, instant soup). Powderized substances are applied using squeezable plastic vials (Fig. 30.2) in the middle of the tongue inside the oral cavity. Before application of the first stimulant and after each trial, subjects rinsed their oral cavity with tap water, in order to minimize the interindividual differences in salivation, which might interfere with the release of odorants. Each substance is identified by means of a 4-verbal-item forced-choice procedure (Heilmann et al. 2002).
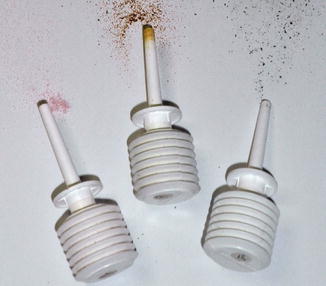
Fig. 30.2
Retronasal testing. Psychophysical evaluation of olfactory function may be assessed retronasally by applying powderized substances in the middle of the tongue using squeezable plastic vials. Each substance is identified by means of a 4-verbal-item forced-choice procedure
These orthonasal and retronasal tests have the advantage of being easy to implement, having been validated in multicenter studies (Heilmann et al. 2002, 2007b), and of having high test-retest reliability (Doty et al. 1984; Heilmann et al. 2002; Haehner et al. 2009). There is a correlation between the orthonasal and retronasal score (Rombaux et al. 2009c) (Fig. 30.3). However, these tests have the disadvantage of being semi-objective and of being subjects to the patient’s response bias. This may constitute a major issue when evaluating patients with olfactory disorder, particularly within a medicolegal context.
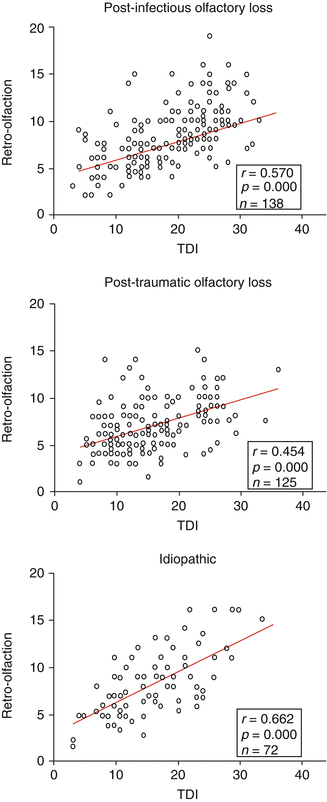
Fig. 30.3
Correlation between orthonasal and retronasal olfactory function. Figure illustrates the correlation between orthonasal and retronasal olfactory function in cohorts of patients suffering from postinfectious olfactory loss, posttraumatic olfactory loss, and idiopathic olfactory loss (unpublished data)
30.3 Electrophysiological Evaluation
Electrophysiological techniques are widely used to provide a relatively unbiased evaluation of sensory systems. Unlike other sensory modalities (auditory, visual, somatosensory), the use of electrophysiological recordings to assess the chemosensory system in humans was not possible for a long time. This was mostly due to the difficulty to produce selective and controlled olfactory stimulus (Moncrief 1962). Indeed, the major difficulties consist in delivering odorants on the mucosa without producing artifacts such as thermal, tactile, or nociceptive co-activation.
The development of stimulation devices allowing delivering selective stimuli opened new perspectives for exploring noninvasively how the human brain processes chemosensory information. This was interesting not only for basic scientists but also for clinicians, since we know that certain clinical situation, such as examining demented patients or children, or even medicolegal situation requires unbiased tests (Hummel et al. 2000, 2010a; Rombaux et al. 2009a, c).
30.3.1 Olfactometer
Early stimulation techniques relied on the delivery of brief, odorized air pulses. Inevitably, the sudden increase in airflow associated with the presentation of an air puff activates mechano-sensitive trigeminal afferents and will produce brain responses, irrespective whether subjects would perceive the chemical stimulus or not.
In 1978, Kobal and Plattig (1978) introduced a device capable of delivering transient chemosensory stimuli to the olfactory neuroepithelium of the nasal mucosa. This air-dilution olfactometer delivers pulses of odorants embedded within a constant airflow at a constant temperature and humidity, thus avoiding concomitant mechanical or thermal stimulation of the nasal mucosa, making it possible to study brain responses related specifically to the activation of chemosensitive afferents (Fig. 30.4). Furthermore, using specific odorants, the device can be used to activate olfactory and trigeminal chemosensory receptors relatively selectively. For example, 2-phenylethanol is regarded as a relatively specific olfactory stimulant. It can be used to elicit olfactory event-related potentials (ERP). In contrast, gaseous CO2 is regarded to be virtually odorless, but produces irritating sensations. It is used to elicit trigeminal chemosensory ERP (Kobal 1981; Hummel and Kobal 1999; Lotsch and Hummel 2006; Rombaux et al. 2006a, b, c, 2007). Several studies have shown that this technique can be used to explore the cortical processing of olfactory and trigeminal chemosensory input in humans, through the recording of olfactory and trigeminal ERP (Pause and Krauel 2000; Rombaux et al. 2006a, b, c; Laudien et al. 2008). In addition, it has been shown that olfactory and trigeminal ERP exhibit a good test-retest reliability and were thus valuable for the clinical evaluation of patients (Hummel et al. 2000; Thesen and Murphy 2002; Welge-Lussen et al. 2003; Rombaux et al. 2009a, c).
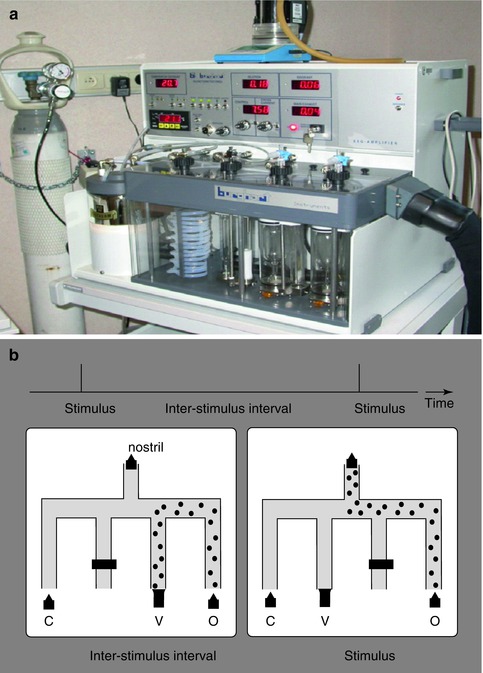
Fig. 30.4
Olfactometer. (a) Electrophysiological assessment of olfactory and trigeminal chemosensory function requires the use of an olfactometer that produces transient chemosensory stimuli to the olfactory neuroepithelium of the nasal mucosa. (b) The air-dilution olfactometer delivers pulses of odorants embedded within a constant airflow at a constant temperature and humidity, avoiding concomitant mechanical or thermal stimulation of the nasal mucosa (Olfactometer OM2S, Burghart Medical Technology, Wedel, Germany)
30.3.2 EEG Data Analyses
30.3.2.1 Time-Domain Averaging
Until now, the electroencephalographic (EEG) responses to chemosensory stimulation have been identified mainly using across-trial averaging in the time domain. This procedure cancels out changes in the EEG signal that are not strictly time locked and phase locked to the stimulus onset and, thereby, enhances the signal-to-noise ratio of time-locked ERP (Hummel et al. 1998; Pause and Krauel 2000; Rombaux et al. 2006a, b, c; Boesveldt et al. 2007; Mouraux and Iannetti 2008). Using such an approach the EEG responses to chemosensory stimulation have been characterized as a negative wave peaking approximately 320–500 ms after stimulus onset (N1), followed by a late positive wave peaking approximately 450–800 ms after stimulus onset (termed as P2 and/or P3) (Kobal 1985; Hummel and Kobal 1992; Pause et al. 1996; Geisler and Murphy 2000; Rombaux et al. 2006a, b, c; Hummel et al. 2010a; Haehner et al. 2011) (Fig. 30.5). All of these responses exhibit largest amplitudes over the midline recording sites. While the centro-parietal maximum for the N1 amplitude is commonly observed for olfactory responses, a more central maximum is observed for trigeminal stimuli (Kobal 1985; Geisler and Murphy 2000; Livermore and Hummel 2004; Olofsson et al. 2006; Hummel et al. 2010a).
Unfortunately, chemosensory ERPs – in particular, olfactory ERPs – usually exhibit a low signal-to-noise ratio (Lotsch and Hummel 2006; Boesveldt et al. 2007; Rombaux et al. 2007). Hence, although the recording of chemosensory ERPs is considered as a technique having great potentials, its clinical usefulness remains limited, particularly in the context of clinical diagnosis.
Conventional time-domain averaging presents some drawbacks, which could contribute to the low signal-to-noise ratio of chemosensory ERPs. First, temporal jitter could affect the brain responses to chemosensory stimulation. This jitter would result from the variability in timing of the different steps separating the occurrence of the sensory event and the occurrence of a cortical response. If this jitter is significant, the elicited ERPs will be cancelled out by the time-domain averaging procedure, as the responses are no longer stationary across trials. Because of all steps implied in chemosensory transduction, it is reasonable to expect that the responses to chemosensory stimulation are subject to a significant amount of jitter and that this jitter leads to an important distortion of the averaged ERP waveform. Second, time-domain averaging is unable to reveal any transient event-related modulation of the power of ongoing EEG oscillations (i.e., event-related desynchronization and event-related synchronization), which are thought to reflect cortical activation or deactivation, as these oscillations are cancelled out by conventional time-domain averaging procedures.
Taken together, time-domain averaging is thus blind to a significant fraction of the elicited EEG response (ERPs subject to a significant amount of temporal jitter, ERD, and ERS). This could contribute to explain why CSERPs are sometimes difficult to identify even in healthy subjects.
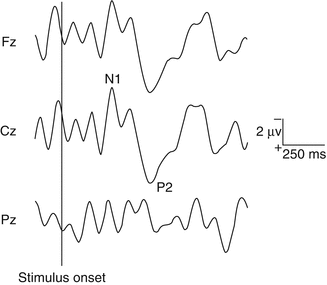
Fig. 30.5
Olfactory chemosensory ERPs (Fz, Cz, Pz vs. A1A2) in one healthy normosmic volunteer. 2-Phenylethanol (50 %v/v) was used to selectively activate olfactory afferents. 30 stimuli of each chemical were presented, lasting 200 ms (20-ms rise time), separated by a 60-s interstimulus interval. Olfactory stimulation elicited an olfactory event-related potential (OERP). Two distinct peaks can be identified, maximal at the scalp vertex: N1 and P2
30.3.2.2 Time-Frequency Analysis
Time-frequency analysis constitutes an alternative approach to reveal activity that is induced by a chemosensory stimulus, but not sufficiently stationary across trials to be revealed by classic averaging in time domain. In this way, it could increase the signal-to-noise ratio of chemosensory EEG responses. Different methods exist to perform a time-frequency decomposition of EEG epochs. These methods rely on techniques to estimate within each EEG epoch the amplitude of the signal as a function of time and frequency, regardless of the phase. The obtained time-varying expressions of oscillation amplitude are then averaged across trials, thereby disclosing both phase-locked and non-phase-locked modulations of signal amplitude, provided that these modulations are relatively well time locked to the onset of the event and consistent in frequency. Identified in the time-frequency domain, EEG responses to sensory stimulation can be characterized by their latency, their frequency, their magnitude (often expressed as percentage relative to baseline), and their scalp distribution (Mouraux and Iannetti 2008). Several approaches have been proposed. At present, the continuous wavelet transform (CWT) is frequently used, as it is particularly well suited for the analysis of EEG signals. Indeed, by adapting the window width as a function of the estimated frequency, the CWT offers an optimal compromise for time-frequency resolution and is thus adequate for the evaluation of event-related modulations of the EEG spectrum within a wide range of frequencies (Mouraux and Iannetti 2008). The CWT can be performed in two ways. First, it can be applied at the level of each single EEG epochs (CWT-SINGLE). Second, it can be applied to the ERP waveforms obtained by averaging signals in the time domain (CWT-AVERAGE). The CWT-SINGLE transform enhances the signal-to-noise ratio of all time-locked EEG responses, regardless of whether they are phase locked to the onset of the stimulus, i.e., ERPs even when subject to a significant amount of temporal jitter, ERS, and ERD. In contrast, the CWT-AVERAGE average transform yields a time-frequency representation of the signals obtained using conventional time-domain averaging and will thus contain only EEG responses that are consistently phase locked to the stimulus. Therefore, EEG responses that are visible in both the CWT-SINGLE and CWT-AVERAGE can be considered as phase locked, whereas activities that are visible only in the CWT-SINGLE can be considered as non-phase locked (ERPs subject to jitter, ERS, and ERD) (Mouraux and Iannetti 2008). We have recently shown that the time-frequency approach markedly improved the signal-to-noise ratio of the EEG responses to chemosensory stimulation (in particular following olfactory stimulation), in comparison to conventional time-domain averaging. In addition, this approach allowed characterizing for the first time non-phase-locked components (ERS and ERD) that could not be identified using conventional time-domain averaging (Huart et al. 2012).
30.3.2.3 Event-Related Source Imaging
It is generally agreed that EEG has a high temporal resolution but a poor spatial resolution, whereas techniques based on hemodynamic measures (e.g., BOLD fMRI) have a poor temporal resolution but a high spatial resolution (Luck 2005). Although source analysis techniques are more appropriate to localize signals originating close to the scalp surface, several recent studies have suggested that EEG responses originating from deep brain structures can also be recorded and localized accurately (Kettenmann et al. 2001; Zumsteg et al. 2005). Source localization methods rely on mathematical models of the bioelectrical generators and the volume conductors within which they lie. The key limitation of these methods is that the inverse problem is highly undetermined and some assumptions have to be made when solving it. Hence, the validity of the obtained source configuration is strongly conditioned by the validity of these assumptions (e.g., assumptions concerning the number of sources or their approximate location). Source analysis of CSERP is probably particularly problematic, not only because of the relatively deep location of the hypothesized sources but also because multiple bilateral sources are thought to be simultaneously active, thus making it difficult to draw significant conclusions. Nevertheless, using high-resolution EEG, some researchers have attempted to localize the cortical structures generating the different components of CSERPs (Miyanari et al. 2006; Lascano et al. 2010). For example, in an attempt to provide information on the spatiotemporal sequence of information processing in the olfactory pathway, Lascano et al. (2010) performed source analysis of CSERPs, in which they suggested that olfactory input is processed first in the medial and lateral temporal cortex of the hemisphere ipsilateral to the stimulated nostril and only subsequently in the corresponding structures of the contralateral hemisphere. Until now, no clinical studies have been performed using such an analysis.
30.4 Imaging Evaluation
Advances in medical imaging allowed better morphological representation of chemosensory pathways and brain structures associated with chemosensory perception. Imaging modalities that are the frequently used in the clinical evaluation of patients include the computer tomography (CT) scan and magnetic resonance imaging (MRI). Recently, functional imaging became available.
30.4.1 Structural Imagery
MRI is the imaging modality of choice to evaluate the olfactory apparatus since it allows examining the olfactory bulb, olfactory tract, olfactory sulcus, and central olfactory projection areas (Fig. 30.6).
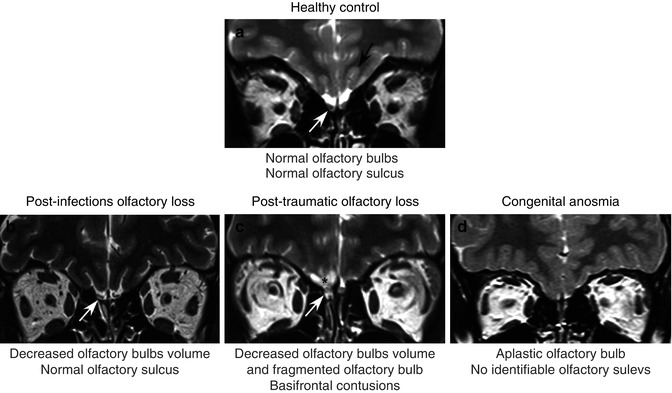
Fig. 30.6
MRI coronal T2-weighted 2-mm-thick views using fast spin-echo (FSE) sequence. Figure shows comparative pictures between control subject with normal olfactory function (a) and patients suffering from postinfectious olfactory loss (b), posttraumatic olfactory loss (c), and congenital anosmia (d). The control subject has normal olfactory bulbs (white arrow) and olfactory sulcus (black arrows). In contrast, the patient with postinfectious olfactory loss (b) has decreased olfactory bulb volume (white arrow), and the patient suffering from posttraumatic (c) olfactory loss exhibits fragmented olfactory bulb (white arrow) and basifrontal contusion, principally in the right gyrus rectus (black asterisk). Finally, the patient with congenital anosmia (d) has no identifiable olfactory bulbs and olfactory sulcus
The olfactory bulb is often considered as the most important relay station in odor processing, and the olfactory bulb volume, assessed with MRI-based volumetric analyses, seems to be connected to the functional state of the olfactory system. Indeed, it was established that there was a good correlation between the olfactory bulb and the olfactory function not only in adults but also in children (Buschhuter et al. 2008; Hummel et al. 2011). Therefore, the assessment of the olfactory bulb volume is useful in the clinical evaluation of patients suffering from olfactory disorders. Several studies have shown that olfactory bulb volume was decreased in patients with postinfectious olfactory loss (Mueller et al. 2005; Rombaux et al. 2006a, b, c), posttraumatic olfactory loss (Yousem et al. 1996, 1999; Mueller et al. 2005; Rombaux et al. 2006a, b, c), idiopathic olfactory loss (Rombaux et al. 2010), congenital anosmia (Abolmaali et al. 2002), neurodegenerative disorder (Thomann et al. 2009), and psychiatric disease (Turetsky et al. 2000). Interestingly, a recent study conducted by Gudziol et al. (2009) showed that the olfactory bulb had a plasticity, since its volume can increase after treatment for chronic rhinosinusitis.
The olfactory sulcus is linked to the development of the olfactory system since it receives projections from the olfactory bulb and tract. Hummel et al. showed that the depth of the olfactory sulcus in the plane of the posterior tangent through the eyeball (PPTE) was related to the overall olfactory function in healthy subjects (Hummel et al. 2003). It was also demonstrated that the depth of the OS in the PPTE was significantly smaller in patients with congenital anosmia (Abolmaali et al. 2002; Huart et al. 2011). The assessment of the OS in the PPTE is easy and quick to perform (Rombaux et al. 2009b) and should be considered as a standard in the evaluation of congenital anosmia (Huart et al. 2011). Nevertheless, it is still unknown if an acquired modification of sensory input may lead to morphological changes of OS. A recent study based on voxel-based morphometry has shown that in cases of acquired anosmia, there was a significant volume decrease in grey matter in primary as well as in secondary olfactory cortex (Bitter et al. 2011) (see below).
Central olfactory projection areas can also reveal abnormalities in pathologic situations. For example, in posttraumatic olfactory loss, contusions in basofrontal and temporal areas can be noted (Collet et al. 2009). In patients with multiple sclerosis, there seems to exist a correlation between smell loss and the lesions load in brain olfactory areas (Doty et al. 1998; Zorzon et al. 2000). In patients suffering from Alzheimer’s disease, neurodegeneration in olfactory bulb and tract and mediotemporal lobe seem to be linked (Thomann et al. 2009). In addition, MRI can also reveal tumoral process in the brain, being responsible for the olfactory disorder (Choi et al. 2009; Mahdavi et al. 2009; Darie et al. 2010). Although MRI is the imaging modality of choice, CT scan can also be useful in the assessment of patients with olfactory dysfunction, mostly when associated with a rhinologic disease (i.e., chronic rhinosinusitis). CT is particularly useful for the diagnosis of olfactory cleft disease (Biacabe et al. 2004; Jankowski et al. 2007).
Stay updated, free articles. Join our Telegram channel

Full access? Get Clinical Tree


