Purpose
To determine the repeatability of corneal thickness and keratocyte density using in vivo confocal scanning laser microscopy in a rabbit model of laser in situ keratomileusis.
Design
Prospective, experimental animal study.
Methods
En face tomographic images of corneal tissue were captured from 5 New Zealand white rabbits. Central corneal thickness was compared with conventional ultrasonic pachymetry. Keratocyte density was measured as a function of stromal depth at baseline and 6 weeks after a 130-μm lamellar incision in the following regions: first countable stromal image (30 to 39 μm), anterior stroma (40 to 75 μm), incision zone (76 to 150 μm), mid stroma (151 to 250 μm), and deep stroma (251 to 400 μm).
Results
The mean residual difference between ultrasonic and confocal corneal thickness measurements was 2.1 μm (95% confidence interval [CI], −7.0 to 11.2 μm; P = .61). Before the lamellar incision, keratocyte density was highest in the first countable frame of the anterior stroma, 53 800 cells/mm 3 (95% CI, 35 000 to 72 000 cells/mm 3 ) and was least in deep stroma, 27 100 cells/mm 3 (95% CI, 22 400 to 32 000 cells/mm 3 ). Six weeks after stromal lamellar incision, keratocyte density was unchanged in the first countable frame of the anterior stroma, 43 700 cells/mm 3 (95% CI, 31 800 to 55 500 cells/mm 3 ; P = .29). There were no changes in cell density in deeper stromal regions.
Conclusions
There was excellent agreement between ultrasonic and confocal microscopy measurements of corneal thickness. In vivo repeatability of keratocyte density estimation using scanning laser confocal microscopy is comparable with the results of previous reports using tandem-scanning confocal microscopy. Keratocyte density was more varied, but not significantly different, in the anterior-most corneal stroma 6 weeks after a lamellar incision.
Corneal thickness is one of the primary parameters that determine the structural integrity of the cornea. It is reduced in keratoconus and other ectatic degenerations and has been shown to decrease with prostaglandin analog use for the treatment of glaucoma. Keratocytes, the resident fibroblastic cells of the cornea, are responsible for maintenance and integrity of corneal tissue, and their physiology, morphologic features, and numbers are altered by clinical treatments such as corneal refractive surgery, ultraviolet corneal cross-linking, mitomycin C use, and other common interventions. In this study, we evaluated the use of in vivo scanning laser confocal microscopy to evaluate the accuracy and repeatability of in vivo measurements of corneal thickness and keratocyte density to determine the suitability of these measurements for laboratory and clinical studies of these structural parameters.
There are several clinical instrument designs available for in vivo confocal microscopy that provide en face optical tomographic sections of the cornea and other anterior segment tissues based on backscattered illumination principles that do not rely on exogenous contrast agents. McLaren and associates compared corneal thickness and cell density measurements using different in vivo confocal microscope designs and showed that these parameters differ based on the design principles of the confocal microscope. Likewise, others have shown that measurements of cell density and corneal thickness differ from other standard measurement techniques, for example, specular microscopy or ultrasonic pachymetry. Recent reviews of this clinical imaging technology are available.
Nipkow disc-based tandem scanning instruments were one of the first designs capable of providing in vivo microscopic images with micron-level resolution. The optical inefficiency of these instruments requires relatively high illumination levels and longer image acquisition times, which has limited their clinical use. A scanning-slit microscope design was introduced in the 1980s (Nidek, Inc, Freemont, California, USA), and although light levels remain somewhat high, this design is optically more efficient and provides improved image contrast and reduced acquisition times. As with tandem scanning confocal microscopes, the scanning-slit confocal objective lens is coupled to the ocular surface with a viscous fluid interface during imaging. Ocular pulsations, patient movements, or instrument movements relative to the objective lens are some of the factors that add to the variability and uncertainty of lateral position and axial imaging plane (z-axis). An ocular fixation device, the Z-ring adapter, was developed to help stabilize the axial position of the eye relative to the confocal microscope objective lens.
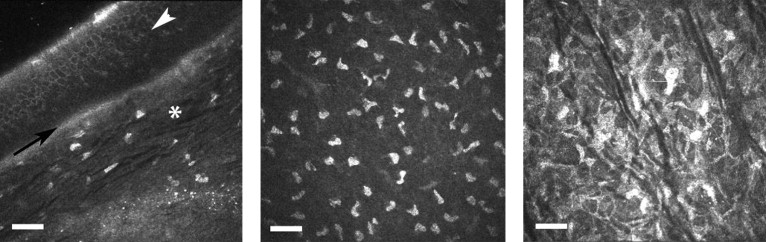
More recently, a corneal confocal lens module was developed to adapt a retinal confocal scanning laser microscopy system for corneal imaging (Rostock Corneal Module; Heidelberg Engineering, GmbH, Vista, California, USA). This laser-illuminated confocal imaging system provides greater image contrast relative to scanning-slit or spinning disc confocal designs and provides high-contrast images of corneal microstructure with micron-level resolution. This imaging method affords both en face and transverse views of the tissue ( Figure 1 ) . This laser confocal system is designed to contact tissue when imaging. Although this does not prevent lateral movements of the eye during imaging, this contact design effectively minimizes axial movements of the eye, reducing uncertainty associated with scan depth.
The purpose of this study was to assess the ability to estimate keratocyte density and central corneal thickness using a rabbit model of corneal refractive surgery. The specific objectives of this study were (1) to assess the agreement of corneal thickness measurements between ultrasonic pachymetry and laser confocal microscopy, (2) to evaluate the depth plane resolution of the laser confocal microscope, (3) to assess the repeatability of keratocyte density estimates by this imaging method, and (4) to determine the effects of a lamellar incision on measured keratocyte density.
Methods
This was a prospective, experimental study design. The subjects for this study were 5 adult New Zealand white rabbits (2 male and 3 female). This research was reviewed and approved by the local Institutional Animal Care and Use Committee and all procedures conformed to the Association for Research in Vision and Ophthalmology Statement for the Use of Animals in Ophthalmic and Visual Research. Animals were housed singly and were watered and fed a standard chow diet ad libitum; their average weight was 4.5 kg.
Corneal thickness measurements and corneal confocal microscopy imaging were performed before and 6 weeks after lamellar corneal incisions were made. These procedures were performed on animals under general anesthesia, which was achieved by intramuscular injection of ketamine and xylazine. Anesthesia was maintained using isoflurane gas. Ultrasonic corneal thickness measurements were determined as the average of 10 measurements recorded for each eye using a solid contact ultrasonic probe (DGH-550 Pachette II; DGH Technologies, Inc, Exeter, Pennsylvania, USA). Our methods for determination of corneal thickness from confocal microscopy imaging are described below.
Surgical Procedures and Postoperative Care
A nominal 130-μm corneal flap was cut with a new blade (OASIS Medical, Inc, Glendora, California, USA) in the right eye of each subject using the ACS microkeratome (Bausch & Lomb, Rochester, New York, USA). A nasal hinge position was used to avoid flap displacement by the nictitating membrane. After cutting the flap, a spatula was used to reflect the tissue. The stromal bed was irrigated with sterile saline, and then the flap was repositioned and allowed to adhere to the stromal bed. After surgery, 1 drop of 0.3% ciprofloxacin was applied to the eye, 0.03 mg/kg buprenorphine was given via subcutaneous injection, and animals were fitted with a cervical collar for the first 3 days after corneal incision to prevent them from physically disturbing the corneal lamellar incision, for example, while grooming.
Animals received antibiotic prophylaxis (1 drop of 0.3% ciprofloxacin hydrochloride) ophthalmic solution 4 times daily for 1 week and 1 drop of 1% prednisolone acetate ophthalmic suspension 4 times daily for 1 week to mitigate ocular inflammation. Animals were monitored daily using slit-lamp biomicroscopy for the first week to confirm that there were no visible signs of postoperative inflammation. Animals then were monitored weekly until being examined again using confocal microscopy 6 weeks after the lamellar incision.
Confocal Microscopy Imaging Calibration
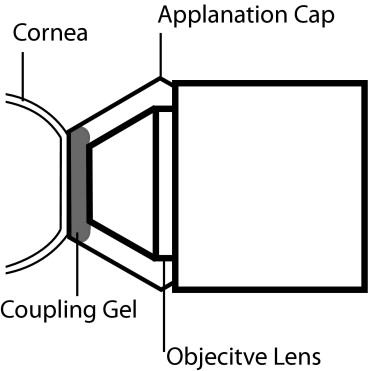
The Rostock Corneal Module comprises a lens system fitted over the existing retinal confocal objective of the Heidelberg Retinal Tomography instrument (Heidelberg Engineering GmbH). This lens system includes an immersion microscope lens objective (Achroplan 63x/0.95, 1.45 mm; Carl Zeiss GmbH, Göttingen, Germany) coupled with an internal exchangeable user-selected field lens that determines the lateral magnification and field of view. The immersion microscope objective lens is coupled optically to a flat disposable polymethyl methacrylate (PMMA; n = 1.491) applanation lens using a viscous ophthalmic coupling solution (GenTeal Gel; Novartis Ophthalmics, East Hanover, New Jersey, USA; n = 1.339). A small amount of this same coupling solution is applied to the outer surface of the PMMA lens, and the lens then is applied to the surface of the cornea ( Figure 2 ) . The reported index of refraction for the PMMA lenses and coupling solution were measured using a calibrated Abbe refractometer (Abbe-3L; Spectronics Instruments, Inc, Thermo Instrument Co, Rochester, New York, USA).
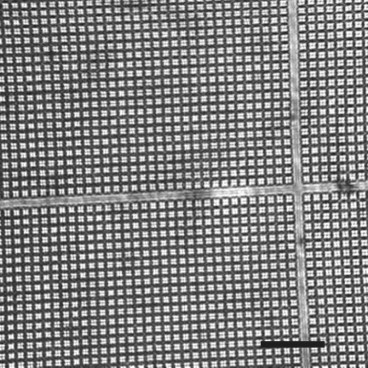
The 2-dimensional images captured with our system had a nominal 400 × 400-μm field of view with a sampling resolution of 1 μm/pixel. We verified the lateral resolution using a calibrated 5 × 5-mm photo-etched silicon wafer (Electron Microscopy Sciences, Hatfield, Pennsylvania, USA; part no. 79502–01). This wafer has etchings that are 1.9 μm wide with 10 μm total separation between each division. This target was aligned to the system, coupled with the viscous gel, and imaged to verify the lateral magnification of our system and to determine the uniformity of illumination across the image field ( Figure 3 ) .
The axial scan position of our confocal microscope was calibrated in a series of measurements similar to those described previously by Ivarsen and associates and McLaren and associates. A series of 10 single-cut PMMA contact lenses (n = 1.491) of uniform thickness were made at our own custom contact lens manufacturing facility. Two lenses for each of 5 different thicknesses were made: 400, 450, 500, 550, and 600 μm. The anterior radius of curvature was specified as 7.75 mm and the posterior radius was 7.80 mm. The curvature of each lens was measured in triplicate using a radioscope and the median value was selected to represent the true value. Thickness was measured using a high-resolution micrometer with certified precision of ± 0.5 μm (MT12; Heidenhain Corp, Schaumburg, Illinois, USA).
To measure these lenses with the confocal microscope, the lenses were mounted on an optical positioning stage with the back surface of the lens filled with saline. The front surface of the lens was centered on the confocal system optics and was positioned axially so that the lens apex was touching the applanation lens. This was confirmed by observing a small circular region of touch and the formation of concentric Airy rings. Once aligned, the confocal microscope objective was advanced until the posterior lens surface was visible, and then the lens position was recorded. As before, the median of 3 measures was selected as the measured lens thickness. Because the microscope does not observe the lens surface directly, but rather the image of the lens surface, we adjusted these measurements for the optical effects of refraction induced by surface curvature of the lens and differences in the index of refraction at each interface to provide a corrected estimate of the lens thickness using methods described by McLaren and associates. These estimates were adjusted further to account for differences between the contact lens and the curvature (7.3 mm ) and index of refraction (n = 1.38) of the rabbit cornea. For the interested reader, this method is described in detail elsewhere. In addition to computational adjustments for the optical effects of the viscous coupling solution used with scanning-slit confocal microscope as described by McLaren and associates, our calibration calculations included additional compensation for the PMMA applanation lens used with this confocal imaging system. Our adjustment methods otherwise conformed to these previously described methods.
The corneal confocal adapter has a total axial depth scanning range of approximately 1500 μm. The depth plane of the scan can be set manually using a rotating lens controller. This controller is linked electronically to a confocal lens position encoder providing a continuous readout of the axial depth plane. The scan lens position is set to 0 before scanning by using the lens controller to advance the objective lens until the outer surface of the lens cap is located, providing a maximally bright specular reflection. The applanation lens surface then is placed against the cornea and the scan position is adjusted to the user’s scan plane of interest. When applanated, the anterior-most corneal surface is fixed relative to the 0 position, and sequential scans therefore are registered in axial depth relative to the original 0 position.
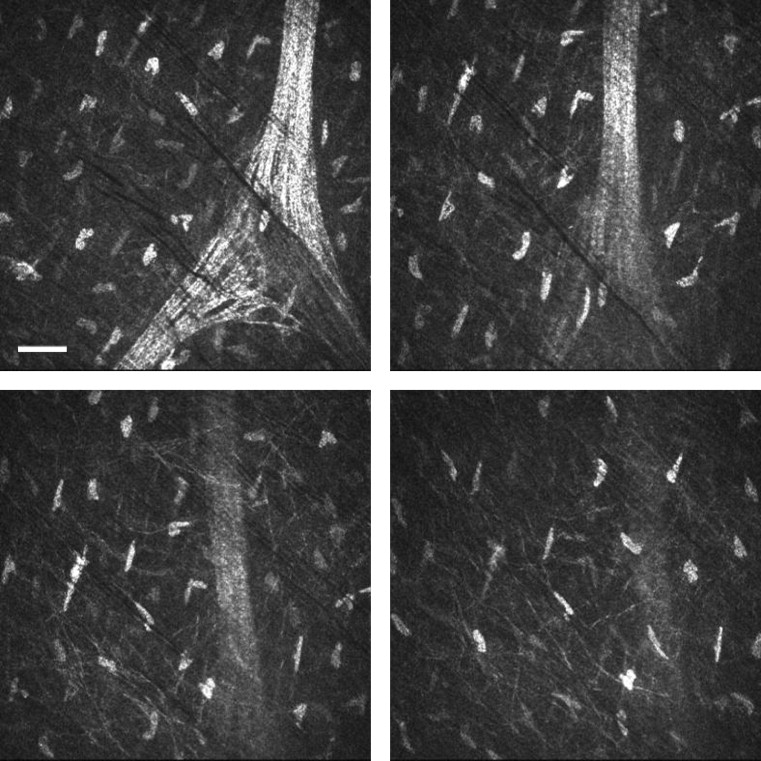
At any fixed position, an internal scanning lens is capable of providing automated depth scanning over a 60-μm depth interval; 30 images are captured over each interval ( Figure 4 ) . The nominal plane of separation between each image therefore was 2 μm . We evaluated the nominal axial resolution of our system in 2 ways. First, this was accomplished by examination of common landmarks (eg, keratocyte nuclei) across sequential tomographic planes with the automatic gain control of this system turned off. Previous studies of normal keratocyte morphologic features have established the average cell thickness as 1.34 μm. Second, we defined axial resolution by the full-width half-maximum height of a Gaussian fit to pixel intensity for an isolated region of interest (eg, keratocyte nucleus) across sequential frames. For each method, the mean depth of field was reported as the average for multiple locations (n = 15; 3 different locations for each of 5 eyes).
In Vivo Imaging
Anesthetized animals were placed on their side and the eyes were directed in a vertical position. The confocal imaging system was aligned to the apex of the cornea, and images of the corneal tissue were captured over the full thickness of the cornea (from the superficial epithelium to the endothelium), as described below. All eyes were measured twice during a single session both before and 6 weeks after a lamellar corneal incision.
We achieved full corneal thickness imaging by performing a sequential series of adjacent automated scans. To accomplish this, the position of the objective lens was set first to 0 on the surface of the PMMA applanation lens. The cornea was contacted with the applanation lens and the capture mode was set to automatic volume: 30 images/60 μm. After the scan sequence was complete, the lens controller was advanced to 60 μm and another scan sequence was captured. This procedure was repeated over the full thickness of the cornea. Every image of each sequence was encoded with the axial depth relative to the initial 0 position. Care was taken to avoid any lateral or axial displacement of the camera position during sequential scans. Corneal thickness was calculated as the difference in axial scan position from the first frame of the anterior-most layer of superficial epithelial cells to the endothelium. A comparison of ultrasonic and confocal corneal thickness measurements are reported in the results.
Keratocyte density was estimated in 5 distinct stromal regions that we defined similar to the methods of Patel and associates. Contiguous volumetric scans were performed in each of the different stromal regions. The anterior-most region, defined as the first countable frame, was located at a depth of 30 to 39 μm. This first countable frame was defined as the first image, deep to the epithelium, where no portion of the frame was obscured by the overlying acellular basement membrane. The anterior stromal region was located at a depth ranging from 40 to 75 μm. The incisional zone was defined as 76 to 150 μm deep. Mid- and deep-stromal zones were between 151 and 250 μm and 251 to 400 μm deep, respectively. Keratocyte density was estimated as the number of nuclei visible within a rectangular subregion of interest for each tomographic section. These regions were defined as the largest area that did not contain obscuring features, for example, postoperative tissue folds. Cells touching either of the 2 adjacent sides of the upper right corner of the subregion were included in counts, and any cells touching the remaining sides were not. Section volume was calculated by multiplying the total section area by the calibrated depth of field. At least 3 individual frames were counted within each stromal region, and the mean cell density was calculated. Differences in keratocyte density by stromal region were compared using a 2-way repeated measure analysis of variance model that included treatment, stromal region, and measurement order as factors.
We analyzed the within-session repeatability of cell density estimation and report the mean residual difference along with the 95% limits of agreement using the methods of Bland and Altman. We defined within-session repeatability as the difference in keratocyte density estimated by a single examiner from 2 different images acquired during the same session. These limits of agreement are reported for each stromal region before and 6 weeks after the lamellar incision.
Results
Calibration
Lateral magnification of our confocal microscopy system using the photo-etched silicon target showed a total horizontal field of 400 × 390 μm that is in agreement with the nominal specifications of 1 μm/pixel. The calibration target image ( Figure 3 ) was 40 divisions wide (400 μm) by 39 divisions high (390 μm). This area was sampled digitally with 384 × 384 pixels, providing a lateral resolution of 1.04 μm/pixel horizontally and 1.01 μm/pixel vertically. The mean deviation in intensity over the entire field for this target was less than 6% of the 8-bit dynamic range of the camera.
Image thicknesses of the PMMA calibration lenses were corrected for changes in index of refraction at each surface (objective lens, coupling solution, PMMA cap, and cornea) and then were compared against measured thickness determined by scanning laser confocal microscopy in Figure 5 . A regression through these calibration points shows that there was good correlation between the image thickness of the contact lenses and thickness measured by the confocal microscope ( R 2 = 0.96). This regression line provides the calibration function needed to adjust confocal microscopy measurements for real thickness ( y = 1.32 x − 145). Thus, the separation of each confocal tomographic plane was 2.6 μm. Mean thickness of the contact lenses when measured with the confocal microscope were, on average, 4.1 ± 22.5 μm thinner than the thickness measured with the micrometer after adjustment for differences in the refractive index of the contact lens and the cornea.
On average, stromal keratocytes were visible over 3.5 sequential frames, where each frame was separated by 2.6 μm ( Figure 4 ). The calculated depth of field by this method was 9.1 μm (95% CI, 7.7 to 10.6 μm). Using a second approach, we fitted a Gaussian function to pixel intensity plotted as a function of axial depth position ( Figure 6 ) . Using the measure of full width at half-maximum height, we calculated the mean depth of field as 7.8 μm (95% confidence interval [CI], 7.1 to 8.6 μm; n = 15; 3 estimates for 5 eyes).
Corneal Thickness
The measured mean and distribution of corneal thickness in this sample by ultrasonic pachymetry was 447 μm; (95% CI, 421 to 473 μm). Corneal thickness by confocal microscopy was 445 μm (95% CI, 418 to 472 μm). Within-session repeatability of corneal thickness measurements was estimated by calculating the intraclass correlation coefficient for ultrasonic pachymetry (intraclass correlation coefficient, 0.92; 95% CI, 0.80 to 1.0) and for confocal microscopy (intraclass correlation coefficient, 0.94; 95% CI, 0.84 to 1.0). The average difference between paired measurements of total corneal thickness (ultrasound − confocal microscopy) on the same eye, during the same measurement session was 2.1 μm (95% CI, −7.0 to 11.2 μm; P = .61). Residual differences of these paired comparisons are plotted in Figure 7 . Six weeks after the incision, the average corneal thickness by confocal microscopy was decreased to 424 μm (95% CI, 393 to 454 μm). This 5% reduction in thickness was not statistically significant ( P = .16).


