Purpose
To characterize the appearance of the far peripheral retina of normal eyes using ultra-widefield fluorescein angiography (UWFA).
Design
Cross-sectional study.
Methods
This study enrolled 101 eyes with best-corrected visual acuity ≥20/20, with refractive error <3.00 diopters, and without visible retinal pathologic changes under a slit lamp–based condensing lens. The far peripheral retina was detected by UWFA. Ciliary body thickness (CBT) at 3 mm (CBT1) and 2 mm (CBT2) posterior to the scleral spur was measured by ultrasound biomicroscopy.
Results
In the far peripheral retina, granular background fluorescence (GB) appeared in all eyes (100%), a mottled fluorescent band (MB) appeared in 44 eyes (43.6%), and retinal vascular leakage (VL) appeared in 20 eyes (19.8%). According to peripheral angiographic findings, the eyes were allocated into 3 groups: Group 1 (MB− and VL−), Group 2 (MB+ and VL−), and Group 3 (MB−/+ and VL+). Ultrasound biomicroscopy showed ciliary body edema and exudates in Group 3. The mean CBT1 (mm) and CBT2 (mm) of Group 3 were greater than those of Group 1 and Group 2 (0.315 ± 0.037 vs 0.240 ± 0.019 vs 0.251 ± 0.030; 0.571 ± 0.084 vs 0.375 ± 0.051 vs 0.410 ± 0.050, P < .001 for both CBT1 and CBT2). The mean CBT1 and CBT2 showed no difference between Group 1 and Group 2 ( P = .575 for CBT1; P = .150 for CBT2).
Conclusions
Normal peripheral retinas generally show granular background fluorescence, with or without a mottled fluorescent band.
Fundus fluorescein angiography (FA) has been used in pathophysiological evaluation of the retina and the choroid for more than 50 years. As the traditional fundus camera for FA can only offer a 30- to 60-degree view field of the fundus in a single shot, the 7–standard field protocol and the 9-field protocol have been developed to increase the view field of FA. However, they are technically challenging for both patients and photographers, and they fail to image the far peripheral retina. The subsequent application of a confocal scanning laser ophthalmoscope with a Staurenghi contact lens expands the viewing capability to a 150-degree view field, while its contact nature makes it less preferable in clinical application. The advent of the noncontact Optos C200 MA ultra-widefield retinal imaging system (Optos PLC, Dunfermline, Scotland, UK) makes it possible to observe the far peripheral retina via FA imaging in a variety of fundus diseases. The Optos system is convenient to operate with extremely widefield visualization, and its newly commercial device has established a built-in stereographic projection software to reduce distortion. More recently, Heidelberg Engineering (Heidelberg, Germany) has developed a noncontact ultra-widefield fluorescein angiography (UWFA) imaging module that captures a 102-degree view field of the fundus in a single image. Although not used as widely as the Optos now, the ultra-widefield imaging lens offers the advantage of easy interchange with other existing lenses. It has been used successfully to inspect infants’ retinas intraoperatively.
In our clinical practice, a mottled fluorescent band is frequently observed near the ora serrata in FA images. Whether this mottled fluorescent band is normal has not been confirmed yet. Only a few articles have been focused on the peripheral retina in normal eyes. One recent study has quantitatively evaluated the area of normal perfused retina in UWFA images. Another study has estimated the normal distance from vascular termini to ora serrata in children’s eyes. These studies have given detailed analysis of the perfusion and nonperfusion status of the peripheral retina, while still leaving other UWFA image features of the normal far peripheral retina undescribed. Therefore, our study aimed to investigate the appearance of the far peripheral retina in normal eyes by using the Heidelberg Spectralis UWFA imaging system. Such a description will provide valuable normative data for understanding pathologies of the far peripheral retina shown by FA images.
Methods
This cross-sectional study was conducted from November 2014 to January 2016 at the fundus outpatient clinic in Zhongshan Ophthalmic Center. The study adhered to the tenets of the Declaration of Helsinki. This study was approved by the Institutional Review Board of Zhongshan Ophthalmic Center, Sun Yat-Sen University (IRB approval number: 2016KYPJ029) and was registered at ClinicalTrials.gov (ID number: NCT02856139 ). Informed consent for the study was obtained from each subject at the time of enrollment.
Subjects
All patients underwent a comprehensive eye examination including slit-lamp biomicroscopy, tonometry, refractive error measurements, and dilated fundus examination with a slit lamp–based +78 diopter (D) or +90 D lens. Both eyes of patients with merely floaters or the fellow eyes of patients with retinal vein occlusion (RVO) or central serous chorioretinopathy (CSC) without any ocular pathologic findings in the above-mentioned preliminary examinations were included in the study. Subjects with a history of ocular surgery, best-corrected visual acuity <1.0 (20/20), refractive error ≥3.00 D, presence of ocular or systemic diseases, or opacity of refractive media that interfered with the peripheral retina image quality were excluded from this study. Eyes were excluded if the quality of their FA images prevented reliable evaluation. The prevalence of symptomatic and asymptomatic floaters are fairly common in the general population and floaters cannot be considered abnormal when lacking other pathologic findings. Therefore, the eyes with floaters but without other pathologic findings in our study were set as “normal eyes” to investigate the appearance of the far peripheral retina. Demographic and clinical data such as age, sex, and reasons for undergoing FA were collected. All fundus examinations including FA were evaluated independently by 2 masked ophthalmologists with respect to the appearance of the far peripheral retina.
Ultra-widefield Fluorescein Angiography Acquisition and Analysis
A protocol was set for FA acquisition. UWFA was performed to obtain images of the far peripheral retina. All patients received an intravenous injection of 5 mL 10% sodium fluorescein through the antecubital vein. All eyes were dilated with tropicamide phenylephrine (Mydrin-P, Santen, Japan) to facilitate the capture of high-quality images. For the UWFA and the 55-degree FA modules, the primary field was centered on the fovea, and images of the peripheral retina were captured by instructing the patient to stare temporally, superotemporally, superiorly, superonasally, nasally, inferonassally, inferiorly, and inferotemporally to the greatest extent possible. For UWFA, images were captured in the early (10–30 seconds), mid (3–5 minutes), and late (10–15 minutes) phases, and at 20–30 minutes when the choroidal and retinal vessels were almost completely drained of fluorescein. For 55-degree FA, images were taken at the mid and late phases.
The characteristics of the angiographic findings were analyzed. The far peripheral retina was defined as the retinal area anterior to the ampullae of the vortex veins and posterior to the ora serrata. A montage was created using images taken at different gaze angles to cover a retinal area as large as possible. The view fields of single shots and montages of both FA modules were calculated and analyzed in pixels using Adobe Photoshop C5 software (Adobe Systems Inc, San Jose, California, USA).
Examination of Ciliary Body
To determine whether the vessels of the far peripheral retina were affected by underlying inflammation, ultrasound biomicroscopy (UBM) was performed using a Suoer panoramic UBM instrument (Model SW-3200L; Suoer Electonic, China). The ciliary body was scanned perpendicularly in 4 meridians at 3 o’clock, 6 o’clock, 9 o’clock, and 12 o’clock when the patients were lying in the supine position under room light. Image description was performed by an ophthalmologist experienced in interpreting UBM images. The ciliary body thickness (CBT) was measured at 3 mm (CBT1) and 2 mm (CBT2) posterior to the scleral spur using the ImageJ program (version 1.49; National Institutes of Health, Washington, DC, USA). The measurements were performed in triplicate. The average of the measurements in 4 meridians was used for statistical comparison.
Statistical Analysis
All data were analyzed using IBM SPSS Statistics version 20.0 (IBM Corp, Armonk, New York, USA). The paired t test was used to compare the differences in fundal view fields obtained using UWFA and 55-degree FA. The χ 2 test was used to compare the distribution of sex among the groups. One-way analysis of variance was used to test the differences of CBT, age, and refractive error among the groups. The Scheffe test was used for pairwise comparison of CBT1 and refractive error across the 3 groups. The Dunnett T3 test was used for pairwise comparison of CBT2 across the 3 groups. A P value less than .05 was considered statistically significant.
Results
During the 15-month study period, 101 eyes of 61 consecutive patients aged 15–65 years (average, 41 years) were enrolled, with a female-to-male ratio of 0.97.
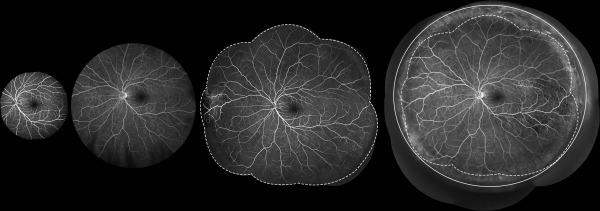
The fundal fields obtained using the Heidelberg ultra-widefield lens in a single shot and in montage images were compared with those acquired using the Heidelberg conventional 55-degree lens ( Figure 1 ). In an exploratory analysis of a subset of the study eyes (n = 10), the area of a single image and montage images captured by the Heidelberg Spectralis ultra-widefield lens vs the conventional 55-degree lens was 461 305 ± 380 vs 142 382 ± 1396 pixels ( P < .001); and 1 068 375 ± 25 606 vs 830 421 ± 17 967 pixels ( P <.001), respectively. A single UWFA image captured 3.24× (range 3.19–3.29×) the area captured by a single 55-degree FA image, and an UWFA montage image captured 1.29× (range 1.21–1.34×) the area captured by a 55-degree montage image.
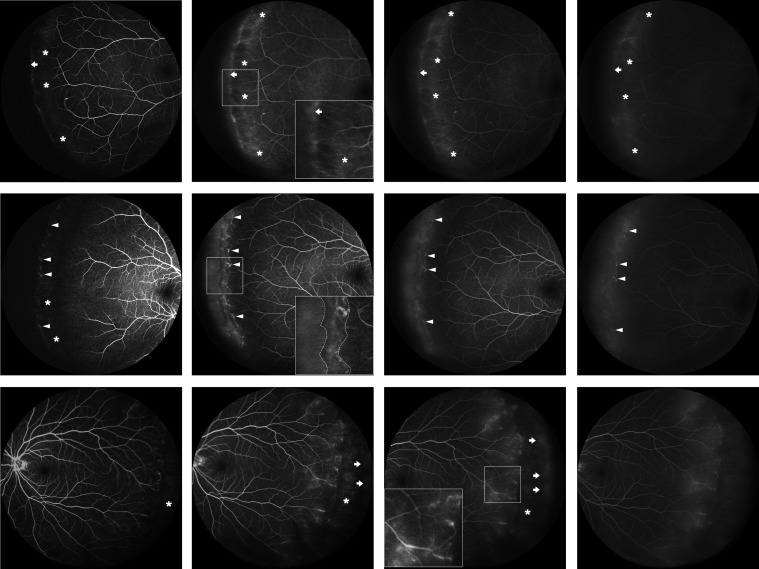
An analysis of the appearance of the far peripheral retina in the UWFA images revealed 3 different signs ( Figure 2 ): a granular background fluorescence, mottled fluorescent band, and vascular leakage. The background fluorescence circling the far peripheral retina was slightly stronger than that of the posterior retina. The granular background fluorescence appeared early in the angiography and increased in intensity, coinciding with dye filling and increasing in the choroid. It showed no leakage in the late phase and faded out as the choroid was emptied of dye at the end of angiography. The mottled fluorescent band, a band with a diameter of 0.5–1 disc and unevenly distributed fluorescence, appeared at the far peripheral retina adjacent to the ora serrata. It consisted of hyperfluorescent and hypofluorescent components, and the hyperfluorescent component was dominant. The hyperfluorescent component appeared early in the angiography, increased in intensity as dye concentration in the choroid increased (window defect), and stained with fluorescein in the late phase and remained uniform in size throughout the angiogram without any leakage. Vascular leakage observed at the far peripheral retina showed fluffy fluorescence in the late phase of UWFA. Signs of the granular background fluorescence, mottled fluorescent band, and vascular leakage can occur simultaneously or separately. Dye leakage on fluorescein angiography are usually considered abnormal, since normal retinal blood vessels are impermeable to dye leakage. Therefore, based on the different combinations of these signs and our knowledge, the studied eyes were divided into 3 groups ( Table 1 ). The eyes with peripheral vascular leakage were grouped separately as Group 3. The eyes free of peripheral vascular leakage but with the mottled fluorescent band were divided into Group 2, and the eyes with only granular background fluorescence were left for Group 1. There were no significant differences among the 3 groups in terms of age, sex, and refractive error ( Table 2 ).
| GB | MB | VL | Number of Eyes (%) | |
|---|---|---|---|---|
| Group 1 | + | − | − | 44 (43.6) |
| Group 2 | + | + | − | 37 (36.6) |
| Group 3 | + | +/− | + | 20 (19.8) |
| Group 1 | Group 2 | Group 3 | P Value | |
|---|---|---|---|---|
| VL− MB− | VL− MB+ | VL+ | ||
| Number of patients (eyes) | 27 (44) | 24 (37) | 10 (20) | – |
| Number of female patients (%) | 12 (44.4) | 13 (54.2) | 5 (50.0) | .785 a |
| Age, y, mean ± SD | 43 ± 15 | 42 ± 14 | 36 ± 15 | .464 b |
| 95% CI | (37, 48) | (36, 48) | (26, 47) | |
| Range | 16–65 | 15–64 | 19–60 | |
| RE, D, mean ± SD | −0.213 ± 1.224 | −0.135 ± 1.100 | −0.800 ± 1.271 | .112 b |
| 95% CI | (−0.585, 0.159) | (−0.502, 0.232) | (−1.395, −0.205) | |
| Range | −2.750 to +2.875 | −2.750 to +1.750 | −2.750 to +1.250 |
Stay updated, free articles. Join our Telegram channel

Full access? Get Clinical Tree


