Purpose
To evaluate age, sex, and ethnic variations in inner and outer retinal and choroidal thickness and foveal pit, using spectral-domain optical coherence tomography (SD OCT).
Design
Single-center observational cross-sectional study.
Methods
Ninety randomly selected, healthy individuals of white, black, and South Asian origin underwent SD OCT raster and enhanced depth imaging scan. Manual measurements of inner and outer retinal thickness and choroidal thickness up to 3 mm nasal and temporal to the fovea were performed. The age, sex, and ethnic differences in these parameters were analyzed.
Results
The mean inner retinal thickness was lower by approximately 12 μm in black subjects across the central retina compared to white subjects ( P < .05). The central foveal thickness below the foveal pit was lower in eyes of blacks compared to South Asians (12 μm, P = .035) and white subjects (18 μm, P < .0001). The fovea was also significantly wider in eyes of black and South Asian subjects compared to white individuals. The inner retinal thickness decreased by 0.5 μm per year of age of subjects and was thinner by 6.1 μm ( P < .02) in female compared to male subjects. The subfoveal choroidal thickness did not vary between ethnic groups but the temporal choroid was significantly thinner in black subjects ( P < .05). The choroid showed an age-related decline in thickness of 2 μm per year of age of the subjects.
Conclusions
Interethnic differences include wider fovea, lower central foveal thickness, and thinner inner retina in eyes of black subjects compared to their white and South Asian counterparts.
Optical coherence tomography (OCT) is a useful, noninvasive imaging tool that aids in quantitative and qualitative assessment of the macula. Recent advances in device and software technology have significantly improved our interpretation of retinal diseases. Spectral-domain OCT (SD OCT) incorporating enhanced depth imaging (EDI) provides high-resolution images with precise delineation of the microstructure of both the retina and choroid.
Previous reports have indicated that total retinal thickness measurements show variations with age, sex, and ethnicity. However, the reasons for these differences remains unclear. In particular, it is not well understood whether the differences in total retinal thickness may be explained by variations in thickness of the inner or outer retinal layers with age, sex, or ethnicity. Secondly, foveal pit morphology varies between ethnic groups and it is unclear as to whether the ethnic variations in retinal thickness in the central subfield can be ascribed to differences in foveal contour. More importantly, inner and outer retinal layers may be independently affected in certain disorders. For instance, inner retinal layer thinning is a reliable indicator for glaucoma and eyes of subjects of black ethnicity seem to be more susceptible to open-angle glaucoma compared to their white counterparts. It is therefore prudent to evaluate the variations of inner and outer retinal thickness with age, sex, and ethnicity. Similarly, there are scanty data on ethnic variations in choroidal thickness despite the fact that some diseases that predominantly affect the choroid, such as polypoidal vasculopathy, are more prevalent in blacks and South Asians. Estimating differences in inner and outer retinal thickness, choroidal thickness, and foveal contour in different ethnic groups will provide more information on the normal variations in thickness of the retina and choroid.
The aim of our study was to compare ethnicity-, age-, and sex-based variations in total, inner, and outer retinal and choroidal thickness and foveal pit morphology and to explore whether these could elucidate some of the differences in the central retinal parameters.
Methods
This observational, cross-sectional study was performed on the control group of a study (Early detection of Diabetic Retinopathy using Colour assessment and diagnosis test) in the Laser and Retinal research unit of King’s College Hospital, London. This was approved by the R&D Department (KCH-11-156) and the Ethics Committee of King’s College Hospital (Ethics number 11/NW/0753) and adhered to the tenets of the Declaration of Helsinki. Informed consent was obtained from the participants in the original study. This was a post hoc analysis of the data collected in the original study.
Individuals
Normal healthy volunteers belonging to 3 ethnic groups were randomly selected and invited to participate in the original study. This is a post hoc analysis of the data collected from patients with good-quality OCT scans. The individuals were categorized as whites of European descent; blacks, including Africans and Afro-Caribbeans; and South Asians originating from the Indian subcontinent (people from India, Pakistan, Sri Lanka, Nepal, and Bangladesh), based on self-declaration. The individuals in each ethnic group were age and sex matched for this post hoc analysis. Exclusion criteria included individuals of mixed races, those with refractive error more than + or −1 diopter, history of any ocular pathology, or any systemic diseases such as diabetes mellitus, hypertension, and the like.
Optical Coherence Tomography Protocol
Following visual acuity assessment using the Snellen chart, all individuals underwent undilated macular SD OCT scans in both eyes. These were performed on Spectralis (HRA+OCT; Heidelberg Engineering, Heidelberg, Germany). It combines high-resolution SD OCT with a scanning laser ophthalmoscope. The posterior pole volume scan was performed on a 30 × 25-degree cuboid, with 61 raster lines, separated by 121 μm. Twenty-four image frames were captured and averaged to provide an image quality score of >20 dB for the averaged scan. Choroidal imaging was performed as a single horizontal line scan, 7.2 mm long, passing directly through the center of the fovea, using the EDI protocol available on the Heidelberg machine. This image is automatically averaged for 100 scans and also uses the eye-tracking mode on the machine. The scans were repeated, if necessary, to obtain images of good quality.
Scan Quality
Only scans with good signal strength (signal-to-noise ratio, >20 dB or greater) were evaluated. All scans were centered at the fovea to avoid any errors in the thickness measurements due to slight differences in positioning. If deemed necessary, the Early Treatment Diabetic Retinopathy Study (ETDRS) grid was shifted to compensate for any fixation errors. Two independent observers examined and adjusted the images obtained from each subject for any obvious segmentation errors. In addition, the images were considered acceptable only if the full extent and depth of the retina was clearly distinguishable, and there were no blinking artifacts or eye movements during image acquisition. Likewise, only EDI scans with good definition of the choroidoscleral junction were included for evaluation.
Total Retinal Thickness and Macular Volume
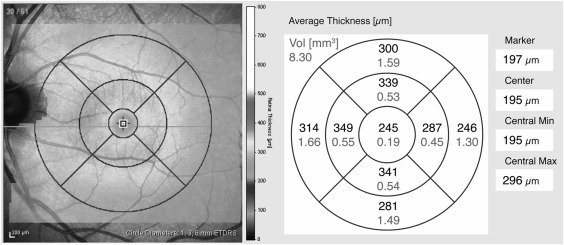
The macular thickness protocol constructs a false-color topographic image displayed with numeric averages of total thickness and macular volume measurements for each of the 9 ETDRS zones within a 6 × 6-mm area centered on the fovea. According to the ETDRS map, the macula is divided into 9 regions with 3 concentric rings measuring 1 mm (innermost ring), 3 mm (inner ring), and 6 mm in diameter (outer ring) centered on the fovea. The innermost 1 mm ring is the fovea (central subfield) while the 3 mm inner ring and 6 mm outer ring are further divided into 4 equal regions ( Figure 1 ). The software identifies the layers of the retina and determines retinal thickness by measuring the distance between the inner limiting membrane (ILM) and the inner boundary of the retinal pigment epithelium (RPE) in the raster scan lines.
Inner and Outer Retinal Thickness Measurement
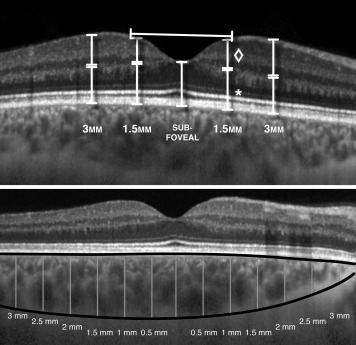
The thickness of the inner and outer retina was measured manually at 1.5 and 3 mm nasally and temporally from the center of the fovea along a single horizontal line scan passing directly through the center of the fovea. Inner retina was measured from the ILM to the junction of the inner nuclear layer (INL) and the outer plexiform layer (OPL). An experienced grader (R.B.) zoomed out the scans to identify the junction between the hyporeflective INL and the hyperreflective OPL and marked the junction before zooming in to ensure the marking is correctly aligned to the junction. Outer retinal thickness was measured from the INL/OPL junction to the outer border of the RPE layer ( Figure 2 ).
Diameter and Depth of the Fovea
Foveal diameter is the lateral rim-to-rim distance defined as the point where the slope of the foveal lateral edge intersects with the slope of the horizontal surface of the retina. The depth of the fovea was measured from the deepest part of the foveal pit to the midpoint of the axial line connecting the rims ( Figure 2 ). The central foveal thickness was measured from the deepest point of the pit to the outer border of the RPE layer.
Choroidal Thickness
The segmentation line overlying the ILM was manually moved down to the choroidoscleral junction by the graders. The choroidal thickness was measured from the segmentation line on the RPE to the aforementioned line in the subfoveal area, and at every 0.5 mm eccentric to the center up to 3 mm, nasally and temporally ( Figure 2 ).
Intergrader and Intragrader Reliability
Intergrader reliability on the inner and outer retinal thickness, foveal diameter, and choroidal thickness measurements was also calculated on 15 random eyes in all ethnic groups by 2 independent graders (R.B. and E.P.). Intragrader reliability was calculated on 15 random eyes by a single grader (M.R.).
Reproducibility
The intersession reproducibility of the inner and outer retinal thickness, foveal diameter, and central foveal thickness was assessed between images taken using the same protocol in 2 different sessions in the last 12 months. The intrasession reproducibility of 10 eyes was done by repeating the retinal scans 3 times in the same session.
Statistical Analysis
Analyses were conducted using MedCalc (software version 12.3.0.0 [MedCalc bvba, Mariakerke, Belgium]). Only the right eyes were chosen for the analysis. All studied measurements had a normal distribution as demonstrated by the Pearson measure of kurtosis test. The retinal thickness measurements in the 9 subfields of the ETDRS circle, inner and outer retinal thickness, diameter and depth of the fovea, central foveal thickness, and the choroidal thickness measurements in the subfoveal area and each 0.5-mm point nasal and temporal to the fovea (6 points each nasally and temporally) were compared between the ethnic groups by paired t tests. The total, inner, and outer retinal and choroidal thickness were stratified by sex and compared by paired t tests. Linear regression was performed on the inner and outer retinal and choroidal thickness measurements with age. Intergrader reliability for the choroidal thickness, inner and outer retinal thickness, diameter, and depth of the fovea was calculated on15 random eyes in all the ethnic groups by 2 independent graders (R.B. and E.P.) and intragrader (M.R.) by k-measurements. Interocular symmetry of all the thickness measurements was assessed by linear regression. Intersession reproducibility was calculated by paired t tests and intrasession reproducibility by coefficient of repeatability (CR) with 95% confidence intervals calculated in μm thickness and % based on previous studies. Statistical significance was set at P < .05 for all analyses.
Results
Demography
The study included 90 individuals (30 individuals from each ethnic group). All individuals had normal visual acuity (6/6 Snellen). A total of 123 individuals were scanned to obtain good-definition EDI scans and choroidoscleral interface. Ten scans were excluded owing to poor EDI scan quality and 22 were excluded owing to poor delineation of choroidoscleral junction on the scans. These also included the scans of 2 white individuals aged 52 and 55 years. The mean age ± standard deviation was 35 ± 15 years in the 3 ethnic groups (35.5 ± 12 in whites, 35 ± 16 in blacks, and 35 ± 15 in South Asians). All groups were sex matched (male: female =16:14).
Total Retinal Thickness
The macular thickness pattern across the 9 ETDRS zones showed a similar pattern in all the ethnic groups. In the outer ring of 4 ETDRS zones, retinal thickness was highest in the nasal subfield, followed by the superior and inferior subfields, which were very similar in thickness, and the temporal subfield, which was the thinnest. All the 4 ETDRS zones in the inner ring were of similar thickness. Although this pattern of thickness across the 6-mm retina was similar between ethnic groups, there were significant interethnic differences in the degree of thickness. Figure 3 shows the mean total retinal thickness in the 9 zones in the 3 ethnic groups. The total retinal thickness was significantly lower in eyes of black subjects in all subfields compared to white subjects, while the eyes of South Asian subjects showed significantly lower measurements only in the inner 5 zones compared to their white counterparts. The eyes of South Asian and black subjects did not differ significantly in total retinal thickness except that the eyes of black subjects had a lower central subfield thickness. Table 1 shows the mean difference in thickness in each ETDRS zone between ethnic groups.
| White–Black Mean Difference ± SD (mm) | P Value | White–South Asian Mean Difference ± SD (mm) | P Value | South Asian–Black Mean Difference ± SD (mm) | P Value | |
|---|---|---|---|---|---|---|
| CRT | 16.23 ± 7.7 | <.0001 | 5.9 ± 8.6 | .176 | 8.7 ± 8 | .035 |
| CSF | 27.5 ± 9.9 | <.0001 | 14.3 ± 10.2 | .002 | 12.8 ± 11 | .023 |
| NIS | 18.1 ± 7.8 | <.0001 | 9.1 ± 8.5 | .02 | 8.8 ± 8.8 | .05 |
| NOS | 12 ± 8.9 | .009 | 3.3 ± 9.4 | .473 | 8.4 ± 8.7 | .057 |
| TIS | 13.7 ± 7 | .0002 | 9.1 ± 7.5 | .02 | 4.3 ± 7.8 | .274 |
| TOS | 9.9 ± 6.8 | .005 | 5.4 ± 7.3 | .148 | 3.3 ± 7.4 | .251 |
| SIS | 14.9 ± 7.4 | .0001 | 7.6 ± 7.6 | .047 | 6.6 ± 7.8 | .096 |
| SOS | 8.7 ± 7.7 | .027 | 4.3 ± 7.8 | .23 | 3 ± 7.1 | .404 |
| IIS | 17.1 ± 7.7 | <.0001 | 9 ± 7.9 | .029 | 7.4 ± 8.3 | .08 |
| IOS | 14.2 ± 7.4 | .0003 | 6.2 ± 7.8 | .114 | 6.9 ± 7.7 | .078 |
| MV | 0.351 ± 0.38 | .0004 | 0.18 ± 0.19 | .06 | 0.16 ± 0.2 | .11 |
The total retina was significantly thinner in all zones in women compared to men, with a mean difference of 15.7 μm in the central subfield ( Table 2 ). The difference across the 9 zones ranged between 6.6 μm and 15.7 μm. The retinal thickness decreased with age in the 3-mm and 6-mm circles by 0.5–0.76 μm per year when the entire cohort was compared ( Table 3 ).
| Male Mean Thickness ± SD (μm) | Female Mean Thickness ± SD (μm) | Male–Female Mean Difference ± SD (μm) | P Value | |
|---|---|---|---|---|
| CRT | 228 ± 16 | 220 ± 16.5 | 8.5 ± 6.8 | .019 |
| CSF | 276 ± 21.1 | 260 ± 21.7 | 15.7 ± 9.2 | .00079 |
| NIS | 351 ± 18.1 | 338 ± 15.3 | 13.8 ± 7.2 | .0003 |
| NOS | 318 ± 19.6 | 310 ± 16 | 8.6 ± 7.4 | .038 |
| TIS | 337 ± 16.1 | 325 ± 12.6 | 12.8 ± 6.1 | .0001 |
| TOS | 290 ± 14.4 | 280 ± 13.1 | 9.9 ± 5.8 | .0014 |
| SIS | 349 ± 16.7 | 338 ± 13.4 | 11.2 ± 6.3 | .0013 |
| SOS | 301 ± 14.7 | 293 ± 14.7 | 6.6 ± 6.4 | .04 |
| IIS | 347 ± 17.5 | 336 ± 14.5 | 12.3 ± 6.7 | .0007 |
| IOS | 292 ± 16.3 | 284 ± 14.4 | 6.6 ± 6.5 | .04 |
| Foveal diameter | 2162 ± 103 | 2217 ± 124 | 89.5 ± 120.1 | .139 |
| Inner nasal 1.5 mm | 187 ± 11 | 179 ± 11 | 7.7 ± 4.7 | .0019 |
| Outer nasal 1.5 mm | 167 ± 11 | 163 ± 110 | 4.7 ± 4.9 | .079 |
| Inner nasal 3 mm | 166 ± 15 | 161 ± 15 | 5.2 ± 6.7 | .046 |
| Outer nasal 3 mm | 136 ± 12 | 134 ± 10 | 2.2 ± 4.7 | .39 |
| Inner temporal 1.5 mm | 161 ± 9 | 155 ± 10 | 6.4 ± 4.6 | .043 |
| Outer temporal 1.5 mm | 157 ± 12 | 155 ± 9 | 2.4 ± 4.4 | .108 |
| Inner temporal 3 mm | 116 ± 11 | 110 ± 8 | 5.1 ± 4.1 | .02 |
| Outer temporal 3 mm | 138 ± 8 | 135 ± 8 | 3.3 ± 3.7 | .1002 |
| Mean Retinal Thickness ± SD (mm) | Decrease Thickness per Year of Age (mm) | R | P Value | |
|---|---|---|---|---|
| CRT | 212.9 ± 12.9 | 0.28 | 0.155 | .142 |
| CSF | 265.5 ± 14.6 | 0.019 | 0.007 | .942 |
| NIS | 367.7 ± 16.7 | −0.66 | 0.338 | .001 |
| NOS | 342.7 ± 15.4 | −0.8 | 0.406 | .0006 |
| TIS | 349.9 ± 11.9 | −0.55 | 0.325 | .0016 |
| TOS | 306.7 ± 12.6 | −0.61 | 0.386 | .00016 |
| SIS | 367.1 ± 16.3 | −0.66 | 0.384 | .00017 |
| SOS | 320.3 ± 14.2 | −0.612 | 0.365 | .0003 |
| IIS | 366.1 ± 13.4 | −0.71 | 0.383 | .0001 |
| IOS | 315 ± 16.1 | −0.76 | 0.447 | .00001 |
Inner and Outer Retinal Thickness
In black subjects, the inner retina was significantly thinner by approximately 12 μm at 1.5 and 3 mm nasal and temporal to the fovea compared to the white subjects ( Table 4 ), whereas the eyes of South Asians showed significantly thinner inner retina only at the 3 mm distance nasal (5 μm) and temporal (7 μm) from the fovea. There was no significant difference in thickness in inner retina between eyes of South Asian and black subjects. The outer retina showed similar thickness measurements in all 3 ethnic groups.
| Black | White | P Value | South Asian | White | P Value | Black | South Asian | P Value | |
|---|---|---|---|---|---|---|---|---|---|
| Foveal parameters | |||||||||
| Diameter of foveal pit (μm) | 2305 ± 261 | 2068 ± 244 | .0006 | 2213 ± 310 | 2068 ± 244 | .048 | 2305 ± 261 | 2213 ± 310 | .22 |
| Depth of foveal pit (μm) | 138 ± 19.4 | 128 ± 18.9 | .069 | 131 ± 24.1 | 128 ± 18.9 | .64 | 138 ± 19.4 | 131 ± 24.1 | .25 |
| Central foveal thickness (μm) | 206 ± 14.7 | 224 ± 17 | .0001 | 218 ± 16.9 | 224 ± 17 | .13 | 206 ± 14.7 | 218 ± 16.9 | .0073 |
| Inner retinal thickness | |||||||||
| Inner nasal 1.5 mm (μm) | 179 ± 12.9 | 187 ± 10.7 | .0096 | 182 ± 10.3 | 187 ± 10.7 | .076 | 179 ± 12.9 | 182 ± 10.3 | .28 |
| Inner nasal 3.0 mm (μm) | 158 ± 17.2 | 169 ± 13.5 | .0074 | 161 ± 14.5 | 169 ± 13.5 | .023 | 158 ± 17.2 | 161 ± 14.5 | .53 |
| Inner temporal 1.5 mm (μm) | 158 ± 10.4 | 168 ± 9.91 | .001 | 156 ± 12.0 | 168 ± 9.91 | .12 | 158 ± 10.4 | 156 ± 12.0 | .48 |
| Inner temporal 3.0 mm (μm) | 109 ± 9.09 | 117 ± 8.84 | .0001 | 112 ± 10.4 | 117 ± 8.84 | .030 | 109 ± 9.09 | 112 ± 10.4 | .33 |
| Outer retinal thickness | |||||||||
| Outer nasal 1.5 mm (μm) | 162 ± 10.3 | 166 ± 13.1 | .20 | 167 ± 11.6 | 166 ± 13.1 | .70 | 162 ± 10.3 | 167 ± 11.6 | .072 |
| Outer nasal 3.0 mm (μm) | 135 ± 10.2 | 136 ± 12.7 | .79 | 138 ± 11.4 | 136 ± 12.7 | .43 | 135 ± 10.2 | 138 ± 11.4 | .25 |
| Outer temporal 1.5 mm (μm) | 156 ± 11.7 | 161 ± 11.5 | .13 | 158 ± 8.97 | 161 ± 11.5 | .29 | 156 ± 11.7 | 158 ± 8.97 | .51 |
| Outer temporal 3.0 mm (μm) | 136 ± 9.27 | 141 ± 10.4 | .066 | 139 ± 8.49 | 141 ± 10.4 | .44 | 136 ± 9.27 | 139 ± 8.49 | .22 |
The inner retina was thinner by approximately 6 μm in women compared to men ( Table 2 ). No significant sex differences in outer retinal thickness were observed. The inner retinal thickness declined by 0.2–0.5 μm per year, 3 mm temporal to the fovea when the entire cohort was compared based on age. No changes with age were noted in outer retina in the central subfield (data not shown).
Foveal Contour
The fovea was significantly wider in eyes of black and South Asian subjects compared to eyes in white individuals ( Table 4 ). Although the foveal pit was deeper in black subjects compared to South Asian and white subjects, the differences were not statistically significant. However, the central foveal thickness below the foveal pit was thinner in eyes of black subjects compared to white (18 μm, P = .0001) and South Asian (12 μm, P = .0073) subjects. The width and depth of the fovea did not show any age- or sex-related differences.
Choroidal Thickness
The subfoveal choroidal thickness did not vary between ethnic groups ( Table 5 ). However, the temporal choroid was found to be significantly thinner in eyes of blacks compared to whites and South Asians. ( Table 5 , Figure 4 ). The choroidal thickness declined by 1.3–2.39 μm per year in the age-wise comparison for the entire cohort, with no significant differences between sexes (data not shown).


