Clinical Epidemiology of Glaucoma
Glaucoma affects more than 67 million persons worldwide, of whom about 10%, or 6.6 million, are estimated to be blind (1). Glaucoma is the leading cause of irreversible blindness worldwide and is second only to cataracts as the most common cause of blindness overall (1). Glaucoma is responsible for 14% of all blindness (2). In the United States, chronic open-angle glaucoma (COAG) affects more than 2.2 million persons, and this number is projected to increase to 3.4 million by 2020 (3). Over the same time period in the developing world, the prevalence of glaucoma is expected to rise even more dramatically as the population of adults older than 60 years more than doubles (2).
The social and economic impact of glaucoma is enormous but difficult to quantify. Economic data on the cost of glaucoma are also limited. The total direct cost per case of treating newly diagnosed COAG or ocular hypertension for 2 years was estimated to average $2109 in the United States and $2160 in Sweden in 1998 (4). Costs have been shown to be greater for more advanced cases and uncontrolled disease and to increase following trabeculectomy (5,6). The annual direct costs of glaucoma and ocular hypertension in the United States were estimated at $3.9 billion in 2001 (7); a separate estimate from 1991 put the direct costs of glaucoma (excluding ocular hypertension) at $1.9 billion (8). National per capita estimates are similar for Canada but lower for Sweden and the United Kingdom (5,9,10).
FUNCTIONAL LIMITATIONS ASSOCIATED WITH GLAUCOMATOUS VISION LOSS
From the perspective of those whose visual function has been severely affected by glaucoma, the impact of the disease can be profound and may include difficulty with reading and writing, activities of daily living (cooking and eating, dressing and bathing, medication management, money management), mobility with increased risk of falls, ability to drive, vocational challenges, social isolation, and depression (11–16). As individuals age, the impact of visual dysfunction can be amplified if comorbidities are present. These include hearing loss, arthritis, head tremors, and cognitive impairment. The impact of glaucoma can be quantified by using various vision-targeted and generic health-related quality-of-life measures, but is difficult to predict on the basis of visual function measurements alone. Many factors such as physical health, psychological state, visual demands of daily living, values, adaptability, and social and cultural milieu shape the changing impact of glaucoma on individuals (17). This may explain in part the low correlation between visual field loss in glaucoma and vision-targeted and generic measurements of health-related quality of life (18,19). Vision-targeted measures of health-related quality of life have found lower scores in glaucoma suspects than in healthy controls and have been successively lower in those with early and moderate and advanced visual field changes (20–24); general health-related quality-of-life scores also have been shown to be decreased in persons with glaucoma (20–22,25). In general, these findings support the notion that glaucoma, as the “sneak thief” of vision, causes subtle symptoms and modestly affects health-related quality of life until the disease is advanced. Interestingly, visual changes associated with glaucoma are often not interpreted as symptoms of a visual problem until after a diagnosis has been made (17). An important consideration in the treatment of glaucoma is that therapy can itself adversely affect quality of life (26,27). Therapies may be inconvenient or expensive, cause discomfort, or lead to significant ocular and systemic complications.
It has been suggested that strategies aimed at improving an individual’s function be tied to socially meaningful outcomes (28). Examples include maintaining functional independence; sustaining meaningful relationships; enhancing one’s psychosocial well-being; and being able to access transportation, pursue leisurely activities, and maintain employment and economic productivity.
PREVALENCE, INCIDENCE, AND GEOGRAPHIC DISTRIBUTION OF GLAUCOMA
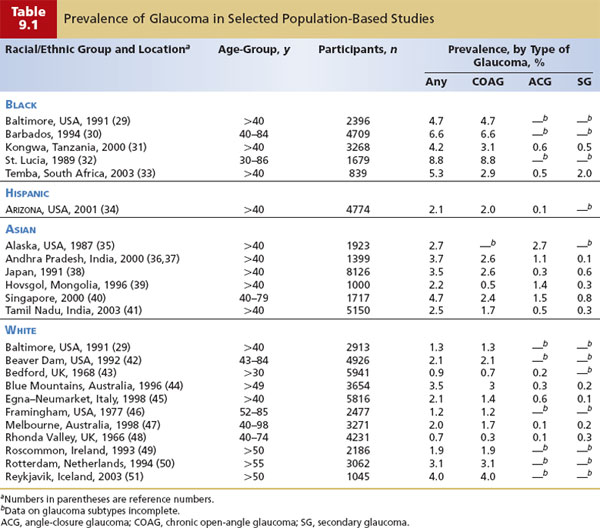
The prevalence of glaucoma has been studied extensively (Table 9.1), but the case definition of glaucoma has varied widely and clinical classification has been inconsistent among studies (52). Intraocular pressure (IOP), the appearance of the optic nerve head, and visual field abnormalities have all been used in varying combinations to define glaucoma; the status of the iridocorneal angle and the presence or absence of secondary causes are typically used to determine the clinical classification of glaucoma. These differences make it difficult to directly compare the prevalence findings of different studies. There is, however, growing acceptance of the concept that glaucoma is a progressive optic neuropathy characterized by a typical damage to the optic nerve head (cupping) and associated visual dysfunction. Glaucomatous damage to the optic nerve appears to be the final common pathway to a diverse assortment of etiologic factors and clinical subtypes.
There is some discussion in the literature about the value of distinguishing between normal-tension glaucoma and COAG on the basis of IOP at presentation. In population-based studies, normal-tension glaucoma has been far more common than expected, accounting for between 40% and 75% of individuals with newly diagnosed COAG based on screening IOP (44,50,53). These entities are likely part of a spectrum of disease in which IOP plays an important role, and other factors such as vascular, apoptotic, or connective tissue factors are increasingly important at lower IOP levels (54); they less likely represent distinct varieties of glaucoma.
The prevalence of open-angle glaucoma varies greatly among racial and ethnic groups (Table 9.1). In the Baltimore Eye Survey, the prevalence of COAG in persons 40 years and older was found to be significantly higher among blacks than whites (4.7% vs. 1.3%). Hispanics in the United States have been found to have a prevalence of 2.0% for those 40 years of age and older, similar to findings of other studies for whites in the same age range. The prevalence of COAG in Asian populations varies widely, with many populations having similar prevalence levels to whites (Chinese in Singapore, 2.4%; Japanese, 2.6%; Indians in Tamil Nadu, 1.7%), whereas other populations (Mongolian, 0.5%; Alaskan Inuit, 0.1%) appear to have rates that are considerably lower. This summary is limited by differences in definitions and classifications of glaucoma and different age distributions. However, the variation in the prevalence of COAG in blacks and angle-closure glaucoma and COAG in Asians probably also reflects the wide genetic heterogeneity within these broad racial and ethnic categories (55).
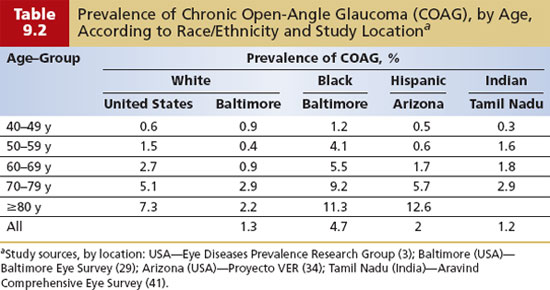
Age has an even more powerful influence on the prevalence of COAG than racial and ethnic grouping does (Fig. 9.1 and Table 9.2). The age-specific prevalence of COAG (by race) is a useful starting point for clinicians to estimate the probability of COAG when beginning an initial assessment. COAG is uncommon before 40 years of age. In a pooled analysis of population-based surveys, the prevalence of COAG in whites increased from 0.6% for age 40 to 49 years to 1.5% for 50 to 59 years, to 2.7% for 60 to 69 years, to 5.1% for 70 to 79 years, and finally to 7.3% in the 80 years and older age-group, a greater than 10-fold increase from the 40- to 49-year age-group (Table 9.2) (3). In the Baltimore Eye Survey, the prevalence of COAG among blacks in the same survey was threefold to fourfold higher than in whites at almost every age interval (Table 9.2). In U.S. Hispanics, the age-specific prevalence of COAG was similar to that of whites but was significantly higher in the oldest age-group, equaling or exceeding the prevalence observed in blacks. Similar to overall prevalence, the age-specific prevalence of COAG in some Asian populations (in Tamil Nadu, India; Chinese in Singapore) is similar to that in whites, whereas in others (in Mongolia), it appears to be considerably lower. In almost all of these studies, roughly a 10-fold increase in prevalence occurs between the 40- to 49-year-old age-group and the oldest age bracket.
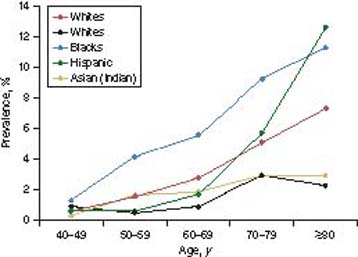
Figure 9.1 Age-specific prevalence of COAG from selected surveys. Data are from the Eye Diseases Prevalence Research Group, Aravind Comprehensive Eye Survey, Baltimore Eye Survey, and Proyecto VER.
Another useful clinical perspective on the geographic distribution of glaucoma is the relative frequency of COAG, angle-closure glaucoma, and secondary glaucoma in different populations. In black and white populations, COAG usually accounts for 85% to 90% of all glaucomas. In contrast, angle-closure glaucoma predominates in some Asian populations, such as in Mongolia, where it accounts for 64% of glaucoma cases. Angle-closure glaucoma has been estimated to account for half of all cases of glaucoma worldwide (1). In other Asian populations, angle-closure glaucoma is less common than COAG, such as in a Chinese population in Singapore (angle-closure glaucoma, 32%; COAG, 42%) and an Indian population in Tamil Nadu (angle-closure glaucoma, 19%; COAG, 65%), whereas among Japanese patients, angle-closure glaucoma accounts for 9% of glaucoma, similar to rates in whites. It is easy to see how profoundly geographic location and the population being treated may affect an ophthalmologist’s perspective on glaucoma. Secondary forms of glaucoma collectively account for between 5% and 20% of glaucoma cases in studies where this is specified (Table 9.1).
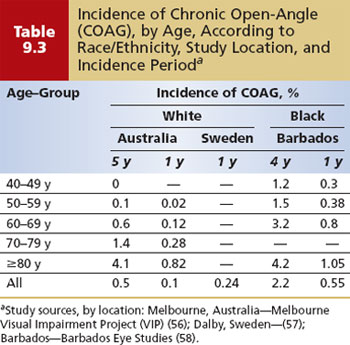
Whereas the prevalence of glaucoma is the proportion of a population with the disease at a given time point, incidence is the rate at which new cases occur during a specified period. The incidence of glaucoma is also strongly influenced by age and race. For the clinician, incidence serves as a point of reference to estimate the risk for glaucoma over a period of time (Table 9.3). The best estimates of the incidence of glaucoma come from a handful of population-based cohort studies (56–58). In the Melbourne Visual Impairment Project, the overall incidence of open-angle glaucoma in whites aged 40 years and older was 0.5% over 5 years, or roughly 1/1000 per year; in blacks of the same age in the Barbados Eye Study, the incidence was 2.2% over 4 years, or about 5.5/1000 per year. In both populations, the incidence increased steadily with age (Table 9.3). This comparison also suggests that the incidence of COAG in blacks increases at an earlier age than in whites and is much greater than in whites in the fourth and fifth decades of life, but is similar in the oldest age-group (80 years or older). However, differences in how progression was determined in these studies mean that direct comparisons may not be valid (59,60).
Several clinical trials have reported the risk of progression of established COAG without treatment. These estimates offer a benchmark to clinicians and patients against which to weigh the risks of treatment, bearing in mind that progression rates may vary widely depending on how progression is determined (59,60). In the Early Manifest Glaucoma Trial (EMGT), the rate of progression at 6 years was 62% without treatment and was decreased to 45%, with an average IOP lowering of 25%, with treatment (61,62). The Collaborative Normal Tension Glaucoma Study (CNTGS) followed a group with more advanced glaucoma and lower IOPs and observed progression in 60% at 5 years without treatment (63). This percentage fell to 20% with treatment targeting greater than 30% IOP lowering.
NATURAL HISTORY OF GLAUCOMA
The natural history of COAG can be divided into three phases of chronic disease to illustrate several important concepts relevant to clinical care (Fig. 9.2).
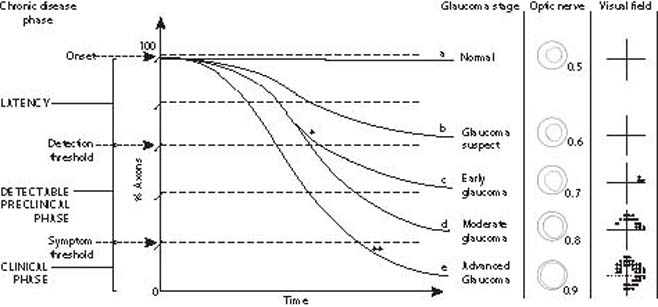
Figure 9.2 Natural history of COAG. Schematic depiction of the natural history of COAG showing loss of axons over time for selected patients with glaucoma. a: An individual without glaucoma. b: Subthreshold axonal loss from glaucoma that does not progress beyond the suspect category. c: Axonal loss from glaucoma that responds to treatment (*) compared with d, glaucoma that remains untreated because of a delay in diagnosis. e: Aggressive axonal loss from glaucoma that is detected only after the onset of symptoms and progresses to blindness despite treatment (**). The phases of chronic disease and clinical stages of glaucoma with fields and disc findings have been added to the graph along the left and right margins. The optic nerve drawings depict typical neural rim changes of glaucoma in a patient with a baseline cup-to-disc ratio of 0.5 before axonal loss; patients with a larger or smaller cup-to-disc ratio at baseline would have different neural rim findings at intermediate stages but would converge in advanced disease.
The first of these phases is called the latency phase. It begins with the onset of glaucomatous optic nerve damage and extends up to the detection threshold. The etiology of glaucomatous optic nerve damage is not well understood but is thought to result from a disturbance in the delicate balance of vascular, connective tissue, mechanical, and neural components that keep the optic nerve head healthy and functioning. An imbalance such as a rise in IOP and increased pressure gradient across the optic nerve head may, in some individuals, be intolerable to some axons and lead to cell death by apoptosis (64). However, many individuals with elevated IOP do not have glaucoma, and many persons with glaucoma have non elevated IOP (53). Clearly, other factors are also involved in glaucomatous optic nerve damage, and evidence continues to build in support of vascular tissue, connective tissue, and neural causes, including variations in cerebrospinal fluid (CSF) pressure (see Chapter 4). It appears that low-level axonal loss may occur with aging in healthy individuals (65–68), but it is unclear how this relates to glaucomatous optic nerve damage.
The detection threshold for glaucoma is defined as the point at which glaucomatous optic nerve damage can be accurately detected by diagnostic testing. This marks the beginning of the lengthy asymptomatic phase during which glaucoma is detectable, the so-called detectable preclinical phase that continues until glaucomatous optic nerve damage leads to symptoms. The detection of early glaucomatous optic nerve damage is challenging. In terms of visual field testing, considerable glaucomatous optic nerve damage can occur before the threshold of detection is reached. It has been reported that up to 40% of axons can be lost before white-on-white Humphrey perimetry will show an abnormality (69,70), a finding supported by subsequent experimental studies in monkeys (71) (Fig. 9.3). Tests such as the frequency doubling technology and short-wavelength automated perimetry (SWAP) may be able to detect glaucomatous optic nerve damage before conventional white-on-white perimetry can, but they may have similar inherent psychophysical limitations. The detection of early glaucomatous optic nerve damage by optic nerve examination at a single visit is also difficult, but for different reasons, there is a large overlap between the appearance of healthy and glaucomatous optic nerves. Nerve fiber layer imaging techniques are helpful in distinguishing some normal variants from glaucomatous optic nerve damage. Careful documentation of optic nerve appearance, preferably by using stereoscopic disc photography or another form of imaging, permits earlier diagnosis and earlier detection of progression by allowing detection of subtle changes from glaucomatous optic nerve damage on subsequent assessments that would otherwise be missed (see Chapter 4).
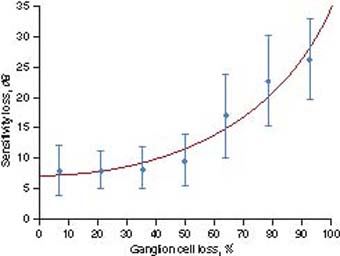
Figure 9.3 Loss of visual sensitivity as a function of loss of ganglion cells caused by experimental glaucoma in macaque monkeys, compared with the contralateral control eye. Mean values (± standard deviation [bars]) are shown for each of seven levels of ganglion cell loss with a fitted curve. Visual field defects greater than 15 dB are almost always caused by ganglion cell losses of more than 70% (71).
Finally, the clinical phase begins with the onset of symptoms; in COAG, this seldom occurs before the disease is advanced. However, chronic glaucoma is generally slowly progressive and may never reach this stage or may take decades to do so. As a result of the lengthy asymptomatic phase, glaucoma is often diagnosed in the course of periodic eye examinations before the clinical phase, but many cases are not. COAG may also behave aggressively and become symptomatic within several years of presumed onset. Ultimately, some patients with chronic glaucoma eventually go blind.
The natural histories of a patient with a healthy optic nerve and four other patients with COAG are shown in Figure 9.2. Using a “rule of tens,” we can roughly approximate the distribution of a white or black population into the categories of COAG shown in this figure. For every 1000 persons aged 40 years and older, 100 are suspected of having COAG on the basis of field, disc, IOP findings, or dense risk factors; 10 have COAG, and approximately 1 will be blind as a result of COAG.
CLINICAL RISK FACTORS FOR CHRONIC OPEN-ANGLE GLAUCOMA
Risk factors are clinically useful to assess the risk for glaucoma based on the characteristics of the individual patient. To use this knowledge most effectively, it is helpful to understand the relative importance and magnitude of clinical risk factors. Although many risk factors have been identified for COAG, a much smaller number is well supported by evidence. Most of the evidence for COAG risk factors has been obtained from prevalence surveys or case–control studies. These have been complemented, especially in recent years, by high-quality clinical trials and cohort studies. In general, there is good agreement on risk-factor information based on prevalence and that based on incidence. Some risk factors for COAG are also risk factors for progression. Clinical risk factors may be divided into general risk factors, ocular risk factors, and systemic risk factors. (Risk factors for the conversion of suspected glaucoma with elevated IOP to COAG are discussed in Chapter 10.)
General Risk Factors
Age
As described previously, population-based studies of prevalence and incidence consistently show a steady rise in rates with increasing age. As a rule of thumb, prevalence tends to roughly double for each decade over 40 (i.e., relative risk [RR] of 2 per decade) and is about 10-fold higher in the 80 years and older group compared with the 40- to 49-year-old group (Table 9.2). In blacks, the RRs for incidence by decade are lower than in whites (because of the higher incidence seen in the 40- to 49-year-old reference group) (Table 9.3). In the EMGT, the RR of progression of early glaucoma was 1.5 for those 68 years of age and older, compared with younger persons (72).
Race
In general, the prevalence of COAG is highest in black populations; intermediate in whites, Hispanics, and southern Asian populations (Singapore Chinese, Indian); and lowest in northern Asian populations (Mongolia, Inuit) (Table 9.1). The Baltimore Eye Survey found the prevalence of COAG in blacks to be four times greater than that in whites (29). A similar difference in the overall incidence of COAG for those aged 40 years and older has been observed between recent population-based cohorts of blacks and whites (56,73) (Table 9.3). In the Advanced Glaucoma Intervention Study (AGIS) (74), black race was not shown to be a risk factor for progression, in contrast to an earlier cohort study (75). In the CNTGS (76), Chinese patients had a significantly lower risk of progression than white patients.
Family History
A family history of COAG is an important risk factor for COAG. Having a first-degree relative (parent, sibling, or child) with glaucoma has been consistently associated with an increased risk for COAG in prevalence surveys (77–81). The odds ratio (OR) of COAG for a family history of glaucoma is higher if based on patients with previously diagnosed glaucoma (Baltimore OR, 4.7; Blue Mountains Eye Study OR, 4.2) than if based on newly detected cases (Baltimore OR, 2.8; Blue Mountain Eye Study OR, 2.4). This suggests that having a diagnosis of COAG leads to a greater awareness of glaucoma in the family. The association between COAG and family history may be stronger when the affected relative is a sibling (OR, 3.7) rather than a parent (OR, 2.2) or child (OR, 1.1) (78). In one population-based survey, researchers directly examined 497 siblings and offspring of patients with glaucoma and of control participants (80). For first-degree relatives of patients with definite glaucoma, the estimated lifetime RR for glaucoma was 9.2, albeit with very wide confidence intervals (CIs) (95% CI, 1.2 to 73.9). Family history was a risk factor for glaucoma in one prospective population-based study (RR, 2.1) (82), although no such association was found in the Ocular Hypertension Treatment Study (OHTS). In prospective studies of established glaucoma, family history has not been shown to be a significant predictor of progression (72,76).
Ocular Risk Factors
Intraocular Pressure
The evidence that IOP is a risk factor for glaucoma has recently become so strong that, unlike any other risk factor for glaucoma, it satisfies criteria commonly used to assess causality (83,84). A strong dose–response relationship between IOP and glaucoma has consistently been shown in prevalence surveys (Table 9.1) and in longitudinal studies of incidence and progression (73,82,85,86). The most decisive new evidence in recent years was the finding in randomized clinical trials that IOP lowering decreased the incidence and progression of glaucoma compared with no treatment (61,63,85). In addition, there is support for plausible biologic mechanisms that link elevated IOP to apoptosis of ganglion cell neurons through blockage of retrograde axonal transport (87,88). In short, IOP is best considered both a risk factor for and a cause of glaucoma. A good analogy is the relationship between smoking and lung cancer, in which smoking is both a strong risk factor for lung cancer and one of several causes.
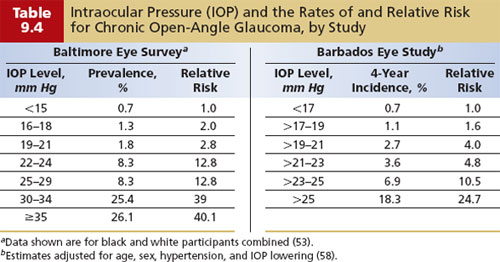
In the Baltimore Eye Survey, the prevalence of COAG rose with increasing IOP (Table 9.4). The prevalence of COAG in persons with an IOP of 35 mm Hg or greater was more than 40 times as high as that in persons with an IOP less than 15 mm Hg. The incidence of COAG was found to increase steadily with IOP in the Barbados Eye Study to an RR of 25 for an IOP of more than 25 mm Hg, compared with a reference group with an IOP less than 17 mm Hg (Table 9.4). In the population of the Melbourne Visual Impairment Project, it was estimated that for every 1 mm Hg, the risk for glaucoma increased by 10%. Importantly, the OHTS also demonstrated that reducing the IOP by an average of 23% decreased the incidence of COAG by 60% (85). In the EMGT and the CNTGS, an IOP reduction of 25% and greater than 30% cut the risk of progression by 33% and 50%, respectively, compared with no treatment (61,63). Other clinical trials of COAG report that greater pressure lowering results in less progression (86,89,90).
An important implication of these population-based data and the CNTGS findings is that IOP may contribute to the onset of glaucoma even in patients with untreated IOP in the low-normal range and that some of these patients will benefit from IOP reduction. An intriguing finding from AGIS was that persons with the greatest IOP reduction (mean IOP, 12.3 mm Hg with treatment vs. 23.3 mm Hg before treatment) had stable visual fields (based on mean field defect score; risk of progression in the group was 14.4%) in contrast to groups with higher levels of IOP that showed progressive field loss over the 8-year follow-up period (86). This suggests that, at least in hypertensive COAG, an IOP level exists below which progression of glaucoma is stopped or at least suppressed to subclinical levels in most patients. High diurnal variation in IOP may also be a risk factor for progression in addition to the risk related to mean IOP.
Optic Nerve Head and Peripapillary Features
When the parameters used to define glaucoma, such as cup-to-disc ratio, are also treated as risk factors, a problem with circular reasoning may result. One population-based study reported that the incidence of COAG for persons with a baseline cup-to-disc ratio of more than 0.7 was 8.6-fold higher than for those with a cup-to-disc ratio of less than 0.7 (56). However, this estimate may be inflated because one of the criteria for defining COAG was having a cup-to-disc ratio of more than 0.7. Another feature of the optic nerve head that may be associated with glaucoma is the vertical disc diameter and the disc area (91–93), possibly because of greater susceptibility to glaucomatous nerve damage (94,95). However, the reported associations may have occurred in part because larger discs have larger cup-to-disc ratios (96–99), which in turn were part of the diagnostic criteria in most of these studies.
Optic disc hemorrhages were first recognized as a precursor to glaucomatous optic nerve damage by Bjerrum in 1889. This somehow fell out of clinical lore until it was rediscovered in 1977, when Drance and colleagues provided the first longitudinal findings (100), subsequently confirmed by others (101,102), that eyes with a disc hemorrhage had an elevated risk for progressive visual field loss (62,103,104). Additional support has been provided by both the EMGT (RR, 1.02 per percentage of visits with disc hemorrhage present) and the CNTGS (RR, 2.72) (76). Population surveys that have specifically reported on optic disc hemorrhage have found prevalences in adults ranging from 0.9% to 1.4%, of which only 2% and 30%, respectively, were in persons with glaucoma (42,105). In the second of these two studies, the prevalence of glaucoma was found to be increased 10-fold in those with disc hemorrhages, and disc hemorrhages were much more common in normal-tension glaucoma (25%) than in high-tension glaucoma (8%) (105). Interestingly, in another population-based series of adults with disc hemorrhages but without glaucoma on screening, 5 of 12 patients followed up for more than 6 years developed visual field loss by year 7 (106). However, particularly in individuals with no other risk factors for glaucoma, an optic disc hemorrhage may be due to other causes, including microvascular disease from diabetes mellitus or hypertension or from a posterior vitreous detachment, Valsalva maneuver, or anticoagulation.
Atrophy of the neurosensory retina and retinal pigment epithelium about the optic nerve head is known as peripapillary atrophy and has been shown to correlate with the presence of glaucoma (96,107,108). Peripapillary atrophy may also worsen along with glaucoma progression (109), although this has not been a consistent finding. Zone alpha peripapillary atrophy has been found in 58% of a white population older than 55 years, rendering it of little diagnostic value; zone beta peripapillary atrophy has been reported to be three times as common in patients with COAG as in controls (96), but it is associated with myopia and is also quite common, with a prevalence of 13%. Peripapillary atrophy does not appear to be specific to glaucoma, and its role in the diagnosis and management of COAG remains unclear.
Myopia
An association between myopia, particularly high myopia, and open-angle glaucoma has long been recognized and is supported by numerous case series and case-control studies (110–114). This association is also supported by large population-based prevalence surveys that reported an elevation of prevalence of COAG in those with any myopia of 48%, 60%, and 70% after adjustment for age and sex (93,115–117). Another survey reported a twofold- to threefold-increased prevalence of glaucoma in individuals with myopia (118). However, individuals with myopia were not found to have a higher incidence or progression of glaucoma in the OHTS or the EMGT, respectively (72). Other longitudinal studies have previously shown high myopia to be a risk factor for progression (119,120).
Other
In EMGT, having exfoliation syndrome and having a relatively thin central corneal thickness were associated with an increased risk for progression (62).
Systemic Risk Factors
Diabetes Mellitus
The prevalence of COAG appears to be higher in the diabetic population by a factor of about 2 in the majority of population-based surveys (121–124), although an association was not found in others (125,126). Most of these studies did not use IOP in their criteria for defining COAG, and one of them showed that the association of diabetes and glaucoma persisted after adjustment for IOP (124). Findings from numerous clinical studies on the association of diabetes and glaucoma are inconsistent and are subject to greater methodological limitations than population-based surveys, particularly selection bias (127,128). IOP is an important confounder of the association between diabetes and glaucoma because persons with diabetes appear to have a slightly higher IOP and have been reported to have a higher prevalence of ocular hypertension and incidence of IOP elevation, compared with persons who do not have diabetes (72,123,124,128). Diabetes has not yet been shown to increase the incidence of glaucoma. Although the weight of available evidence suggests that diabetes is probably a risk factor for glaucoma, this has not been a consistent finding. Self-reported diabetes was associated with COAG progression in the AGIS and the CIGTS (Collaborative Initial Glaucoma Treatment Study) but not in the CNTGS or the EMGT (129).
Blood Pressure
The most meaningful blood pressure variable related to glaucoma appears to be diastolic ocular perfusion pressure or the difference between diastolic arterial pressure and IOP. Diastolic ocular perfusion pressure has consistently been associated with COAG in several large population-based surveys that reported a severalfold increase in the prevalence of COAG among those with lower perfusion pressures (128,130). These surveys suggest that a steep increase in the prevalence of glaucoma occurs when diastolic ocular perfusion pressure falls below 55 mm Hg. This is supported by a large population-based cohort study that showed a strong dose–response gradient between the incidence of glaucoma and diastolic perfusion pressure, with an RR for glaucoma of 3.2 for those with the lowest diastolic perfusion pressure (<55 mm Hg) (73).
The literature on the association between systolic or diastolic blood pressure and glaucoma is confusing, with some population-based studies showing an association and others not (46,122,128,130,131). Similarly, some clinical studies on risk factors link higher blood pressures to glaucoma, and others report that lower blood pressure is more common in those with COAG and those with progression of glaucoma (114,132–138). The best evidence comes from a large population-based cohort study that showed a 51%-decreased risk for COAG in persons with systolic hypertension at baseline and that this protective effect was greater at higher levels of blood pressure (73). One study also described an increased prevalence of glaucoma at both very low and very high levels of systolic blood pressure, with the lowest prevalence in the midrange (130). It may be that high and low blood pressures are linked to glaucomatous optic nerve damage by different mechanisms. This may explain, in part, the apparently contradictory literature on the association between blood pressure and glaucoma.
Lower blood pressure has been reported as a risk factor for progression of COAG in EMGT (129). Numerous large surveys have consistently found that IOP elevation is associated with increased systolic and diastolic blood pressure (122,128, 130). However, the associated change in IOP is not clinically significant. For example, in the Baltimore Eye Survey, a 10–mm Hg increase in systolic or diastolic blood pressure was associated with an increase in IOP of 0.25 and 0.19 mm Hg, respectively (128).
There has been considerable attention paid to the role of episodic decreases in blood pressure in glaucoma, particularly in normal-tension glaucoma. Nocturnal arterial hypotension, which has also been implicated in anterior ischemic optic neuropathy, has been linked to the presence of COAG and normal-tension glaucoma and the progression of normal-tension glaucoma and COAG (137,139–144). Several clinical studies also suggest that nocturnal arterial hypotension is more common in normal-tension glaucoma than in COAG with elevated IOP (139,145). There are several reports of a hemodynamic crisis precipitating optic nerve damage in patients with COAG, but it has not been shown to occur more frequently than in individuals without COAG (146,147). Individuals with glaucoma and diastolic perfusion pressures less than 55 mm Hg may be most at risk due to episodes of decreased blood pressure, such as from nocturnal arterial hypotension, general anesthesia, and overmedication for systemic hypertension; however, this remains to be established.
Migraine
Stay updated, free articles. Join our Telegram channel

Full access? Get Clinical Tree


