Assessment of Visual Fields
Advances in the technology of visual field testing have changed our clinical perception of normal and abnormal fields of vision. For example, the two-dimensional presentation of concentric lines around the point of fixation has given way to three-dimensional displays in symbols and numerical values. However, the normal field of vision and the changes created by glaucoma are just the same as they were 100 years ago when Bjerrum discovered the arcuate scotoma using the back of his consulting room door as a background for his field testing. This chapter therefore first considers the normal field of vision and how it is altered by glaucomatous damage, and then reviews the instruments and techniques by which these parameters can be measured.
NORMAL VISUAL FIELD
A helpful way to begin the study of visual fields and the methods by which they are measured is to consider Traquair’s classic analogy of “an island of vision surrounded by a sea of blindness” (Fig. 5.1). This three-dimensional concept can be reduced to quantitative values by plotting lines (isopters) at various levels around the island, or by measuring the height (sensitivity) at different points in the island of vision.
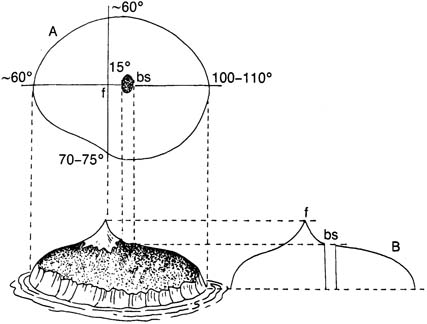
Figure 5.1 The normal visual field (right eye) is depicted as the Traquair “island of vision surrounded by a sea of blindness,” with projections showing the peripheral limits (A) and the profile (B). Fixation (f) corresponds to the foveola of the retina, and the blind spot (bs) to the optic nerve head. The approximate dimensions of the absolute peripheral boundary of the visual field and the location of the blind spot are shown (A).
Boundaries
The shoreline of the island corresponds to the peripheral limits of the visual field, which normally measure, with maximum target stimulation, approximately 60 degrees above and nasal, 70 to 75 degrees below, and 100 to 110 degrees temporal to fixation (1). The typical configuration of the normal visual field, therefore, is a horizontal oval, often with a shallow inferonasal depression (Fig. 5.1). The shape is usually of greater diagnostic significance than the absolute size of the visual field is, because the latter is influenced by many physiologic and testing variables.
Contour
The peaks and valleys on the island correspond to areas of increased or decreased vision within the peripheral limits of the visual field. These contours can be mapped by recording the weakest light stimulus that can be seen at specific locations in the field of vision or by using test objects with reduced stimulus value to plot smaller isopters within the absolute boundaries. The area of maximum visual sensitivity in the normal field during photopic condition is at the point of fixation, corresponding to the foveola of the retina, and appears as a smoothly rising peak surrounded by a high plateau (2). The visual sensitivity then tapers down more gradually until it again falls abruptly at the peripheral limits.
Blind Spot
Nerve fibers, collecting visual information from the retina, come together approximately 10 to 15 degrees nasally from the fovea. This region corresponds to the optic nerve head, and because there are no photoreceptors in this area, it creates a deep depression within the boundaries of the normal visual field, which is called the blind spot. Because the image formed on the retina is upside down and backward, the blind spot is located temporal to fixation. The blind spot has two portions: (a) an absolute scotoma and (b) a relative scotoma (3). The absolute scotoma corresponds to the actual optic nerve head and is seen as a vertical oval. Because the nerve head has no photoreceptors, this portion of the blind spot is independent of the test object stimulus value.
The relative scotoma surrounds the absolute portion and corresponds to peripapillary retina, which has reduced visual sensitivity, especially inferiorly and superiorly. In a study correlating the blind spot size to the area of the optic disc and peripapillary atrophy, the absolute scotoma included the peripapillary scleral ring and the peripapillary zone beta (see definitions in Chapter 4), whereas zone alpha was attributed to the relative scotoma (4).
VISUAL FIELD LOSS IN GLAUCOMA
Peripheral Loss
Defects along the peripheral boundaries of the visual field (i.e., peripheral nasal steps, vertical steps, and temporal sector defects) are most often found in association with scotomas in the more central arcuate area, although in some patients with early glaucomatous visual field loss, peripheral defects may be the only detectable abnormality (5–8). With automated static perimetry (discussed later), it has become common practice to measure only the central 24 to 30 degrees of the visual field, because of the increased time requirement with this technique. The question arises, therefore, as to how much information is being missed by ignoring the more peripheral portions of the field. In the presence of paracentral scotomas, peripheral measurements appear to add no significant information regarding the progression of visual field damage (9). In the initial diagnosis, however, a peripheral field defect, usually a nasal step, may be the only abnormality detected by automated perimetry in 3% to 11% of patients, depending on the testing method (10–13). To be clinically useful, the time required to obtain this information must not add excessively to the overall testing time; further study is needed to determine whether this can be achieved with newer programs for automated perimetry.
Localized Nerve Fiber Layer Defects
In glaucoma, structural damage to ganglion cells and their axons causes partial or complete functional loss in the area of damaged cells. The glaucomatous process typically causes initial damage to one or more axon bundles, creating a localized visual field defect. Focal defects, due to loss or impairment of retinal nerve fiber bundles, constitute the most definitive early evidence of visual field loss from glaucoma. The nature of the nerve fiber bundle defects relates to the retinal topography of these fibers, as discussed in Chapter 4.
Arcuate Defects
Bjerrum (pronounced bee YER um) described an arcuate visual defect, which he showed is strongly suggestive of glaucoma. This arcuate scotoma starts from the blind spot and arches above or below fixation, or both, to the horizontal median raphe, corresponding to the arcuate retinal nerve fibers (Figs. 5.2A and 5.3). The nasal extreme of the arcuate area along the median raphe may come within 1 degree of fixation and extends nasally for 10 to 20 degrees (14). Early visual loss in glaucoma commonly occurs in this arcuate area, especially in the superior half, which correlates with the predilection of the inferior and superior temporal poles of the optic nerve head for early glaucomatous damage (14,15). As field defects develop within the arcuate area, they most often appear first as one or more localized defects, or paracentral scotomas (Fig. 5.2B). The typical pattern of progression of glaucomatous visual field defects is for a shallow paracentral depression to become denser and larger (16), eventually forming a central absolute defect, surrounded by a relative scotoma (17,18). The relative scotoma represents fluctuation that can be seen at the border of the physiologic blind spot and glaucomatous defects, but is significantly larger and more sloping in the latter (19). Occasionally, the early arcuate defect may connect with the blind spot and taper to a point in a slightly curved course, which has been referred to as a Seidel scotoma (Fig. 5.2C). As the isolated defects enlarge and coalesce, they form an arching scotoma that eventually fills the entire arcuate area from the blind spot to the median raphe, which is called an arcuate or Bjerrum scotoma (Fig. 5.2D). With further progression, a double arcuate (or ring) scotoma develops (Fig. 5.2E). The rate of visual field loss correlates with the size of the scotoma, in that, the larger the scotoma, the more rapidly it is likely to enlarge (20).
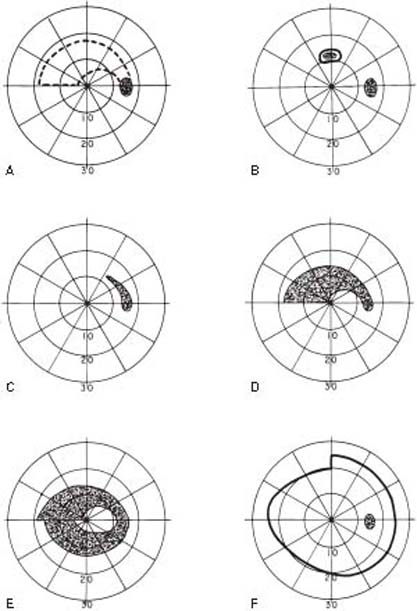
Figure 5.2 Arcuate nerve fiber bundle defects. A: The arcuate (or Bjerrum) area is shown within the dotted lines. B: Superior paracentral scotoma, with central absolute defect surrounded by a relative scotoma. C: Seidel scotoma. D: Complete arcuate (Bjerrum) scotoma. E: Double arcuate (ring) scotoma with superior central nasal step. F: Vertical step (or hemianopic offset).
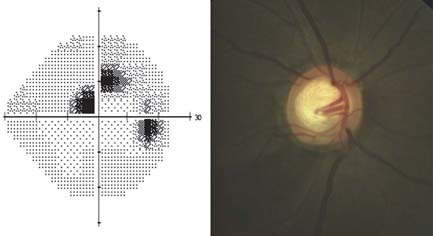
Figure 5.3 Grayscale of a SITA standard 24-2 achromatic visual field showing superior arcuate defect with corresponding inferior neuroretinal thinning and retinal nerve fiber layer thinning.
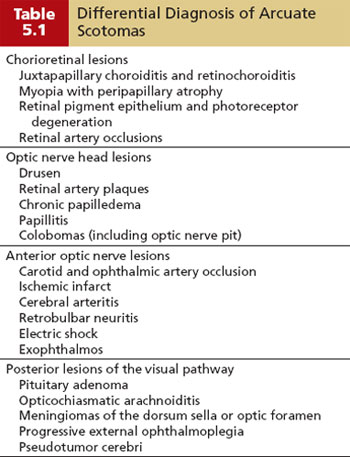
Although the arcuate defect is probably the most reliable early form of glaucomatous field loss, it is not pathognomonic, and the following additional causes must be considered, especially when the field and disc changes do not seem to correlate: chorioretinal lesions, optic nerve head lesions, anterior optic nerve lesions, and posterior lesions of the visual pathway (21–23) (Table 5.1). At times the arcuate defect involves the papillomacular nerve fiber bundle (Fig. 5.4).
Nasal Steps
The loss of retinal nerve fibers rarely proceeds at the same rate in the upper and lower portions of an eye. Consequently, a steplike defect is frequently created where the nerve fibers meet along the median raphe (Fig. 5.5). Because the superior field is involved somewhat more frequently than the inferior portion is in the early stages of glaucoma, the nasal step more often results from a greater defect above the horizontal midline, which is referred to as a superior nasal step. However, inferior nasal steps are not uncommon. Nasal steps are also distinguished by their central or peripheral location (5). A central nasal step is created at the side of an unequal double arcuate scotoma closest to fixation. Unequal contraction on the peripheral side of the defect, due to loss of corresponding bundles of peripheral arcuate nerve fibers, produces a defect that has been called the peripheral nasal step of Ronne. Nasal step often begins as an isolated scotoma in the nasal periphery (6). The shape of the peripheral nasal step with kinetic testing differs according to its distance from fixation and is not necessarily found in all isopters (18,24). Nasal step appears to be a common defect in acute and early chronic angle-closure glaucoma (25,26).
Vertical Step
A stepwise defect along the vertical midline, referred to as a vertical step (Fig. 5.2F) or hemianopic offset, is a less common feature of glaucomatous field loss than the nasal step is; it occurs in roughly 20% of cases (27,28). The mechanism of this field defect is not fully understood, although it may relate to segregation in the optic nerve head of axons from either side of the vertical midline (27). The defect more often appears on the nasal side of the vertical midline (Fig. 5.6). However, healthy eyes have also revealed greater sensitivity temporal to the hemianopic border, and it has been suggested that a small peripheral step at the vertical midline should arouse suspicion of glaucoma only if the defect is located temporally (29). It also has limited diagnostic value because most are associated with other glaucomatous field changes (28), and the main significance of the observation is in distinguishing glaucomatous vertical midline defects from those caused by neurologic lesions.
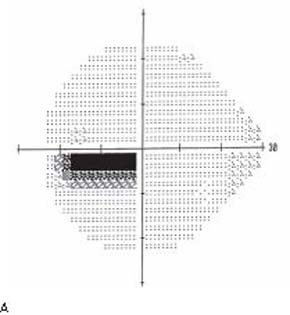
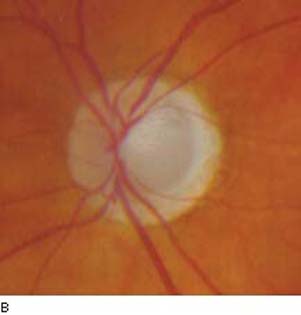
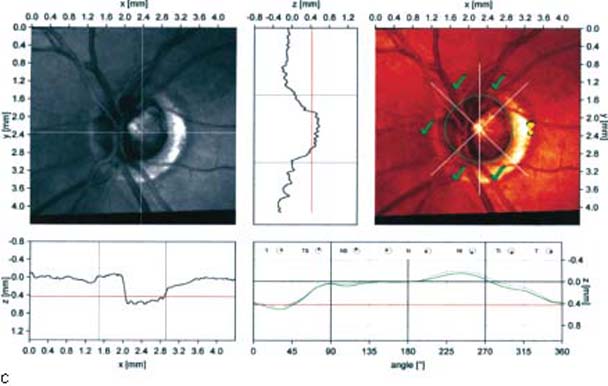
Figure 5.4 Grayscale of a SITA standard 24-2 achromatic visual field showing an arcuate defect involving the papillomacular nerve fiber bundle. The corresponding optic nerve with extensive temporal thinning and peripapillary atrophy. HRT-II Moorfields regression analysis calling attention to the temporal rim.
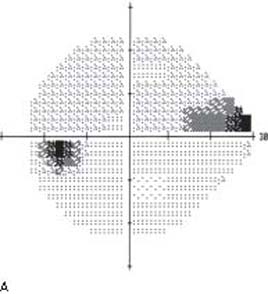
Figure 5.5 Grayscale of a SITA standard 24-2 achromatic visual field showing a nasal step. Optic nerve demonstrates significant inferior thinning, which is also called to attention by the HRT-II Moorfields regression analysis.
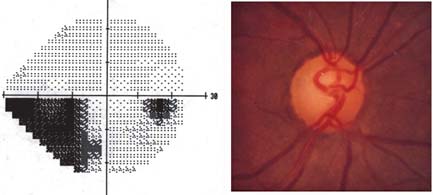
Figure 5.6 Grayscale of a SITA standard 24-2 achromatic visual field showing a vertical step.
Generalized and Central Depression of the Visual Field
The increased sensitivity with which newer instruments allow evaluation of vision is changing our understanding of the natural history of progressive visual field loss in glaucoma. Although defects related to loss of retinal nerve fiber bundles are the most familiar visual field changes induced by glaucoma, and central vision is typically one of the last regions to be totally lost, studies have shown mild central and diffuse reduction in the visual field even in the early stages of glaucoma (30–35). The mechanism for this is uncertain, although it appears to represent pressure-induced damage with diffuse nerve fiber loss, as evidenced by abnormal light-sense and flicker perimetry, which have been shown to accompany diffuse retinal nerve fiber layer (NFL) loss (33,34,36,37).
Central vision is typically preserved in the early course of glaucoma, but rarely it may be affected by a localized damage involving the fixation point. In these situations, other visual functions, such as visual acuity and color vision, may become abnormal. These central defects should be differentiated from macular disorders.
Although most studies agree that some patients with early glaucoma can have purely diffuse loss in the absence of other causes, other investigators have challenged this concept, suggesting that a generalized depression in glaucoma is rare and that these patients may have other causes for the diffuse loss of perimetric sensitivity, such as media opacity, miosis, or retinal dysfunction (30–32,34,38–42). In any case, the diagnostic value of this finding is currently limited by its nonspecific nature, but it should still be looked for and noted in the course of visual field testing and analysis. Although the measures of generalized reduction in visual function may one day be important in the early detection of glaucoma, they are too inconsistent and nonspecific at present to be of highly significant clinical value. In the future, they may acquire greater diagnostic significance as our knowledge of glaucomatous visual dysfunction expands. The following are some of the perimetric and other measures that can be used to evaluate generalized visual impairment in glaucoma.
Concentric Contraction
Generalized reduction in the visual field may become manifest as a decrease in sensitivity for specific retinal locations or as a concentric constriction of the visual field, both of which precede other detectable glaucomatous field defects in many patients (43,44). Isopter contraction, as an early field defect of glaucoma, is often more marked in the nasal field, which has been called “crowding of the peripheral nasal isopters” (45).
Enlargement of the Blind Spot
Enlargement of the blind spot, due to depression of peripapillary retinal sensitivity, is also considered to be an early glaucomatous field change. However, it may be seen with other optic nerve or retinal disorders. One example has been called “acute idiopathic blind spot enlargement” and is related to multiple evanescent white-dot syndrome and possibly other retinal diseases (46–48). Enlargement of the blind spot can also be produced in healthy persons with threshold targets, so that it is not a pathognomonic sign of glaucoma (49). The relative portion of the blind spot depends on the stimulus value and varies with different testing methods. If the temporal margin of the relative blind spot comes close to the corresponding isopter (in kinetic perimetry), the two boundaries may artifactually become confluent, creating false baring of the blind spot. In addition, because the reduced sensitivity of the peripapillary retina is greater in the upper and lower poles, test objects with small stimulus value may cause vertical elongation of the blind spot, which can break through the isopter, causing true baring of the blind spot (Fig. 5.7).
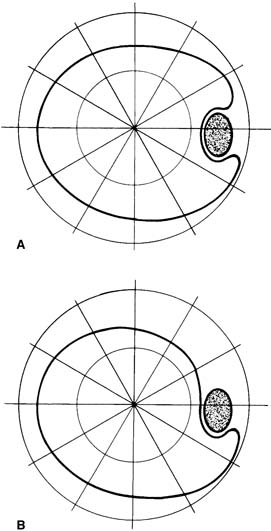
Figure 5.7 False baring (A) and true baring (B) of the blind spot.
Angioscotomata
Angioscotomata are long, branching scotomas above and below the blind spot, which are presumed to result from shadows created by the large retinal vessels. Retinal vessels may have corresponding representation of angioscotomata in the visual cortex (50). Angioscotomata may represent an early glaucomatous field defect, although it is technically difficult to demonstrate and not highly diagnostic (51–54).
Temporal Sector Defect
Because the retinal nerve fibers nasal to the optic nerve head converge on the disc by a direct route, a lesion involving these fiber bundles produces a sector defect temporal to the blind spot (18,24) (Fig. 5.8). This defect usually appears later in the course of glaucomatous field loss (55), but can be the presenting visual field defect. With automated perimetry, glaucomatous defects temporal to the blind spot are not uncommon, but usually add significant information beyond findings of central field testing only in patients with late visual field loss (56).
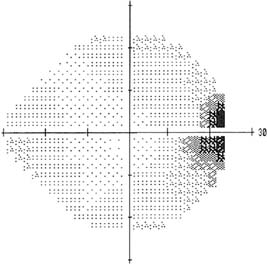
Figure 5.8 Grayscale of a SITA standard 24-2 achromatic visual field showing a temporal wedge defect.
Advanced Glaucomatous Field Defects
The natural history of progressive glaucomatous field loss involves the eventual development of a complete double arcuate scotoma, which coalesces nasally at the horizontal meridian (57) and may extend to the peripheral limits in all areas except temporally. This results in a central island and a temporal island of vision in advanced glaucoma. With continued damage, these islands of vision progressively diminish in size until the tiny central island is totally extinguished, which may occur abruptly. Glaucoma surgery appears to accelerate the loss of the small central island in some patients, possibly because of the sudden change in intraocular pressure (IOP), although this complication does not occur frequently enough to constitute a contraindication to surgery in these patients (58). The temporal island of vision is more resistant and may persist long after central vision is lost. However, it, too, will eventually be destroyed if the glaucoma is not controlled, leaving the patient with no light perception.
Visual Field Changes in Normal-Tension Glaucoma
The nature of visual field defects may be influenced by the IOP, although reports on this are somewhat conflicting. In one study of patients with chronic open-angle glaucoma (COAG) who had early visual field loss, persons with diffuse depression had higher pressures than those with localized defects did (59) (Fig. 5.9). In addition, in some studies patients with COAG whose IOP has never exceeded approximately 21 mm Hg, commonly referred to as normal-tension (or low-tension) glaucoma, had scotomas with steeper slopes, greater depth, and closer proximity to fixation, compared with patients with COAG who had higher IOPs (60,61). In other studies, however, these two groups did not differ significantly when the same degree of optic nerve damage was present (62,63). Another study of normal-tension and high-tension glaucoma patients whose automated visual fields were matched to within a 0.3-dB mean deviation (explained later) revealed no significant difference in focal defects in the overall field or superior hemifield, but did show significantly more localized loss in the inferior hemifield among the normal-tension patients, supporting the hypothesis of a vascular mechanism in that group (64).
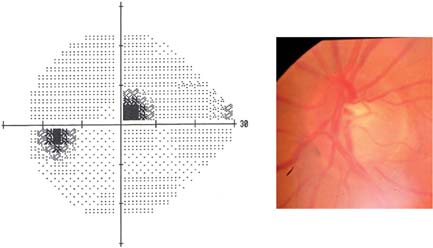
Figure 5.9 Grayscale of a SITA standard 24-2 achromatic visual field showing a paracentral defect from a patient with low-tension glaucoma. The optic nerve photograph demonstrates a corresponding notch inferiorly.
One study investigated the effect of trabeculectomy on the rate of visual field progression in patients with normal-tension glaucoma. The authors concluded that surgical lowering of IOP resulted in a decreased rate of visual field loss in the operated eye (65).
The Collaborative Normal-Tension Glaucoma Study investigators also concluded that IOP reduction decreases glaucoma progression in normal-tension glaucoma (66).
Visual Field Changes with Acute Pressure Elevation
The preceding discussions have dealt with field changes that are associated primarily with chronic forms of glaucoma. When the IOP elevation is sudden and marked, as in acute angle-closure glaucoma, various associated field changes have been reported, including general depression, early loss of central vision, arcuate scotomas, and enlargement of the blind spot (67). After the acute attack is brought under control, the fields return to normal in some patients, but other patients may have reduced color vision, generalized decreased sensitivity, or constriction of isopters, especially superiorly (68).
When the IOP is artificially elevated, by compression of the globe or administration of topical steroids, typical glaucomatous field defects or constriction of central isopters occur in some eyes (69–75). The changes are reversible when the IOP returns to normal and are dependent on the ocular perfusion pressure (73,74,76). This response to artificial pressure elevation is said to occur more commonly in patients with glaucoma (69,70,76)—especially normal-tension glaucoma (67)—although one study found no difference between patients with and without glaucoma (71).
Correlation between Optic Nerve Head and Visual Field Defects
In most patients with glaucoma, clinically recognizable disc changes precede detectable field loss, and the presence or absence of glaucomatous field defects can usually, but not always, be predicted from the appearance of the optic nerve head (77–82). Quigley and coworkers (83,84) attempted to correlate axon loss in the optic nerve head with visual field defects. Although limited by small sample size, their work suggested that not only does nerve fiber loss occur before reproducible field defects in some patients with elevated IOP, but the extent of axonal loss may be much greater than the corresponding visual field change. With standard perimetric techniques, 25% to 35% of the retinal ganglion cells may be lost in an eye with a normal field by the time reproducible early field defects are found (85), and 10% or fewer axons may remain by the stage of severe field loss (83). When correlating retinal ganglion cell atrophy with automated perimetry in patients with glaucoma, a 20% loss of cells, especially large ganglion cells in the central 30 degrees of the retina, correlated with a 5-dB sensitivity loss (discussed later), whereas a 40% loss corresponded with a 10-dB decrease, and some ganglion cells remained in areas with 0-dB sensitivity (84).
The nature of optic nerve head cupping can also be used to predict the type (in addition to the presence) of field loss. Extensive or focal absence of neural rim tissue, especially at the inferior or superior poles, is the most reliable indicator of visual field disturbance and is usually associated with a field defect in the corresponding arcuate area (79,86–89). In some eyes, field loss may occur before the pallor reaches the disc margin (86), and unusual cases have been reported with field damage despite round, symmetric cups (79). Quantitative measures of the retinal NFL also correlate with the visual field loss in patients with glaucoma (90).
The ability to predict impending glaucomatous visual field loss by the appearance of the optic nerve head is less accurate than correlating disc damage with established field loss. No single parameter or combination of parameters in glaucomatous optic atrophy is totally satisfactory for this purpose. The parameters that correlate best with visual field loss are magnification-corrected measurements of neuroretinal rim area and defects in the retinal NFL (91–99). Diffuse structural changes in the optic nerve head or retinal NFL are more often associated with diffuse depression of visual function, whereas localized changes correlate more with localized visual field changes (98). In some cases, the early field loss associated with retinal NFL defects can be detected with automatic perimetry when it has been missed with manual perimetry (100,101).
The correlation between optic nerve head and visual field defects in glaucoma is close enough to prompt a search for other underlying disease processes, such as neurologic disorders, if a correlation is not found. Nevertheless, the absence of a perfect correlation indicates that both disc and field examinations are essential in managing the glaucoma patient (102). In general, optic nerve head and retinal NFL changes have their greatest value in the early stages of glaucoma, whereas progressive visual field loss becomes the more useful guide to therapy in advanced cases (77,103).
BASIC PRINCIPLES OF VISUAL FIELD TESTING
Stimuli
The typical stimuli used in clinical perimetry are spots of light of various predefined combinations of diameter and intensity projected on the background. The visibility of the stimulus also depends on how far the eye is positioned from the screen and the brightness of the background. The other factors affecting perception of the stimulus include the length of time the stimulus is presented, the color of the stimulus and the background, whether kinetic or static techniques are used, and the condition of the eye and the patient.
The absolute light intensity is measured in units of luminance, called apostilbs, but the measured light sensitivity is expressed in logarithmic units referred to as decibels (dB), which provides a more linear relationship between visual perception and a change in light intensity. A decibel is 0.1 log-unit, so that a 10 dB represents a 10-fold decrease of the maximum stimulus of any specific perimeter, and a 20 dB represents a 100-fold stimulus attenuation. The maximum intensity of a perimeter has a value of 0 dB, meaning that the stimulus is not attenuated. Log-units and decibels are relative units, and resulting stimulus intensity is not the same for all instruments, but decibels represent the same percentage change of the intensity in all perimeters.
Stimulus Size
The standard target for kinetic and static perimetry is a white disc, the stimulus value of which can be adjusted by varying the target size or luminosity relative to that of the background. In healthy persons, the mean retinal sensitivity has been shown to increase with the increasing size of the test object (104). If the diameter of the smaller stimulus is increased, it may be as visible as the less intense larger stimulus, the phenomenon known as spatial summation. Usually, doubling the stimulus diameter has the same effect on the visibility of the stimulus as increasing its intensity by 5 dB (1).
Exposure Time
The exposure time will also affect the stimulus visibility. The stimulus presented over a longer period of time may become more visible, the phenomenon called temporal summation. However, after the temporal summation is complete, which happens typically after 0.1 second, the image is not seen any better. The Humphrey field analyzer uses a 0.2-second stimulus duration, which also helps prevent movement of the patient’s gaze toward the stimulus. However, suprathreshold static targets should be presented for a longer time, usually 0.5 to 1 second, and test objects should be just above threshold for the area being tested.
Kinetic versus Static Perimetry
The threshold is theoretically the target that is just bright enough to be seen 50% of the time at that location (the differential light threshold). The stimulus that is below the threshold value cannot be seen. Kinetic perimetry defines threshold by moving the test object from a nonseeing (subthreshold) to a seeing (suprathreshold) area, and by recording the point at which it is first seen in relation to fixation (Fig. 5.10A). The procedure documents the boundaries of the visual field for the absolute limits and areas of relative differences in visual acuity within the field (Fig. 5.11). As previously noted, the boundaries, or contour lines, are called isopters. The size and shape of a particular isopter depend partly on the stimulus value of the corresponding test object.
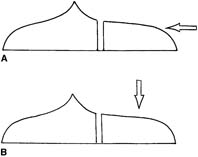
Figure 5.10 Standard techniques for measuring the visual field. In kinetic technique (A), test object moves from nonseeing to seeing area. Static technique (B) measures sensitivity of retina at a given point.
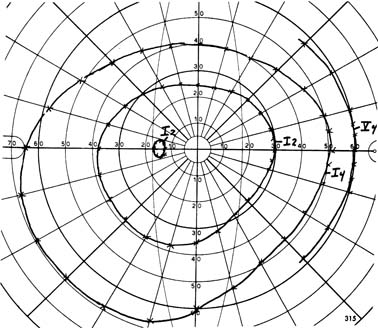
Figure 5.11 Example of manual kinetic perimetry showing two complete isopters (I62 and I64) and a third partial isopter (V64) in nasal periphery with blind spot measured by I62 target.
Static perimetry involves the presentation of stationary test objects, by using suprathreshold or threshold presentations. Suprathreshold static presentation is an “on–off” technique in which a test object just above the anticipated threshold for the corresponding portion of the visual field is momentarily presented, and the points at which the patient fails to recognize the target are noted as visual field defects. It is a way of “spot checking” for areas of relative or absolute blindness, usually in the central visual field. The suprathreshold strategy is used mostly as a screening test.
Threshold static perimetry measures the relative intensity thresholds for the visual acuity of individual retinal points in the field of vision. The technique involves gradually increasing the target light from subthreshold intensity in small increments, and recording the level at which the patient first indicates recognition of the target (Fig. 5.10B), or decreasing it from a suprathreshold level and recording the lowest stimulus value seen. The points are tested at predefined locations throughout the visual field, and the results are recorded as grayscale symbols and numerical sensitivity values in decibels (Fig. 5.12).
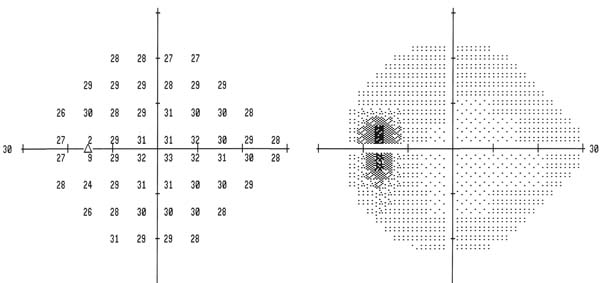
Figure 5.12 Examples of threshold static (standard automated) perimetry. Retinal sensitivity is measured at points throughout a portion of the visual field (central 24 to 30 degrees in this example). Results can be displayed in numerical values and symbols.
The kinetic stimuli are usually seen better than the static ones are, but when the stimulus is moved slowly, the results of kinetic and static perimetry are similar.
To minimize the patient’s anticipation of when or where the next test object will appear, the presentation should be random, rather than following a predictable pattern, and the time between stimuli should be varied slightly. To avoid patient anxiety when testing in a nonseeing area, the examination should return periodically to a previously seen area.
For kinetic targets, a stimulus velocity of 4 degrees/sec appears to be optimal for all targets in the central and peripheral visual field, but a slower velocity of 2 degrees/sec may provide more reproducible results in some patients (105,106). The test object should always be moved from a nonseeing to a seeing area—that is, from the periphery toward fixation when outlining an isopter and from the center of the blind spot or a scotoma.
Threshold static perimetry has been shown to be more sensitive than kinetic perimetry is in detecting glaucomatous field loss (107,108). In one study of patients with COAG, a defect was found in one third of the cases with static perimetry that was missed by kinetic perimetry (109). In a long-term study of patients with ocular hypertension, 75% of those who developed glaucomatous damage had an abnormality detected by automated static perimetry (by using a hemifield test, explained later) 1 year before field loss was detected by manual perimetry, by using a combination of kinetic and static presentations (110).
When automated static perimetry was compared with Goldmann kinetic perimetry as a test for driving, a significant number of patients with severe field defects, detected by static perimetry, still met the standard for driving by the kinetic perimetry (111).
Because standard static threshold perimetry tests sensitivity near threshold, patients do not see approximately half the presented stimuli, and they may report that stimuli are too dim to see. Patients should be told that the limits of their seeing abilities are being tested and that barely seeing the stimuli is natural.
Background Illumination
Background illumination for manual perimetric techniques traditionally stimulates both rods and cones. The adapting field luminance currently used in static and kinetic perimetry is marginally photopic (e.g., 31.6 apostilbs), although the optimum luminance has yet to be established. One study suggested that the lower levels of background illumination may allow minor reductions in light transmission by the ocular media to produce significant changes in the recorded threshold sensitivity (112). In a comparison of scotopic and photopic fields, localized scotomas in patients with glaucoma were of equal depth, but diffuse scotopic defects significantly exceeded the photopic, supporting the concept that not all ganglion cell types are equally susceptible to glaucomatous damage (113). Scotopic defects were also found more often in patients with ocular hypertension or glaucoma than in healthy persons, and the defects were mainly in the superior hemifield (114).
With bowl perimeters, photometric adjustment should be made with the patient in place, because facial coloring affects luminosity. The most important principle regarding illumination is to keep the target and the background constant and reproducible from one examination to the next.
Physiologic Influences on Visual Fields
The following factors should be compensated for, if possible, or otherwise should be considered when interpreting the fields.
Pupil Size
Although decreased pupil size should have little effect on a patient’s perception of a stimulus, because background and stimulus are affected equally, significant miosis may depress central and peripheral threshold sensitivities and exaggerate field defects (115), even after correction of induced myopia (116). One study used neutral density filters to reduce the retinal illumination by the equivalent of halving the pupillary diameter, which reduced the mean threshold with two automated perimeters by 1.1 to 1.7 dB (117). In another study, use of pilocarpine worsened the visual field global indices, such as mean deviation and pattern standard deviation (explained later) (118). For this reason, the pupil size should be recorded with each field, and the influence of miosis should be considered when a field change is detected. Mydriasis has less influence on the visual field than miosis does, although pupillary dilatation with use of tropicamide, 1%, or no ocular medication in healthy persons reduced threshold sensitivity with automated perimetry in one study (119).
Age
Increasing age is also associated with reduced retinal threshold sensitivity (120). This effect starts as early as 20 years of age, progresses linearly throughout life, and involves the peripheral and superior areas more than the pericentric and inferior portions of the field (121,122). This age-related visual field sensitivity appears to be primarily due to neural loss rather than preretinal factors (123). Standard automated perimetry (SAP) protocols compensate for the effect of age by using age-bracketed databases.
Clarity of Ocular Media
Cataracts produce glare and change the intensity of the stimulus. Therefore, a cataract can cause or exaggerate central or peripheral field defects, which could be mistaken for the development or progression of glaucomatous field loss. Even minimal light scattering, as may be caused by an early cataract that has a relatively insignificant effect on visual acuity, may influence threshold measurements (124). As previously noted, this effect may be greater with lower levels of background illumination (112). Eyes with COAG and cataracts may have improvement of foveal sensitivity, visual field scores, and sometimes even a reversal of a partial or complete scotoma after cataract extraction (125–127). However, cataract surgery can also reveal mild and moderate field defects masked by cataracts (128,129). Nuclear cataracts depress central perimetric sensitivity more than peripheral sensitivity with both large and small targets, whereas nonnuclear cataracts influence central sensitivity more for small targets and peripheral sensitivity more for large targets (130). Attempts have been made to correlate visual field damage with lens opacity and visual acuity to aid clinicians in determining the significance of field change in patients with glaucoma and cataracts (131,132).
Reduced clarity of the ocular media from other causes, such as a corneal disturbance, a cloudy posterior lens capsule after cataract surgery, or vitreous opacities, may also affect the visual fields. Applanation tonometry before automated static threshold perimetry was found to have no detrimental effect on the visual field results (133).
Refractive Error and Retinal Blur
When the projected stimulus is not focused on the retina, the edge of the stimulus is blurred, contrast is decreased, and the stimulus may not be detected by the patient. The larger the stimulus, the less it is to be affected by the blur. Refractive errors primarily influence the central field (134). When a standard size III stimulus is used, refractive errors of 1 diopter (D) or less may not need to be corrected, because it usually will cause only slightly more than 1 dB of general reduction of sensitivity (135). Mild myopia requires no correction, unless the refractive error exceeds 3 D. Posterior staphylomas can create areas of relative myopia, called refraction scotomas, which may be confused with glaucomatous field defects, but can usually be eliminated with an appropriate refractive correction. Hyperopia has a greater influence on perimetric results, especially for the central field, and even small hyperopic refractive errors can significantly alter threshold sensitivity (134–136). Age tables are available to aid in determining the appropriate correction for presbyopia. A contact lens provides the best correction for the aphakic and highly myopic eyes (137), although spectacle correction can be used for the central 24 to 30 degrees with no correction for the peripheral field. Astigmatism should be corrected unless the cylinder is less than 1 D, in which case it can be included as the spherical equivalent.
Psychological Influences on Visual Fields
Patients’ understanding of the test and their alertness, concentration, fixation, and cooperation all affect the results of visual field testing (138). A learning effect with automated perimetry may influence the results of a patient’s first or second field test, suggesting that an initial field that does not agree with the clinical findings should be repeated (139–141). One study found that patients with refractive errors, especially those with myopia, had a larger learning effect than patients with emmetropia did (142). Another study found that moderate alcohol intake did not influence differential light sensitivity as tested by automated perimetry (143). With manual perimetry, the skill of the perimetrist influences the visual field test results (144).
Patient Fatigue
Full-threshold protocols take a long time to complete, and patients usually find visual field testing exhausting. Fatigue causes artificially decreased sensitivity in the areas of existent glaucomatous defect (145). Fatigue may also cause decreased performance in patients with glaucoma within central 10 degrees, and increased deterioration of the mean defect and localized loss in the periphery (146,147).
TECHNIQUES AND INSTRUMENTS FOR MEASURING THE FIELD OF VISION
Just as a cartographer maps the boundaries and topography of an island, so the perimetrist can measure both the peripheral limits of a visual field and the relative visual acuity of areas within those limits. This may be accomplished by using static or kinetic techniques with instruments that are computer assisted (automatic) or manually operated.
Automated Static Perimetry
Automated perimetry is accepted as the standard way of measuring the visual field. The standard protocol of static white-on-white stimuli is commonly known as SAP. A major limitation of tangent screens and arc perimeters (discussed later) was lack of standardization of the test objects and the background, and patient fixation. These needs were addressed in the era of standardization, which began in the middle of the 20th century with the contributions of Goldmann. The main problem that remained, however, was the subjectivity of the patient and the perimetrist. Although subjectivity of the patient has not been eliminated, the influence of the perimetrist was eliminated to variable degrees with the advent of automated perimetry in the 1970s. A wide variety of automated perimeters have been designed since then. Many of these are no longer commercially available, but current models represent modifications of the originals.
By reducing the influence of the perimetrist, automated perimetry improves the uniformity and reproducibility of visual fields. With these instruments, the perimetrist only ensures that the patient understands the testing procedure, is comfortably positioned at the perimeter, and adheres to the requirements of the test. In addition, the use of computers has provided new capabilities that are impossible with manual perimetry, including random presentation of targets, estimations of patient reliability, reduced variability, and statistical evaluation of data at many levels. With the recent introduction of efficient threshold strategies, automated perimetry is not only more accurate and informative but is also faster than manual perimetry.
Basic Components of Automated Perimeters
Automated perimeters have two main components: the perimetric unit and the control unit. The perimetric unit in most systems uses a bowl-type screen, similar to that of the Goldmann manual perimeter (discussed later).
The control unit provides interaction between the operator and the computer through a dialogue screen and a keyboard or light pen. The computer in the control unit provides and monitors instrumentation function according to the perimetrist’s request, evaluates the patient’s response, and processes data. The control unit also contains a printer, which provides a hard copy of the data in symbols and numeric values. Computers also store recorded information and can perform statistical analyses of the data in relation to the programmed normal database, or against previous fields for the same patient.
Static targets are used in most automated perimeters. Automated kinetic targets have also been evaluated and are provided on some automatic perimeters, although rarely used today, probably because of the high frequency of fixation errors and longer testing time (11–13,106,148,149). The targets may be projected onto the bowl, which is the current standard, or illuminated from light-emitting diodes (LEDs) or fiber optics in the perimetric bowl in earlier models. The former has the advantage of unlimited presentation locations on the screen, whereas the latter two have fixed positions in the bowl. In addition, the LEDs were recessed in dark cavities, which may allow perception by the most sensitive retinal areas of a stimulus that is of lower intensity than the background light (150,151). This “dark hole phenomenon” is associated with increased variability in retesting the threshold (150,151). Projected targets also have the advantage of allowing for change in size to alter the stimulus values. In practice, the size is usually kept constant, although larger targets may permit the measurement of visual function in areas that had been considered absolute scotomas with standard-sized stimuli (152). A larger target (size V stimulus) was found to be useful in patients with end-stage glaucoma (153). With all target systems, the patient usually presses a button to indicate when a target is seen, which is recorded by the computer.
The standard stimulus in most automated perimeters is a white light on a white background, which tests the patient’s differential light sense.
Commercial Units
The first of the full-threshold perimeters to receive extensive study was called the Octopus. With each Octopus model, stimuli are projected onto a bowl, and fixation is monitored by the corneal light reflex method and a television view of the patient’s eye. The models differ primarily according to computer capabilities. These automated perimeters were shown in early studies to compare favorably with manual perimetry and to frequently detect field loss missed with the Goldmann perimeter (154–156).
The Humphrey field analyzer and Humphrey field analyzer II also use projected stimuli on a bowl (Fig. 5.13). They monitor fixation by the Heijl–Krakau periodic blind spot check method and also by corneal light reflex in newer models. It is currently the most commonly used automated perimeter. It has also compared favorably with manual perimetry on the Goldmann perimeter, often detecting defects that the latter missed (157). In one study, however, patients preferred the Goldmann perimeter, whereas the technician favored the Humphrey (158). The Octopus and Humphrey units have been compared in several studies. In one study, both short- and long-term fluctuations (explained later) were greater with the Octopus (159). In another study, both automated perimeters identified slightly more defects by meridional threshold testing than the Tübingen manual perimeter did (160) (discussed later).
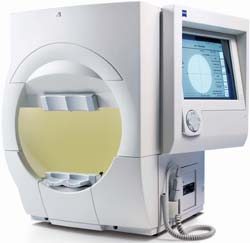
Figure 5.13 Humphrey Field Analyzer (HVAII). (Courtesy of Carl Zeiss Meditec, Inc.)
Stay updated, free articles. Join our Telegram channel

Full access? Get Clinical Tree


