Purpose
To investigate the retinal vascular findings and associated anatomic abnormalities in the central macula of eyes with diabetic retinopathy using volume-rendered angiographic and structural optical coherence tomography.
Study Design
Observational case series.
Methods
In this retrospective study 25 eyes of 14 consecutive patients were imaged with optical coherence tomography (OCT) using split-spectrum amplitude decorrelation. The structural OCT data were segmented for cystoid spaces and integrated into the angiographic data for subsequent volume rendering. The opacity of various vascular layers could be decreased to improve visualization of deeper structures and the images could be rotated about 3 axes. The inner and deep vascular plexus were analyzed in relation to structural changes such as cystoid spaces and disorganization of the retinal inner layers.
Results
Retinal vascular flow abnormalities manifested by large flow voids in the inner vascular layer with retention of large vessels and confluent areas of flow loss in the deep plexus. Areas of cystoid edema were associated with topographically colocalizing flow voids in the deep vascular layer. In eyes with no edema isolated abnormalities of the deep plexus were associated with thinning of the inner nuclear layer and abnormalities of both layers were associated uniformly with the OCT findings of disorganization of the retinal inner layers.
Conclusions
Widespread vascular abnormalities in diabetic retinopathy could be delineated along with the corresponding anatomic changes in the retina using volume-rendered angiographic and structural OCT. This method of imaging offers potential to improve visualization of vascular disorders of the eye.
According to the Centers for Disease Control’s 2014 National Diabetes Statistics Report 2014, 29.1 million people in the United States, 9.3% of the population, have diabetes and 27.8% of those, 8.1 million, are undiagnosed. Ocular complications of diabetes are the leading cause of blindness in working-age adults in the United States and around the world. Damage to the vascular system in the retina is the nexus of the disease processes leading to vision loss including blindness. Recognition of vascular changes in diabetic retinopathy started more than 100 years ago with the description of microaneurysms by Nettleship and our knowledge expanded with subsequent anatomic and pathophysiologic studies using human tissue and animal models. Standardized classification of disease laid the groundwork for epidemiologic studies and randomized trials. Integral to all of these studies has been fundus photography and fluorescein angiography as methods used to investigate the retinal vascular sequelae. Fundus photography is an inexpensive method to document retinal vascular changes in the inner retina, but has limited resolution of finer vessels such as capillaries. Fluorescein angiography requires an intravenous injection of dye, but is capable of imaging retinal vessels including capillaries.
A new vascular imaging method, optical coherence tomography angiography (OCTA), uses motion contrast to detect localized changes in reflectivity of tissue through its depth from one time instant to another separated by a short interval. Stationary tissue demonstrates little change in reflection, while moving particles, such as in blood flow, cause a varying reflection over time. By grading the change in reflection, estimates of regional blood flow can be realized through depths of tissue. In histologic studies of monkeys, Weinhaus and associates established that fluorescein angiography did not image the deeper vascular plexuses in the retina. Later investigation with OCTA showed that the same problem existed in humans. Therefore, many of the core concepts of diabetic retinopathy were established with fluorescein angiography, a modality that does not image important retinal vascular layers. With en face OCTA, various layers of the retina can be isolated through a process of image segmentation, and thereby the contained vessels can be imaged and evaluated. As part of en face image generation, the depth information within any given layer of the retina is flattened; thus the vascular interrelationships within that layer are lost.
A second significant problem with en face OCTA imaging is the need for segmentation. An important consequence of diabetic retinopathy, either through vascular loss or through resolution of macular edema, is derangement of the normal laminar structure of the retina. The recognition of the entity disorganization of the retinal inner layers by Sun and associates was an important development for the recognition of structural damage in spectral-domain optical coherence tomography (OCT) images of the retina in diabetes. Loss of the laminar structure also means that accurate segmentation of the retina for en face imaging is not possible because the layers no longer exist as identifiable structures. To overcome these difficulties a newer approach, volume-rendered OCTA, was developed. This method uses techniques similar to those used in computed tomography and magnetic resonance imaging to obtain 3-dimensional (3D) volumetrics to generate images of the retinal vasculature from OCTA data. These techniques do not require segmentation and retain the depth information present in the OCTA data set. A more complete realization integrates features derived from the structural OCT used to derive the angiographic data into the 3D volume of the vascular image and was called volume-rendered angiographic and structural optical coherence tomography. These new techniques offer opportunity to study vascular changes in relation to other abnormalities induced by diabetic retinopathy through the physical depth of the retina. Because the vascular changes related to diabetes, particularly those affecting the deep vascular plexus, are unknown, in particular in relation to structural changes such as cystoid spaces or disorganization of the retinal inner layers, a pilot study was undertaken to investigate using these newer imaging techniques in a series of diabetic eyes.
Methods
The patients evaluated in the study were seen in a community cased retinal referral practice of the author. This retrospective study was approved by the Western Institutional Review Board (Puyallup, Washington, USA) and complied with the Health Insurance Portability and Accountability Act of 1996. The patients imaged had diabetic retinopathy as established by previous examination. Eyes with media opacities, glaucoma, or history of tractional or rhegmatogenous macular detachment were excluded, as were eyes with a signal strength of 53 or less as supplied by the Optovue instrument or those who could not maintain fixation during the scanning process.
Optical Coherence Tomography Angiography
The instrument used for OCT angiography images is based on the Optovue RTVue XR Avanti (Optovue, Inc, Fremont, California, USA) to obtain amplitude decorrelation angiography images. This instrument has an A-scan rate of 70 000 scans per second, using a light source centered on 840 nm and a bandwidth of 45 nm. Each OCTA 3 × 3 mm volume contains 304 × 304 A-scans with 2 consecutive B-scans captured at each fixed position before proceeding to the next sampling location. Split-spectrum amplitude-decorrelation angiography was used to extract the OCT angiography information. Each OCTA volume is acquired in about 3 seconds and 2 orthogonal OCTA volumes were acquired in order to perform motion correction to minimize motion artifacts arising from microsaccades and fixation changes. The scanning procedure used in this study is identical to that used for typical en face imaging; the novel differences are how the data are evaluated after acquisition.
Extraction of Angiographic and Structural Information
The image processing techniques have previously been described. A curve was fit to the retinal pigment epithelial layer in the Optovue ReVue software (version 2014.2.0.93; Optovue, Inc). Successive slabs 8–9 μm thick above the curve through the thickness of the retina were exported from the software, in which, in addition to saving the angiographic image from that slice, the corresponding structural OCT image is also saved. The initialization file was modified to prevent the overprinting of the “Angio OCT” imprint on the resultant saved images. In the case of pseudocolor encoding of layers, the vascular layers were overlaid with color prior to volume rendering. The structural OCT images were segmented for a region of interest by simple thresholding techniques to select areas devoid of reflection corresponding to cystoid spaces in diabetic macular edema, or for areas of high reflectivity corresponding to intraretinal lipid, with cross correlation to the fundus photograph to ensure that no colocalizing intraretinal hemorrhages were present. Each plane of the image corresponded to 1 plane of angiographic data and 1 for the structural data. These 2 planes could be merged for use in the volume rendering. In actual practice, it was not necessary to actually merge the corresponding angiographic and structural data groups on a plane-by-plane basis if the vertical interplane resolution was reduced by a factor of 2. The OCT angiographic data were imported into the program MIPAV (Medical Image Processing, Analysis, and Visualization, version 7.1; US National Institutes of Health, Bethesda, Maryland, USA) for volume rendering. The opacity transfer and the look-up table functions were adjusted to improve visualization of the vasculature. The images shown are screen captures of the volume-rendered images.
Grading the Images
The structural OCTs used to derive the flow data were used to evaluate the presence of disorganization of the retinal inner layers in eyes with no current macular edema. Disorganization of the retinal inner layers was classified according to the original report and was thought to be present if any boundaries between the ganglion cell–inner plexiform layer complex, inner nuclear layer, and outer plexiform layer could not be identified. The number and designation of the retinal vascular layers is somewhat controversial, but for the purposes of this report the macula was considered to have 2 main layers, designated the inner and the outer vascular layers (with the term plexus being used synonymously with layer). Absence of flow data, which does not necessarily mean either the absence of associated vessels or a total absence of flow, were termed flow voids. An abnormality in either layer was thought to be present if there was a defect, excluding the expected foveal avascular zone greater than 250 μm in greatest linear dimension.
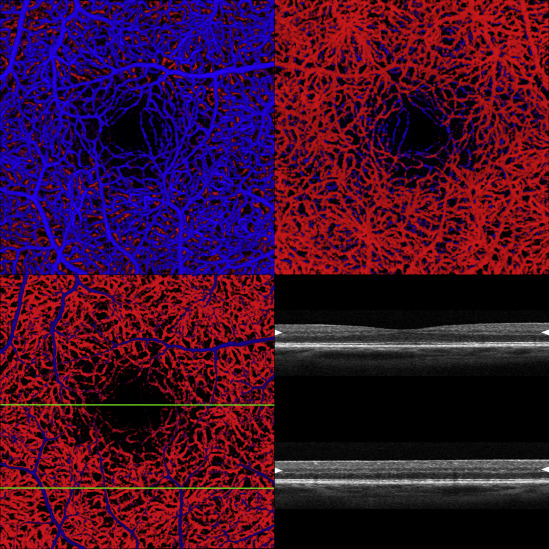
The inner retinal vascular layer invests the ganglion cell layer. The deep plexus is located external to the inner plexus and is formed by vessels that straddle the inner nuclear layer. To aid in visual separation of the layers the inner vascular layer was colored blue and the deep layer red ( Figure 1 ). Because of the vascular density of the inner vascular layer, the deep layer was not easy to evaluate. To visualize the outer vascular layer 2 main approaches were used. Since the data set (and the resultant volume-rendered image) can be rotated about 3 axes, the retina can be spun (typically about the vertical axis) and viewed from the bottom. This provides an unhindered view of the deep plexus, but the image is flipped left to right. A second approach is to reduce the opacity of the inner retinal vascular layer so that skeletons of the larger vessels are still present to help in orientation, but otherwise the deep plexus is easily seen. Each method has advantages in certain situations.
Results
There were 25 eyes of 14 patients, who had a mean age of 56.3 (standard deviation ± 17.8) years; 9 of the patients were male. The patients had diabetes for a mean of 20.8 (± 13) years. The mean visual acuity was logMAR 0.209 (20/32 Snellen equivalent). Intravitreous injection of anti–vascular endothelial growth factor (VEGF) injections had been given to 18 (72%) of the eyes and the mean number of injections among those eyes having received any injection was 10.2 (± 7.4). Of the 25 eyes, 13 eyes had diabetic macular edema at the time of imaging. The volume-rendered OCTA findings of those with and without edema will be presented separately in this report. Only 2 eyes had no history of diabetic macular edema or flow abnormalities, although both had microaneurysms.
Eyes With Diabetic Macular Edema
Of the 13 eyes (10 [76.9%] of which had a history of anti-VEGF injections) with diabetic macular edema, the cystoid spaces uniformly were located external to the inner retinal vascular layer. In 6 eyes there were flow abnormalities in the inner plexus, while in all eyes cystoid spaces were associated with flow abnormalities in the deep vascular plexus. These flow voids colocalized with the cystoid spaces in topographic location but did not necessarily have the same size ( Figure 2 ). Microaneurysms, more frequently located in the deep plexus, were often located near the cystoid spaces ( Figure 3 ). In eyes with more severe diabetic retinopathy there was a nearly complete absence of the deep plexus, with marked attenuation of the flow signal from the inner plexus, as evidenced by a lack of visible vessels ( Figure 4 ). One patient received 6 anti-VEGF injections for diabetic macular edema ( Figure 5 ). The edema was largely resolved but there was a persistent abnormality of the flow in the deep vascular plexus.
Eyes Without Diabetic Macular Edema
There were 12 eyes with no macular edema; 8 (66.7%) had a history of anti-VEGF injections and 9 (75.0%) had a history of laser photocoagulation outside of the area imaged for OCTA; 2 eyes did not have a history of edema. Flow abnormalities were seen in the inner vascular layer in 10 eyes and these same 10 had abnormalities in the deep vascular layer, although not necessarily in the same location. The abnormal areas were larger in the deep vascular layer than they were in the inner retinal layers ( Figures 6–8 ). An absence of flow signal from regions of the deep plexus was common, while in the inner layer larger retinal vessels were preserved. Disorganization of the retinal inner layers was found in all eyes with flow abnormalities ( Figures 6–8 ), but the manifestations showed subtle variations depending on the vascular layer affected ( Figure 6 ). Localized abnormalities of the deep plexus were associated with thinning of the inner nuclear layer ( Figure 7 ). Attenuation of the inner vascular layer with associated regional loss of the deep vascular plexus was associated not only with thinning and loss of the inner layers, but also with the difficulty in discerning differentiation of the inner nuclear layer from the inner or outer plexiform layer. Thus pronounced retinal perfusion problems were associated with inner and middle retinal disorganization ( Figure 8 ). At the borders of areas of poor perfusion from the deep plexus, some of the vessels of the deep plexus were seen to anastomose with the inner plexus ( Figure 9 ). At some of these connections microaneurysms were present, although for the most part microaneurysms were randomly scattered in both the inner and outer vascular layers.


