Purpose
To validate the use of concentric rings as a method to measure topographic area of retinal nonperfusion in ultra-widefield angiography with the ischemic index method, which is the most frequently used method to measure nonperfusion in ultra-widefield angiography.
Design
Validation study and reliability analysis.
Methods
setting : Single-center study performed at National Institute for Health Research Moorfields Biomedical Research Centre, London, United Kingdom. study population : Twenty-eight ultra-widefield angiogram images of eyes with central retinal vein occlusion. observation procedure : The concentric rings method consists of 6 macula-centered concentric rings divided into 12 segments each. Each image was graded by 5 graders using both the concentric rings and the ischemic index methods. main outcome measures : Agreement between the 2 methods was calculated using the intraclass correlation coefficient. Intertest agreement, intergrader agreement, test-retest reliability, and the time taken to grade using these 2 methods were compared.
Results
The intertest agreement between concentric rings method and ischemic index method was 0.965. The intergrader agreement was 0.910 for the concentric rings method and 0.898 with the ischemic index method. The test-retest reliability was 0.975 for the rings and 0.979 for the ischemic index. Average grading time per image was 187 s and 297 s for the concentric rings method and ischemic index method, respectively, P < .001.
Conclusion
The concentric rings method has an “almost-perfect” intergrader agreement and intertest agreement with the ischemic index method, with a shorter grading time.
Fundus fluorescein angiography (FA) remains the gold-standard imaging tool for the measurement of retinal perfusion status in retinal vascular diseases. Previous seminal research papers such as the Early Treatment Diabetic Retinopathy Study and the Central Vein Occlusion Study classified retinal perfusion status based on the montage of overlapping 7-field FA images. However, 7-field imaging only allows visualization of approximately a third of the retinal surface area. The acquisition of these 7-field images are also technically challenging and requires well-trained photographers, well-dilated pupils, and good patient cooperation to undergo multiple flash photography. Furthermore, a single 7-field montage image is formed of images acquired at different FA phases. These limitations have been overcome by the introduction of ultra-widefield imaging. Ultra-widefield imaging has a shorter image capture time and allows visualization of significantly larger areas of the retina using less number of images compared to the conventional 7-field imaging. For example, ultra-widefield image obtained by Optos Plc (Dunfermline, Scotland, UK) covers approximately a 200 degree field of view in a single image compared to the 30–50 degree conventional fundus cameras and is now regularly used in clinical practice.
The conventional measurement of nonperfusion in 7-field FA is in total number of disc areas. The SCORE study group applied a grid consisting of 4 concentric circles with 9 subfields over the macula to better quantify the percentage involvement of capillary loss, blood, edema, and fluorescein leakage in each subfield and the results were converted to disc areas. With the advent of ultra-widefield imaging, an ischemic index method has been developed to quantity nonperfusion by taking into account the much larger retinal area visualized. In brief, the ischemic index method is measured as a perfused ratio or percentage of the total area of perfused retina to the total area assessed by manually delineating the boundaries of the retina that are in focus and also the perfused retina. Other investigators have quantified the total area of nonperfusion by manual or software-assisted delineation of the nonperfused boundaries without taking into account the total area visualized and reported the area of nonperfusion in pixels or as total disc areas. Marking the boundaries of nonperfusion is a labor-intensive exercise and may be subject to variability. Although there has been a significant increase in the use of the ischemic index method, the intergrader agreement of the ischemic index method has not been formally reported. However, Wessel and associates have reported a Lin correlation coefficient of >0.80 for measurement of areas of ischemia in ultra-widefield FA by manually delineating the boundaries of nonperfused retina, and this represents an almost-perfect agreement.
The drawback of the ischemic index method is that this measurement only provides a quantification of the total area of nonperfusion and does not give a topographic representation of the location of ischemia.
We believe the introduction of concentric rings similar to that used in the SCORE study will better quantify the area of peripheral retinal nonperfusion in ultra-widefield FA images and enable us to qualify the location of ischemia. The concept of superimposing grids and templates to assess FA images is not a novel method. Templates have also been used to assess macular nonperfusion, peripheral changes in age-related macular degeneration, and retinal nonperfusion using the Manchester grid.
The objective of our study is to assess the feasibility of measuring nonperfusion in ultra-widefield FA, using a template of concentric rings centered on the fovea. We assessed (1) the agreement between this newly proposed method with the ischemic index method, (2) the intergrader agreement, (3) the test-retest reliability, and (4) the time taken to grade nonperfusion using both methods.
Methods
This validation study and reliability analysis was performed in the National Institute for Health Research Moorfields Biomedical Research Centre and the Institute of Ophthalmology, University College London, United Kingdom. Approval for retrospective anonymized image analysis from the institutional review board of Moorfields Eye Hospital was obtained and the study was conducted in accordance with the tenets of the Declaration of Helsinki.
Image Acquisition
The ultra-widefield FA images of consecutive patients with a diagnosis of central retinal vein occlusion that were imaged with the Optos 200TX (Optos Plc, Dunfermline, Scotland) ultra-widefield system were reviewed. Only images that were acquired according to local Optos FA protocol and were not obscured by media opacities were included. The images also had to be of sufficient clarity, defined as the ability to clearly discern perfused from nonperfused capillaries. Patients with previous panretinal photocoagulation treatment were excluded. Ultra-widefield FA images were obtained using a standard protocol after intravenous bolus infusion of 5 mL of 20% fluorescein sodium. The protocol consisted of acquiring images in transit phase (up to 45 s), arteriovenous phase (1–2 min), and late frames at 3–4 minutes and 7–8 minutes. A single investigator (L.N.) identified the best FA image in the arteriovenous phase from the FA series of each patient. A correction factor was applied for the flattening of the 3-dimensional image to a 2-dimensional image using a noncommercial research tool under development by Optos.
The Concentric Rings Method
Development and description of the template of concentric rings
The concentric rings method consists of 7 fovea-centered concentric circles ( Figure 1 ). The innermost circle is centered on the fovea and is 1 disc diameter. This area is not used in the grading method, as the foveal avascular zone is excluded from grading. The second circle represents the macular ring with a radius of 2.5 disc diameters centered on the fovea. Each of the next 5 subsequent rings are placed at increments of 2.5 disc diameters in radius from the foveal center; therefore, the radii of these inner, inner middle, outer middle, outer, and far outer peripheral rings are 5 disc diameters, 7.5 disc diameters, 10 disc diameters, 12.5 disc diameters, and 15 disc diameters from the center. This results in the diameter of each ring increasing by 5 disc diameters with the central macular ring also being 5 disc diameters in diameter. Each of these rings is further subdivided into 12 equal segments with each segment subtending 30 degrees at the center.
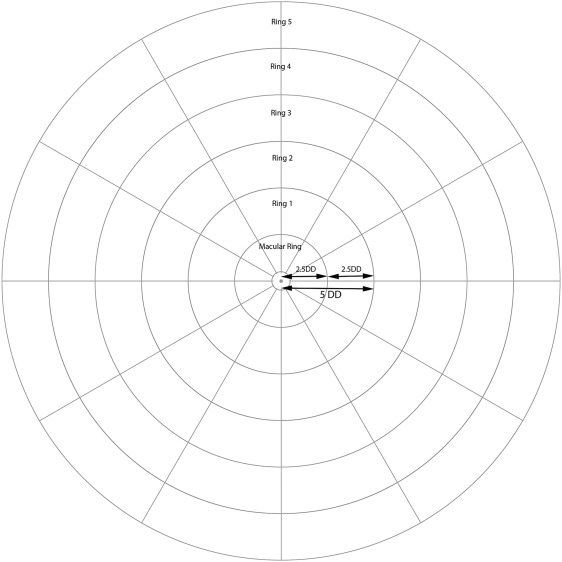
We applied a mathematical formula with the assumption that the mean axial length is 24 mm to calculate the size of the concentric rings. We excluded 2 mm from this to account for the cornea and part of the anterior chamber. In our model eye, the radius is 11 mm (22 mm in diameter), and therefore the full circumference would be 69.1 mm (π = 3.142). Optos is able to image up to 200 degrees of the retina and we used this to calculate the average diameter of retina obtained in a single central image; this was calculated to be 38.4 mm. Using the disc diameter as 1.8 mm, this would mean that the diameter of the central image will be 21.3 disc diameters. A diameter of 21.3 disc diameters will result in the need for a macular + 3 further rings with some involvement of the fourth ring. Taking into account future applications such as steering protocols, we made the assumption of gaze to be 45 degrees in each direction. This would mean that the total diameter potentially imaged is 290 degrees (200 + 45 + 45). This would then result in a total diameter of 55.7 mm, which equates to 30.9 disc diameters; thus, 6 rings (macular + 5 rings) are required on average.
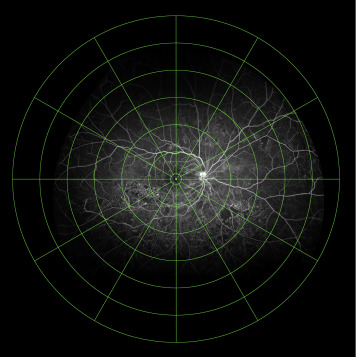
The rings were then superimposed on each of the selected ultra-widefield FA images using Photoshop CS4 (Adobe Inc, San Jose, California, USA). As optic disc size varies between individuals, the innermost circle is first placed at the optic disc to individualize the disc area and the concentric rings are then sized proportionately. Once completed, the rings were then repositioned to be fovea centered ( Figure 2 ). The concentric rings template is provided as a Supplemental Figure (available at AJO.com ) and is available to use with appropriate citation.
Grading
The images were graded using ImageJ, an open source software by the National Institutes of Health (NIH) that can be downloaded at http://imagej.nih.gov/ij/index.html . Using the software, each grader can adjust the brightness, contrast, and magnification to assist in grading. The definition of “nonperfusion” was adopted from the SCORE study, and is characterized by absence of retinal arterioles and/or capillaries and is detected by characteristics such as pruned appearance of adjacent arterioles and a darker appearance of the choroid. The corresponding color fundus image was provided so that blocked fluorescence from retinal hemorrhages is not misjudged as ischemia. “Perfused” retina was defined by its ground-glass appearance and “ungradable” areas were defined as areas where no clear definition of presence or absence of perfusion could be identified; this includes retinal vasculature not in focus and exclusion of “blurred” areas in the periphery.
The 12 segments in each of the 6 rings totaling 72 segments were graded as 1 of 3 outcomes, “perfused,” “nonperfused,” or “ungradable,” if more than 50% of the segment consisted of any 1 of the 3. If these outcomes are in equal proportion in a segment, the segment is classified as ungradable. The grading results for each image were recorded ( Table 1 ). This also allowed a qualitative result of the distribution of ischemia by inputting a subscript of the number of segments judged to be nonperfused in each segment. The first ring is the macula, M, and subsequent rings are numbered 1–5. An example of a recording is M 2 1 1 2 0 3 4 4 7 5 5 .
| Nonperfused (Number of Segments) | Perfused (Number of Segments) | Ungradable (Number of Segments) | |
|---|---|---|---|
| Macula (Ring 0) | 2 | 10 | 0 |
| Ring 1 | 1 | 11 | 0 |
| Ring 2 | 0 | 12 | 0 |
| Ring 3 | 4 | 8 | 0 |
| Ring 4 | 7 | 4 | 1 |
| Ring 5 | 5 | 5 | 2 |
| Total | 19 | 50 | 3 |
This grading can also be converted to a ratio of perfused to total area assessed to resemble the ischemic index, as exemplified by Table 2 , which shows the total area in disc areas represented by each segment in each ring.
| Area per Segment (in Disc Areas) | |
|---|---|
| Macula (Ring 0) | 2 |
| Ring 1 | 6.25 |
| Ring 2 | 10.42 |
| Ring 3 | 14.58 |
| Ring 4 | 18.75 |
| Ring 5 | 22.92 |
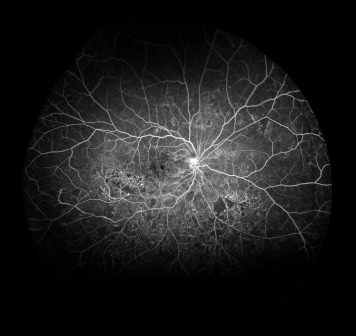
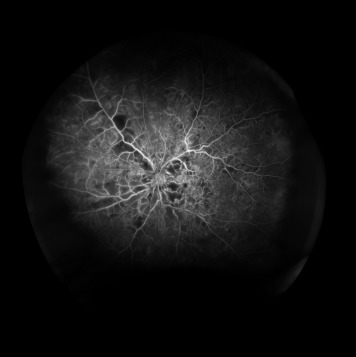
Although the perfused ratio allows the comparison with ischemic index, the examples given ( Figures 3 and 4 ) show why the concentric rings method provides more useful information than the ischemic index method. Both Figure 3 and Figure 4 have similar perfused ratios, but the location of ischemia is dissimilar. With the concentric rings, the additional notation M 0 1 0 2 1 3 3 4 0 5 0 and M 2 1 5 2 3 3 0 4 0 5 0 allows one to picture the distribution of retinal nonperfusion.
The time taken from opening an image file to completion of the information in the format shown in Table 1 was defined as the time required to grade the images; this information was recorded.
The Ischemic Index Method
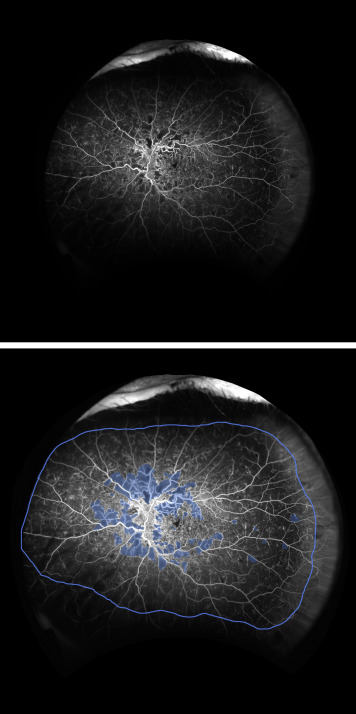
The ischemic index method has been described previously. It reports ischemia as a ratio of the total area perfused to the total area assessed or gradable ( Figure 5 ). Images were graded using ImageJ. The total area gradable was defined as total area whereby the grader was able to grade the presence or absence of perfusion, which includes retinal vasculature in focus and exclusion of “blurred” areas in the periphery. The definitions for perfusion and nonperfusion are similar to those used in the concentric rings method. The ischemic index method is reported in a ratio and no units are used. To quantify areas of nonperfusion, in this study, the total number of pixels for the area of nonperfusion is divided by the number of pixels in the “disc circle” in the concentric rings method to obtain a unit of disc areas.
Stay updated, free articles. Join our Telegram channel

Full access? Get Clinical Tree


