Purpose
To understand the long-term characteristics of visual field (VF) progression in myopic open-angle glaucoma (OAG) according to the morphology of optic disc tilt.
Design
Retrospective, comparative, longitudinal cohort study.
Methods
Myopic OAG eyes were divided into temporally tilted disc and inferiorly tilted disc groups according to optic disc torsional degrees. Kaplan-Meier survival analysis was used to compare the survival rates between nonmyopic OAG, myopic OAG with temporally tilted disc, and myopic OAG with inferiorly tilted disc. The hazard ratio (HRs) for the associations between risk factors and progression were analyzed using Cox proportional hazards modeling. In the inferiorly tilted disc group, subgroups were classified into progression, stationary, and progression-to-stationary groups, and the clinical characteristics of VF progression were compared among the subgroups.
Results
A total of 82 eyes in 82 nonmyopic OAG patients and 150 eyes in 150 myopic OAG patients were included. Myopic OAG with inferiorly tilted disc showed significantly more baseline and final 1-hemifield-involvement cases compared with myopic OAG with temporally tilted disc ( P < .001, P < .001, respectively). The cumulative probability of progression was shown to be faster for myopic OAG with inferiorly tilted disc compared with temporally tilted disc and nonmyopic OAG ( P = .002, P = .038, respectively). A larger number of medications (HR = 1.339; P = .004), earlier-stage VF defect (HR = 1.217; P < .001), and inferiorly tilted disc (HR = 2.378; P < .001) were predictive of progression. In the analysis of myopic OAG with inferiorly tilted disc, the progression group had younger age and earlier-stage VF defect at baseline compared with the stationary group ( P = .01, P < .001, respectively).
Conclusions
It is likely that VF progression in myopic OAG is associated with the morphology of the optic disc tilt. Especially in OAG with inferiorly tilted disc, VF is likely not to progress after terminating VF progression at the region associated with optic disc tilt.
Myopia is thought to be a risk factor of glaucoma development. However, the association between myopia and glaucomatous progression remains controversial. Several studies have suggested that myopia is not associated with glaucoma progression. Because of the conflicting clinical reports, myopia has been considered as a risk factor but, on the other hand, also considered as part of the differential diagnosis.
Myopia usually accompanies characteristic morphologies including optic disc tilt and β-zone peripapillary atrophy (PPA). In glaucomatous eyes, relationships between myopia-related features such as optic disc tilt or β-zone PPA and glaucoma have been reported. In prior studies, myopic glaucoma showed corresponding damage in the direction of optic disc tilt and β-zone PPA, and asymmetrical optic nerve head (ONH) deformation with axial myopic elongation was suggested as the reason for accordance between visual field (VF) defect and optic disc tilt or β-zone PPA.
In the present study, we speculated that myopia-related features such as optic disc tilt may lead to different VF progression patterns in myopic open-angle glaucoma (OAG). The purpose of this study was to compare global VF progression rate and characteristic VF progression patterns in myopic OAG according to optic disc tilt. For this purpose, we included nonmyopic and myopic OAG patients who underwent long-term observation. We divided myopic OAG patients into 2 subtypes of myopic OAG with temporally tilted disc and myopic OAG with inferiorly tilted disc on the basis of optic disc torsional degrees. Then we compared VF characteristics including progression rate and pattern among the groups. In addition, the factors associated with VF progression in the included OAG patients were investigated.
Methods
Subjects
This was a retrospective longitudinal study. Candidates of this study were patients with OAG in eyes both with and without myopia, who initially visited Samsung Medical Center (Seoul, South Korea) between January 2000 and December 2008. OAG eyes with more than 7 years of follow-up and that had been subjected to more than 9 VF tests were included. This study followed all guidelines for experimental investigation in human subjects, was approved by the Samsung Medical Center Institutional Review Board, and adhered to the tenets of the Declaration of Helsinki.
Participants underwent a comprehensive ophthalmic assessment, including slit-lamp biomicroscopy, Goldmann applanation tonometry, manifest refraction, gonioscopic examination, dilated stereoscopic examination of the ONH and color fundus photography, automated perimetry using the central 30-2 Humphrey Field Analyzer (HFA model 640 or model 740; Humphrey Instruments Inc, San Leandro, California, USA), axial length (AL) measurement (IOLMaster; Carl Zeiss Meditec Inc, Dublin, California, USA), and ultrasound pachymetry (Tomey SP-3000; Tomey Ltd, Nagoya, Japan). The extent of VF defect was measured using mean deviation (MD), pattern standard deviation (PSD), and visual field index (VFI). Reliable VF analysis was defined as a false-negative rate <15%, a false-positive rate <15%, and fixation loss <20%.
Intraocular pressure (IOP) at baseline was defined as the average IOP of 2 consecutive visits in the absence of IOP medication. In patients using IOP medications, IOP was measured 1 month after discontinuing the medications. The average value of IOP medications during the observation period was used as the number of IOP medications.
To be classified as myopia, eyes had to have a spherical equivalent (SE) less than −2.00 diopters and an AL greater than 24.0 mm. Exclusion criteria included eyes with media opacities, such as a corneal opacity, cataract, or vitreous opacity; systemic disease or ocular disease that can affect VF tests; and baseline MD of −20 dB or less, for which glaucoma progression would be difficult to evaluate on VF test. One eye in each patient was randomly selected for inclusion in the study.
Measurement of the Parameters Related to Optic Disc Tilt and Peripapillary Atrophy
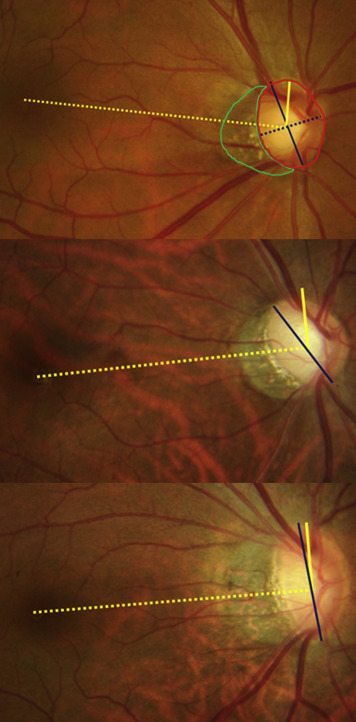
Color fundus photography (Topcon, Paramus, New Jersey, USA) was obtained for measurements of the optic disc and β-zone PPA. The photographs were acquired after dilation of the pupil. Images were evaluated by 2 investigators (J.C.H. and E.J.L.) in a masked fashion using ImageJ software (version 1.52; National Institutes of Health, Bethesda, Maryland, USA). The averages of the 2 investigators were used in the final analysis. Disc ovality index was defined as the ratio between the longest and shortest diameters of the optic disc. Optic disc torsion was defined as the deviation of the long axis of the optic disc from the vertical meridian. The vertical meridian was defined as the vertical line 90 degrees from the line that connects the fovea and the center of the optic disc. The presence of β-zone PPA was defined as the region of chorioretinal atrophy with both visible sclera and choroidal vessels adjacent to the optic disc. The areas of β-zone PPA were measured by ImageJ. In the present study, β-zone PPA–to–disc area ratio was used instead of β-zone PPA to minimize the effect of photographic magnification error . When the disc torsional angle was greater than 15 degrees, the case was categorized as inferiorly tilted disc. If this angle was less than 15 degrees, the case was categorized as temporally tilted disc ( Figures 1 ).
Definitions of Open-Angle Glaucoma and Visual Field Progression
The following criteria were required for the diagnosis of OAG. First, glaucomatous optic disc changes such as increased cupping (vertical cup-to-disc ratio >0.7), diffuse or focal neural rim thinning, disc hemorrhage, or retinal nerve fiber layer (RNFL) defects had to be present at the time of diagnosis. Second, glaucomatous VF defects positive for at least 2 of the following criteria were required to have been present during more than 1 reliable test: (1) a cluster of 3 points with a probability less than 5% on the pattern deviation map in at least 1 hemifield, including at least 1 point with a probability less than 1% or a cluster of 2 points with a probability less than 1%; (2) a glaucoma hemifield test result outside the normal limits; or (3) a pattern standard deviation of 95% outside the normal limits. Third, an open angle on gonioscopic examination must have been confirmed with no identified cause of secondary glaucoma present.
Progression of glaucomatous VF was defined using Glaucoma Progression Analysis (GPA; Carl Zeiss Meditec Inc) software, which supplies both event-based and trend-based progression analyses. In the event-based analysis, results were regarded as significant ( P < .05) when deterioration was evident on the pattern deviation probability maps at the same 3 or more points on 2 consecutive follow-up tests, and the GPA flagged it as “possible progression.” If significant deterioration was seen at the same 3 or more points in 3 consecutive follow-up tests, the GPA flagged this as “likely progression.” When the VF defect did not adhere to the above, the software flagged “no progression detected.” “Possible progression” and “likely progression” were considered as VF progression. On trend-based analysis, GPA software provides the slope of the change in VFI with respect to time. The VFI is the aggregate percentage of visual function of the eye determined through a linear regression model. The global progression rates were measured using VFI in trend-based analyses.
VF progression patterns such as 1-hemifield-involvement cases and dominant VF defect direction were investigated. A 1-hemifield-involvement case was defined when the glaucomatous VF defect was found in only 1 hemifield. To determine the dominant VF defect direction at the final examination, eyes with more advanced defects in the superior hemifield were classified as superior-dominant defects, and eyes with more severe defects in the inferior hemifield were classified as inferior-dominant defects.
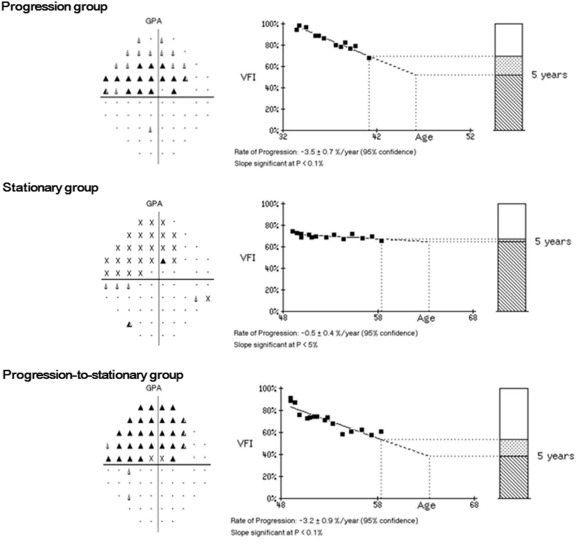
Because we speculated that more asymmetric ONH deformation could induce larger optic disc torsional angle, as reported in previous studies, we compared factors among VF progression pattern groups in myopic OAG with inferiorly tilted disc (larger torsional angle than temporally tilted disc). The VF progression patterns were divided into stationary, progression, and progression-to-stationary groups according to presence of VF progression during the observation period. The progression-to-stationary group was defined as initial progression without further progression for at least 5 VF examinations during the last 3 years of the observation period ( Figure 2 ).
Data Analysis
Intraobserver (2 consecutive measurements by J.C.H.) and interobserver (measured by J.C.H. and Y.K.K.) reproducibility were assessed by calculation of intraclass correlation coefficients (ICCs). Twenty randomly selected fundus photographs and optical coherence tomography images were used for the analysis. Independent t test or Mann-Whitney U test was used to compare variables between nonmyopic OAG and myopic OAG after data normality was assessed. The χ 2 test was used to compare categorical data. Continuous variables were expressed as mean ± standard deviation (range). Kruskal-Wallis test and Tukey post hoc analysis were employed for the comparison among nonmyopic OAG, myopic OAG with temporally tilted disc, and myopic OAG with inferiorly tilted disc. Kaplan-Meier analysis and the log-rank test were used to compare survival experiences (time-to-progression event) between nonmyopic OAG and myopic OAG, and we also compared the survival experiences among nonmyopic OAG, myopic OAG with temporally tilted disc, and myopic OAG with inferiorly tilted disc. The hazard ratios (HRs) for the associations between potential risk factors and glaucomatous progression were determined using Cox proportional hazards modeling. Univariate analysis was performed for each factor. Factors with P < .2 on univariate analysis were included in the multivariate Cox proportional hazards model. A backward elimination was used to develop the final multivariate model, and adjusted HRs with 95% confidence intervals (CIs) were calculated.
In myopic OAG with inferiorly tilted disc, when VF progression pattern was classified into progression, stationary, and progression-to-stationary, Kruskal-Wallis test and Tukey post hoc analysis were used to analyze the factors among the 3 characteristic VF progression patterns. The χ 2 test was used to compare categorical data. All statistical analyses were performed with SPSS software version 18.0 (SPSS, Inc, Chicago, Illinois, USA). A P value less than .05 was considered statistically significant.
Results
Intraobserver intraclass correlation coefficient values for optic disc ovality index, optic disc torsional degree, and PPA-to–disc area ratio were 0.934, 0.954, and 0.923, respectively. Interobserver intraclass correlation coefficient values were 0.905, 0.911, and 0.903, respectively. A total of 82 eyes in 82 nonmyopic OAG patients and 150 eyes in 150 myopic OAG patients were included in this study. No differences were observed in age, sex, or systemic factors (including diabetes mellitus and hypertension status) between the 2 groups. Ocular factors such as baseline and average IOP, number of IOP medications, and central corneal thickness (CCT) showed no difference between the 2 groups. However, myopic OAG showed significantly more negative SE, longer axial length, larger disc ovality index, larger disc torsional angle, and larger PPA-to–disc area ratio compared with nonmyopic OAG ( Table 1 ).
| OAG Without Myopia (N = 82) | OAG With Myopia (N = 150) | P Value | |
|---|---|---|---|
| Age at initial visit (y) | 46.0 ± 11.4 (22–72) | 45.6 ± 12.0 (22–82) | .61 |
| Female, n (%) | 35 (42.7%) | 61 (40.7%) | .78 |
| Systemic factors | |||
| Diabetes mellitus, n (%) | 7 (8.5%) | 8 (5.3%) | .41 |
| Hypertension, n (%) | 16 (19.5%) | 13 (8.7%) | .02* |
| Ocular factors | |||
| Baseline IOP (mm Hg) | 17.3 ± 2.9 (8–26) | 17.2 ± 2.5 (10–25) | .63 |
| Mean follow-up IOP (mm Hg) | 14.2 ± 2.3 (8–19) | 15.0 ± 2.6 (10–22) | .20 |
| Average number of IOP medications | 1.5 ± 0.7 (0–3) | 1.3 ± 0.8 (0–3) | .07 |
| Spherical equivalent (D) | −1.2 ± 2.3 (−2.0 to 2.5) | −4.5 ± 2.7 (−9.8 to −2.1) | <.001* |
| Axial length (mm) | 24.2 ± 1.0 (21.3–24.5) | 25.9 ± 1.4 (24.2–29.5) | <.001* |
| CCT (μm) | 520.5 ± 37.0 (437–587) | 527.2 ± 32.3 (458–614) | .18 |
| Optic disc parameters | |||
| Optic disc ovality index | 1.0 ± 0.1 (1.0–1.2) | 1.4 ± 0.1 (1.1–1.8) | <.001* |
| Optic disc torsional angle (degrees) | 5.5 ± 22.4 (−24 to 11) | 23.7 ± 28.0 (−31 to 77) | <.001* |
| PPA-to–disc area ratio | 0.1 ± 0.1 (0–0.4) | 0.5 ± 0.3 (0.1–1.5) | <.001* |
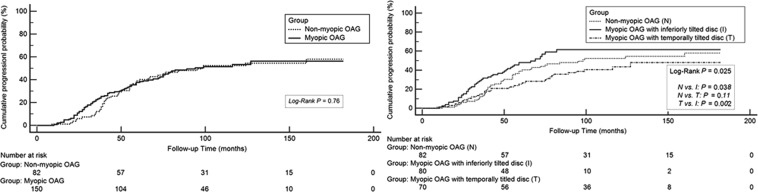
In myopic OAG eyes, 70 eyes were classified as temporally tilted disc and 80 eyes were classified as inferiorly tilted disc. The follow-up period was 10.0 ± 2.4 years in nonmyopic OAG and 9.8 ± 2.7 years in myopic OAG. The average number of VF tests was 12.1 ± 3.1 in nonmyopic OAG and 12.7 ± 2.8 in myopic OAG. No differences were found in baseline and final MD between nonmyopic and myopic OAG, but PSD was larger in myopic OAG than in nonmyopic OAG at baseline and at the final visit ( P = .02, P = .002, respectively). No differences in number of VF progression cases and VF progression rates during the observation period were shown between nonmyopic and myopic OAG. VF in myopic OAG showed a greater proportion of 1-hemifield-involvement cases than were noted in nonmyopic OAG at baseline and final examinations ( P = .02, P < .001, respectively). Superior dominant VF defect cases were greater in myopic OAG than in nonmyopic OAG (88.7% vs 73.2%; P = .003). When myopic OAGs were classified into myopic OAG with temporally tilted disc and with inferiorly tilted disc, no difference in MD and PSD at baseline or final examination was found between the 2 groups. Progression cases and rates between 2 groups demonstrated no significant differences. However, the number of 1-hemifield-involvement cases in myopic OAG with inferiorly tilted disc was greater than in those with temporally tilted disc at baseline and final visit ( P < .001, P < .001, respectively). All myopic OAG with inferiorly tilted disc had superior-dominant VF defects, whereas nonmyopic OAG and myopic OAG with temporally tilted disc showed superior-dominant VF defects in 73.2% and 74.3% of cases, respectively ( P < .001, P < .001) ( Table 2 ). No difference in cumulative probability of progression was found between nonmyopic and myopic OAG ( P = .76). However, when myopic OAG was classified into myopic OAG with temporally or inferiorly tilted disc, a higher cumulative probability of progression was observed in myopic OAG with inferiorly tilted disc than was noted in nonmyopic OAG ( P = .038) or myopic OAG with temporally tilted disc ( P = .002). No significant difference in cumulative probability of progression was found between myopic OAG with temporally tilted disc and nonmyopic OAG ( P = .11) ( Figure 3 ). A larger number of IOP medications and less severe baseline MD were found to be significantly predictive of progression on univariate Cox proportional hazards analysis ( P = .011, P < .001, respectively). On multivariate analysis, larger number of IOP medications, less severe baseline MD, and inferiorly tilted disc were found to be significantly associated with VF progression in OAG ( P = .004, P < .001, P < .001, respectively) ( Table 3 ).
| Parameters | Nonmyopic OAG (A) (N = 82) | Myopic OAG (N = 150) | P Value | Post Hoc Analysis (A, C, and D) | |||||
|---|---|---|---|---|---|---|---|---|---|
| With All Types of Tilted Disc (B) (N = 150) | With Temporally Tilted Disc (C) (N = 70) | With Inferiorly Tilted Disc (D) (N = 80) | A–B a | A, C, and D b | A–C c | A–D c | C–D c | ||
| Follow-up period (y) | 10.0 ± 2.4 (7–15) | 9.8 ± 2.7 (7–15) | 10.1 ± 2.9 (7–15) | 9.5 ± 2.4 (7–15) | .66 | .54 | .69 | .30 | .18 |
| Number of VF tests | 12.1 ± 3.1 (10–17) | 12.7 ± 2.8 (10–21) | 13.2 ± 3.0 (10–18) | 12.3 ± 2.9 (10–21) | .71 | .62 | .23 | .87 | .41 |
| MD, baseline (dB) | −5.8 ± 4.1 (−15.8 to −0.5) | −6.4 ± 4.1 (−17.4 to −0.5) | −5.9 ± 3.9 (−16.9 to −0.5) | −6.8 ± 4.3 (−17.4 to −0.7) | .33 | .55 | .92 | .14 | .18 |
| MD, final (dB) | −9.2 ± 5.0 (−19.6 to −0.6) | −9.0 ± 3.8 (−19.1 to −0.5) | −8.8 ± 3.6 (−17.8 to −0.5) | −9.1 ± 4.1 (−19.1 to −2.5) | .73 | .81 | .62 | .92 | .67 |
| PSD, baseline (dB) | 8.1 ± 4.7 (1.4–17.3) | 9.6 ± 4.6 (1.4–18.6) | 9.6 ± 4.6 (1.8–18.6) | 9.6 ± 4.6 (1.4–17.9) | .02* | .045* | .04* | .04* | .93 |
| PSD, final (dB) | 10.8 ± 4.3 (2.6–19.2) | 12.5 ± 3.7 (4.4–19.3) | 12.5 ± 3.6 (4.7–18.1) | 12.5 ± 3.7 (6.4–19.3) | .002* | .005* | .01* | .01* | .97 |
| VFI, baseline (%) | 84.5 ± 12.9 (51–98) | 81.3 ± 13.3 (48–99) | 83.1 ± 13.0 (48–99) | 79.6 ± 13.3 (50–99) | .08 | .13 | .51 | .06 | .11 |
| VFI, final (%) | 72.0 ± 15.5 (32–96) | 72.2 ± 13.1 (32–94) | 74.1 ± 12.1 (47–94) | 70.5 ± 13.8 (32–91) | .94 | .43 | .36 | .51 | .09 |
| Progression cases, n (%) | 44 (53.7%) | 77 (51.3%) | 33 (47.1%) | 44 (55.0%) | .78 | .16 | .52 | .88 | .41 |
| Progression rate (%/y) | −1.3 ± 1.3 (−5.1 to 0.3) | −1.1 ± 1.3 (−6.3 to 1.0) | −1.1 ± 1.3 (−5.8 to 0.4) | −1.1 ± 1.3 (−6.3 to 1.0) | .27 | .22 | .29 | .40 | .79 |
| One-hemifield involvement, baseline, n (%) | 58 (70.7%) | 127 (84.7%) | 48 (68.6%) | 79 (98.8%) | .02* | <.001* | .86 | <.001* | <.001* |
| One-hemifield involvement, final, n (%) | 44 (53.7%) | 117 (78.0%) | 43 (61.4%) | 74 (92.5%) | <.001* | <.001* | .42 | <.001* | <.001* |
| Superior dominant VF defect cases, final, n (%) | 60 (73.2%) | 133 (88.7%) | 53 (74.3%) | 80 (100%) | .003* | <.001* | .85 | <.001* | <.001* |
a Independent t test or Mann-Whitney U test.
c Multiple comparisons were performed using Tukey post hoc analysis.
| Variable | Univariate Analysis | Multivariate Analysis | ||||
|---|---|---|---|---|---|---|
| HR | 95% CI | P Value | HR | 95% CI | P Value | |
| Age at initial visit (y) | 1.002 | 0.988–1.016 | .812 | |||
| Central corneal thickness (μm) | 1.003 | 0.998–1.008 | .275 | |||
| Spherical equivalent (D) | 0.955 | 0.900–1.014 | .134 | 1.002 | 0.997–1.007 | .515 |
| Axial length (mm) | 1.081 | 0.958–1.220 | .208 | |||
| Baseline IOP (mm Hg) | 1.016 | 0.967–1.067 | .541 | |||
| Mean follow-up IOP (mm Hg) | 1.012 | 0.985–1.027 | .651 | |||
| Number of medications | 1.346 | 1.070–1.692 | .011* | 1.339 | 1.112–1.761 | .004* |
| Baseline mean deviation (dB) | 1.189 | 1.128–1.255 | <.001* | 1.217 | 1.151–1.287 | <.001* |
| Disc ovality index | 1.062 | 0.441–2.559 | .893 | |||
| Tilt direction | ||||||
| Inferiorly tilted vs non-tilt | 1.405 | 0.921–2.145 | .115 | 2.378 | 1.522–3.716 | <.001* |
| Temporally tilted vs non-tilt | 0.741 | 0.463–1.186 | .212 | 0.864 | 0.538–1.388 | .546 |
| PPA-to-disc ratio | 1.193 | 0.661–2.154 | .558 | |||
Stay updated, free articles. Join our Telegram channel

Full access? Get Clinical Tree


