Purpose
To investigate the association between visual acuity deficits and fixation instability in children with Down syndrome and nystagmus.
Design
Prospective cross-sectional study.
Methods
setting : Institutional. study population :Sixteen children (aged 10 months-14 years) with Down syndrome and nystagmus, and a control group of 93 age-similar children with unassociated infantile nystagmus. observation procedures : Binocular Teller acuity card testing and eye-movement recordings. Fixation stability was quantified using the nystagmus optimal fixation function (NOFF). An exponential model based on results from the control group with unassociated infantile nystagmus was used to relate fixation stability to age-corrected visual acuity deficits. main outcome measures : Binocular grating visual acuity and NOFF.
Results
Visual acuity was 0.2-0.9 logMAR (20/30-20/174 Snellen equivalent) and corresponded to a 0.4 logMAR (4 lines) mean age-corrected visual acuity deficit. Fixation stability ranged from poor to mildly affected. Although visual acuity deficit was on average 0.17 logMAR larger ( P = .005) than predicted by the model, most children had visual acuity deficit within the 95% predictive interval.
Conclusions
There was a small mean difference between the measured visual acuity deficit and the prediction of the nystagmus model. Although other factors also contribute to visual acuity loss in Down syndrome, nystagmus alone could account for most of the visual acuity deficit in these children.
Abnormalities of visual functioning in children with Down syndrome are caused by uncorrected refractive error, limited accommodation (including limited accommodative effort), strabismus, nystagmus, and possibly abnormal cortical morphology. When wearing proper optical correction, these children usually have mild to moderate deficits in visual acuity, which are presumably the cumulative result of nystagmus (fixational instability) and cortical abnormalities, including, perhaps, amblyopia. Accurate assessment of visual functioning in children with Down syndrome may be hampered by limitations in executive functioning and attention.
Reportedly, up to 30% of patients with Down syndrome have nystagmus. Recent advances in the understanding of the relation between the various waveforms of nystagmus eye movements and visual acuity in patients with unassociated infantile nystagmus (typically referred to as “idiopathic infantile nystagmus” or “congenital nystagmus,” ie, infantile nystagmus in the absence of any other afferent visual system disease), as well as progress in delineating the functional improvements after nystagmus surgery in children, prompted us to investigate to what extent fixational instability may explain visual acuity deficits in children diagnosed with Down syndrome and nystagmus.
Methods
The research protocol and informed consent form for this cross-sectional study were approved by the Institutional Review Board of the University of Texas Southwestern Medical Center. Written informed consent was obtained from a parent or legal guardian for each participant. This study was performed in accordance with the US Health Insurance Portability and Accountability Act.
Participants
Sixteen children (aged 10 months-14 years [median 3.5 years]) diagnosed with Down syndrome and nystagmus participated in this cross-sectional study carried out in the Visual Disorders and Eye Movements Laboratory at the Retina Foundation of the Southwest between August 2009 and July 2012. Children with cataracts or other apparent structural abnormalities in the eyes were excluded, as were children with severe developmental delay. The Table provides basic clinical data for this cohort. As can be seen from the Table , most children were myopic (and wore spectacle correction), while several had various amounts of (intermittent) strabismus. A group of 93 infants, children, and young adults with unassociated infantile nystagmus (aged 5 months-27 years [median 4.4 years]) from a previous study formed a comparison group; the diagnosis of unassociated infantile nystagmus in these children was based on eye-movement recordings and a complete ophthalmologic examination by the referring pediatric ophthalmologist.
| Patient No. | Age (y)/Sex | Visual Acuity (logMAR) | Refractive Error [OD; OS] (D) | Strabismus | Nystagmus Type | NOFF (logits) | Foveation Fraction |
|---|---|---|---|---|---|---|---|
| 1 | 0.8/M | 0.63 | N/A | Ortho | INS | −1.00 | 0.27 |
| 2 | 0.9/M | 0.53 | N/A | Small-angle ET | INS | 1.07 | 0.75 |
| 3 | 2.1/F | 0.76 | +0.25; +0.25 | Ortho | INS | −0.73 | 0.32 |
| 4 | 2.4/M | 0.83 | −1.00; −1.00 | Ortho | INS | −2.57 | 0.07 |
| 5 | 2.8/M | 0.65 | −7.00; −5.00 | 8 ET, post-op | INS | −1.34 | 0.21 |
| 6 | 2.8/M | 0.89 | −7.00+1.25×70deg; −7.00+1.25×100deg | 12 E(T) | INS | −2.05 | 0.11 |
| 7 | 3.1/F | 0.88 | −1.50+1.50×80deg; −1.50+1.50×100deg | Ortho | INS | 0.22 | 0.56 |
| 8 | 3.4/F | 0.43 | −1.00+1.00×60deg; −1.00+1.00×100deg | 10 E(T), post-op | FMNS | −0.44 | 0.39 |
| 9 | 3.7/M | 0.94 | −8.50+1.00×90deg; −7.50+2.50×90deg | Ortho, post-op | FMNS | −2.93 | 0.05 |
| 10 | 4.1/M | 0.46 | −12.00; −10.50 | Ortho | INS | −0.18 | 0.46 |
| 11 | 4.3/M | 0.51 | +2.50+1.00×70deg; +2.50+2.50×110deg | 25 E(T) | INS | 1.34 | 0.79 |
| 12 | 5.9/F | 0.45 | −1.75+2.25×80deg; −2.00+2.50×110deg | Ortho, post-op | INS | −1.77 | 0.15 |
| 13 | 5.9/F | 0.35 | −12.50+4.50×75deg; −12.50+6.00×100deg | 25 ET, post-op | INS | −3.07 | 0.04 |
| 14 | 7.3/M | 0.18 | −4.00+3.75×100deg; −2.50+2.50×75deg | 3 X(T) | INS | 0.23 | 0.56 |
| 15 | 8.9/F | 0.69 | −3.50; −2.50 | Ortho | INS | −4.59 | 0.01 |
| 16 | 14/M | 0.46 | −3.00+2.50×100deg; −3.00+2.50×80deg | Ortho | INS | 0.99 | 0.73 |
Visual Acuity
Binocular, spectacle-corrected grating visual acuity was assessed with the Teller visual acuity cards (Stereo Optical, Chicago, Illinois, USA) using a staircase procedure and a forced-choice paradigm using either preferential looking or pointing, depending on the individual child’s abilities. Thus, this grating detection task poses minimal requirements on cognitive abilities of the child tested. Visual acuity was defined as the mean of the last 6 of 8 total staircase reversals on a logMAR scale. Because the mean normal visual acuity improves with age in early childhood, the visual acuity measurements were converted to visual acuity deficits (ie, logMAR units relative to published age-corrected mean normal values ) for part of the analysis. For clinical reference, the logMAR visual acuities were also given in Snellen-equivalent values using the formula: Snellen denominator = 20 × 10 (logMAR) .
Eye Movements
Nystagmus eye movements were recorded using a remote high-speed video system (EyeLink 1000; SR Research Ltd, Kanata, Ontario, Canada) while the child performed a simple fixation task for 20-30 seconds under binocular viewing. Children requiring refractive correction wore their spectacles. The recordings were low-pass filtered off-line and differentiated to obtain eye velocity information. Further details of instrumentation, calibration, and test protocol were published previously.
Quantification of nystagmus eye movements centers around foveation periods: brief amounts of time (typically >20 ms duration; 1 during each oscillation of the nystagmus waveform) when the eyes are moving with sufficiently low velocity while the visual axis is in or near the direction of the target. The gold standard for quantifying foveation periods is the expanded nystagmus acuity function (commonly referred to as “NAFX”), a mathematical algorithm that applies simultaneous criteria on eye position and eye velocity in order to determine which portion of each oscillation corresponds to an event of fixation or “foveation.” Here, a somewhat less stringent algorithm was used, the nystagmus optimal fixation function (or “NOFF”), which was designed as a more easily used method in young children who typically do not produce data of the quality necessary for analysis using the NAFX. Consequently, the NOFF is a trade-off between accuracy and feasibility and is intended for use in more challenging test situations. Its algorithm objectively searches for a clean portion in what could otherwise be very noisy data, with a 4-second “window” moving through the entire record and iteratively determining the fraction of data points that meet foveation criteria (simultaneous criteria on velocity and relative position). This foveation fraction (0.0-1.0) is then transformed using a logistic transformation (the result ranging from approximately −5 to +5 logits) for purposes of calculation and statistics.
Data Analysis and Modeling
An exponential function of the form a exp (−NOFF/ b ), proposed and validated previously, was used to obtain an ensemble fit to the visual acuity deficit data as a function of nystagmus foveation properties as they were determined using the nystagmus optimal fixation function. The parameters for this model, a = 0.13 logMAR and b = 2.6 logits, were determined from a large cohort of children with unassociated infantile nystagmus in our laboratory (n = 93, the comparison group). The protocols for both visual acuity measurement and the recording and analysis of eye movements for the comparison group were identical to those used in the present study.
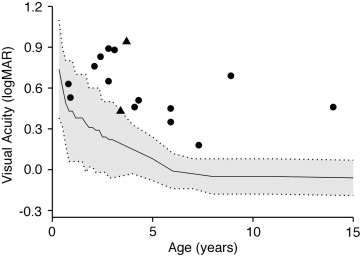
Results
Visual acuity in the 16 children with Down syndrome and nystagmus spanned a large range from 0.2-0.9 logMAR or 20/30-20/174 Snellen equivalent (mean 0.58 logMAR, 20/76) with no association with age (linear regression, P = .15). The mean visual acuity deficit with respect to age-matched norms was 0.40 logMAR ( Figure 1 ), or 4 lines poorer than mean normal.