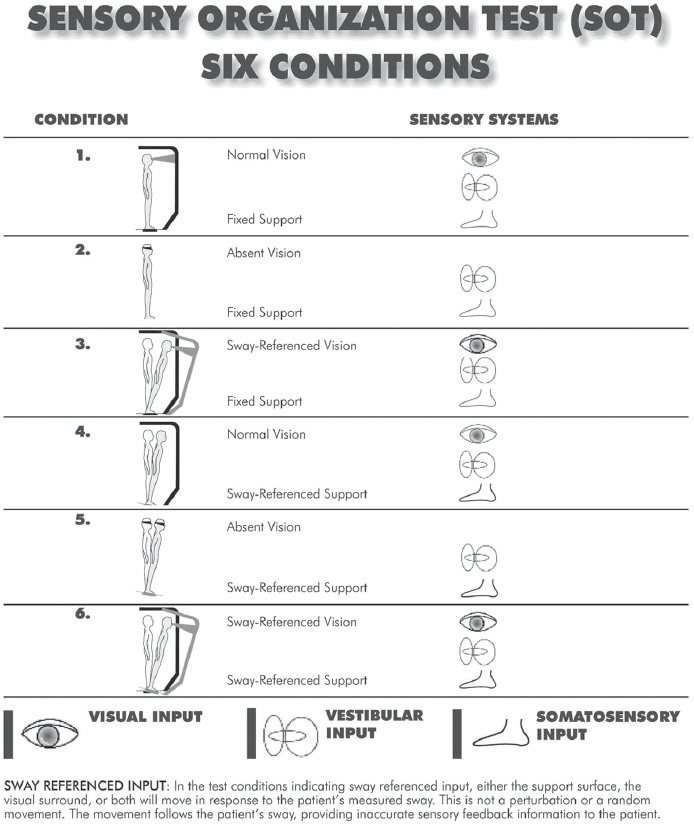
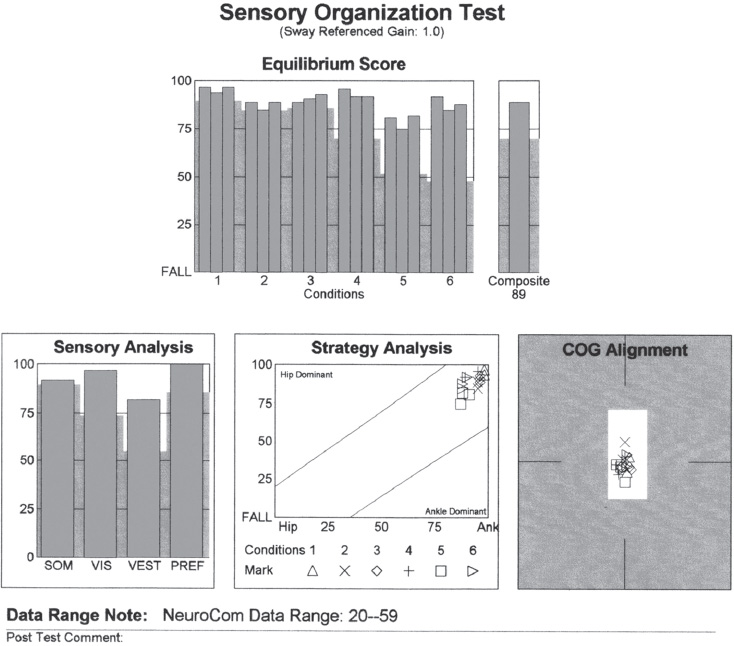
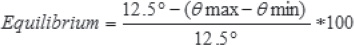
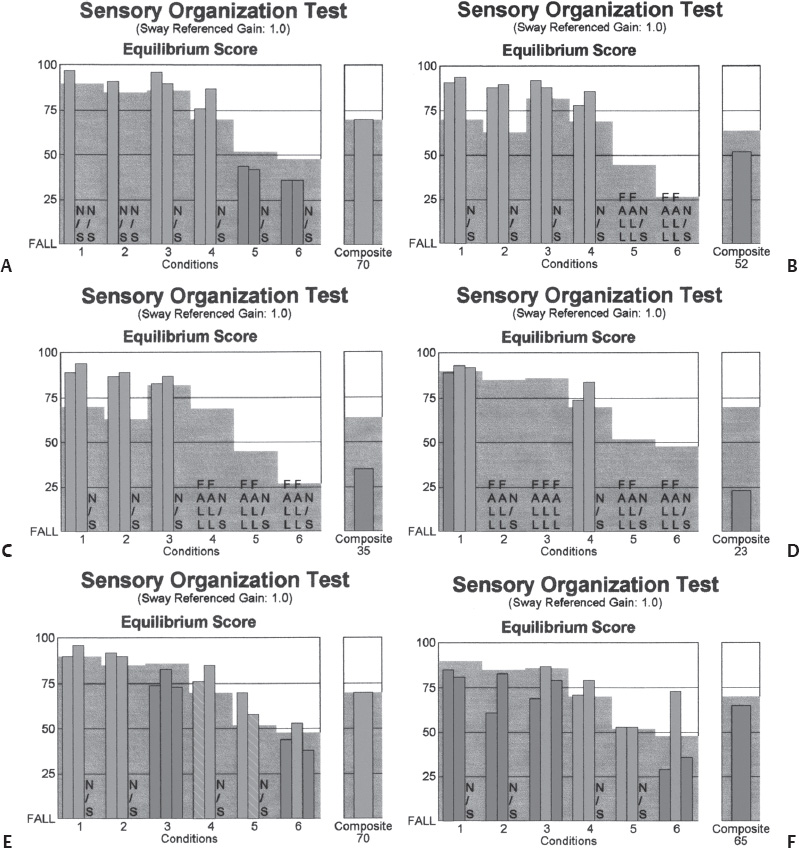
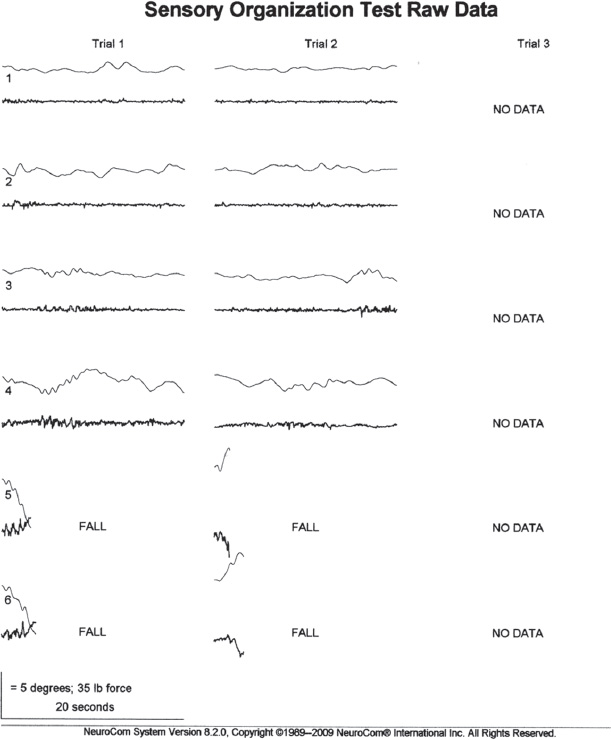
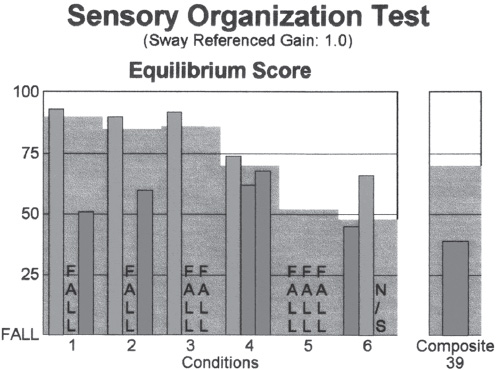
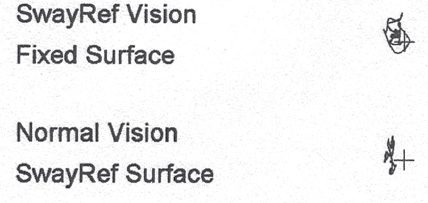
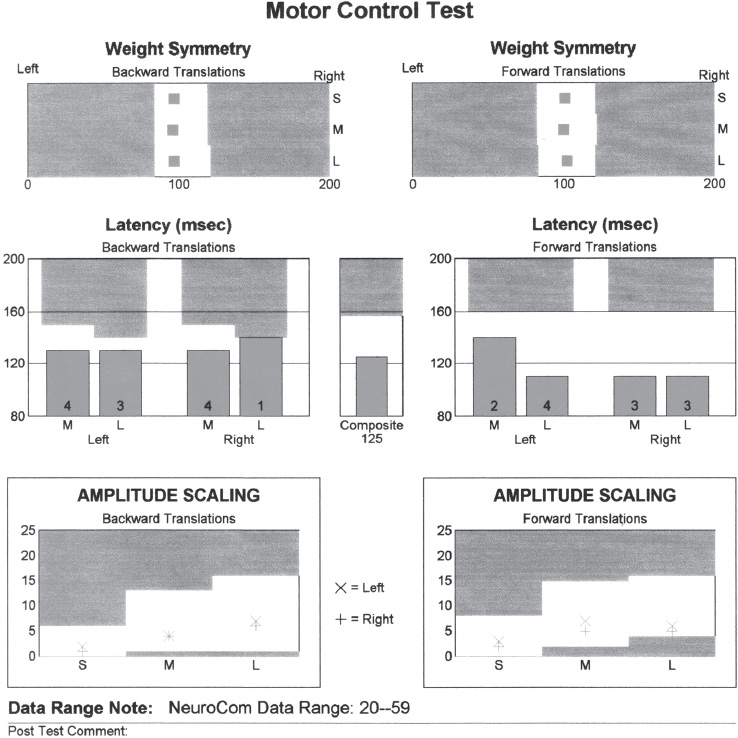
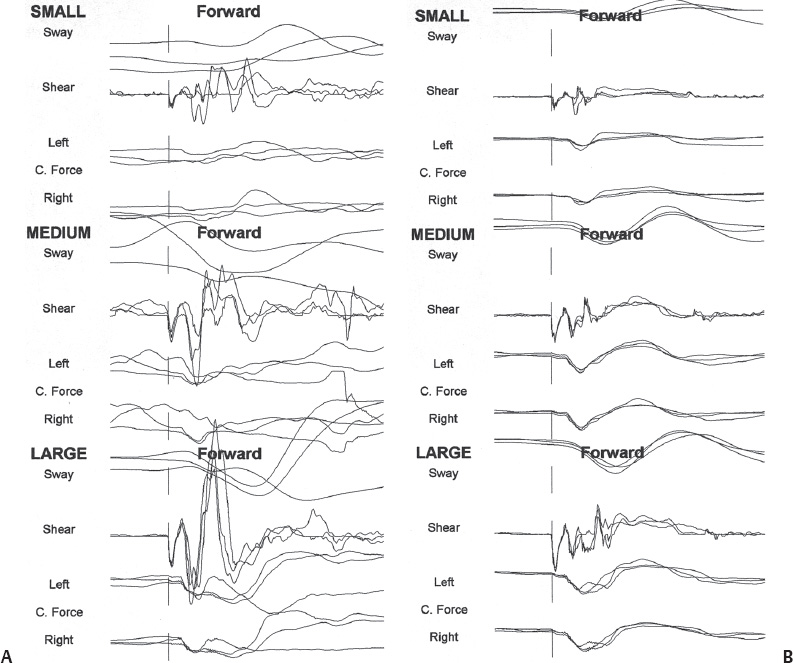
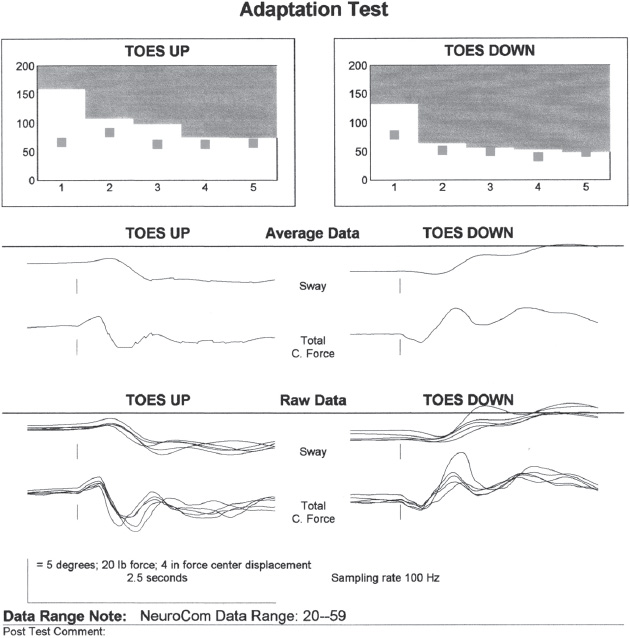
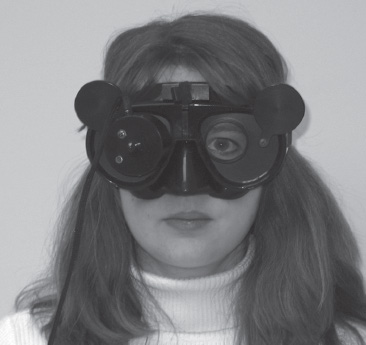
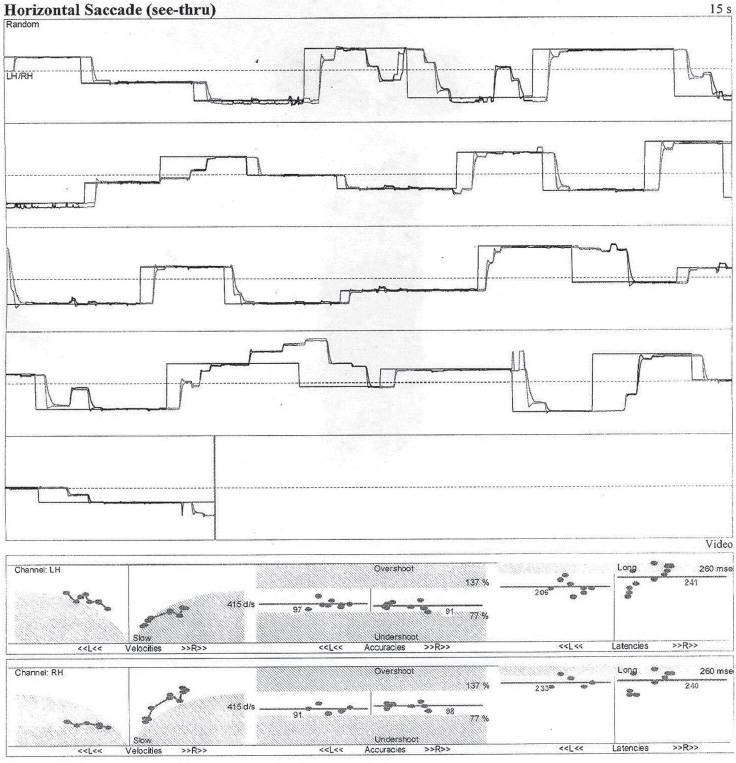
3 Vestibular Evaluation Balance and mobility are complex tasks that involve the coordination of numerous systems working together in harmony. Computerized dynamic posturography (CDP) evaluates the patient’s ability to use these systems both together and independently. During the test, upright balance function is assessed and the patient’s functional limitations are determined. This is accomplished through a variety of tasks that attempt to simulate conditions encountered in daily life. Unlike video-oculography (VOG) and rotational chair tests, which look primarily at the horizontal vestibulo-ocular refex (VOR), CDP is unique in that it attempts to evaluate the function of the vestibulospinal refex (VSR) in addition to visual and somatosensory cues. Furthermore, performance on CDP is infuenced by input from the vertical semicircular canals and otolith organs (Furman, 1995). To perform the test, the patient stands on a force platform that is surrounded on three sides by an enclosure that blocks the patient’s feld of view. The force platform consists of two footplates supported by fve force sensors that detect exertion from the patient’s feet along the horizontal and vertical axes (EquiTest, NeuroCom International Inc., Clackamas, Oregon; see NeuroCom International, 2000). Results of the test can be used to quantify and diferentiate impairment in the sensory, motor, and central systems as well as aid in the rehabilitation of the patient (Nashner, 2008). It can provide insight regarding the current state of central compensation in patients with a unilateral peripheral vestibular injury or bilateral loss. Furthermore, the test can help identify patients suspected to have exaggerated symptoms. During the sensory organization test (SOT) the patient attempts to maintain balance under six diferent conditions that incorporate various combinations of support surface and visual surround motion. Efective use of visual, vestibular, and somatosensory inputs as well as appropriate sensory integration and an intact musculoskeletal system are required to perform optimally on the test (Nashner, 2008). There are six SOT conditions with a maximum of three trials each (Fig. 3.1): Condition 1—the platform and visual environment are stable. The patient has access to all three inputs to maintain balance. Condition 2—the platform is stable and the patient’s eyes are closed. The patient must rely on vestibular and somatosensory inputs. Condition 3—the platform is stable, but the visual surround moves in concert with the patient (sway referenced) providing a distorted visual input. This assesses how well the patient can disregard the false input from the visual system and utilize the two other systems. Condition 4—the surround is now stable but the platform is sway referenced. Under this condition, the patient relies primarily on visual and vestibular inputs. Condition 5—the platform is sway referenced and the patient’s eyes are closed. The patient must rely primarily on vestibular input because somatosensory and visual input has been distorted. Condition 6—the platform and surround are both sway referenced. The patient must rely on vestibular input and ignore false visual and somatosensory inputs. Following each SOT trial, an equilibrium score (EQ) is calculated (Fig. 3.2). The EQ represents the maximum amount of anteroposterior (AP) sway that occurred during each trial (NeuroCom International, 2000). The highest possible score is 100 (which would be indicative of no sway) and the lowest possible score is a 0 (fall or step). The greater the amount of AP sway during the trial, the closer the score is to 0. If the operator marks the trial as a fall, the word FALL appears on the graph and that trial is scored as a 0 (NeuroCom International, 2000). The formula used to calculate the EQ is as follows: where 12.5 degrees is the normal limit of sway stability and θ represents the AP Center of Gravity (COG) Sway Angle (NeuroCom International, 2000). The score for each trial is displayed on a graph and compared with age-matched normative data within the system. Scores that exceed the shaded area on the graph are considered to be within normal limits and appear as a green bar on the graph. Those scores falling within the shaded area are considered outside normal limits and appear as a red bar. A composite equilibrium score is also calculated. “The composite equilibrium score is calculated by (a) independently averaging the scores for conditions 1 and 2; (b) adding these two scores to the equilibrium scores from each trial of sensory conditions 3, 4, 5, and 6; and (c) dividing that sum by the total number of trials” (NeuroCom International, 2000, p. SOT-7). Specifc sensory impairments to balance have been associated with various patterns of SOT performance (Fig. 3.3). Decreased SOT 5 and 6 is referred to as a vestibular dysfunction pattern (Nashner, 2008). These patients may have uncom-pensated unilateral or bilateral vestibular dysfunction. Patients with bilateral loss may demonstrate early falls on SOT 5 and 6 (Goebel, White, & Heidenreich, 2009), which is indicative of a vestibular loss pattern (Fig. 3.4). Decreased SOT 4, 5, and 6 is referred to as a support surface dependence (somatosensory dependence) pattern and indicates impairment in the use of both vestibular and visual inputs to balance. Decreased SOT 2, 3, 5, and 6 is referred to as a visual dependence pattern. These patients may have impairment in the utilization of both somatosensory and vestibular inputs. Decreased SOT 3 and 6 is referred to as a vision preference pattern (Nashner, 2008). These patients may have impairment in the central adaptive mechanisms for suppression of conficting visual input (Nashner, 2008). An aphysiologic pattern is characterized as one in which the patient performs better on the more difcult conditions or has great inter-test variability (Nashner, 2008). This may also present as a global dysfunction in a patient in which observation prior to the test suggests a higher level of functional ability. Fig. 3.4 Early falls during SOT trials 5 and 6 in a patient with bilateral vestibular loss. Fig. 3.5 Inter-trial variability on the sensory organization test. Fig. 3.6 Circular sway as seen on the raw data tracing of the sensory organization test in a patient with aphysiologic balance dysfunction. Results of the SOT may provide indications of aphysiologic performance. This may occur in several ways: (1) an improvement in postural ability on the more difcult conditions; (2) considerable inter-trial variability as seen in Fig. 3.5; (3) reduced scores on condition 1 when the patient did not appear to have postural or gait instability immediately prior to the examination; and/or (4) excessive lateral and/or circular sway patterns as seen in Fig. 3.6 (Nashner, 2008). COG alignment appears as a scatter plot on the comprehensive report for the SOT and refects the patient’s COG at the start of each SOT trial (NeuroCom International, 2000) (Fig. 3.2). COG scores are useful in determining the patient’s risk of falls. To remain upright, the body must be able to maintain its COG on a relatively small base of support. A person’s limits of stability is defned as the maximum distance the body can lean in any given direction without losing balance. When the body is placed beyond its limits of stability, one must take a step or stumble to recover balance and avoid falling (Nashner, 2008). Therefore, a COG that is signifcantly eccentric reduces the distance the body can lean in that direction before exceeding the limits of stability, thus placing the patient at a higher risk for falls. Strategy analysis helps to determine if the patient uses ankle and hip strategies appropriately when performing balance tasks (Fig. 3.2). Strategy analysis scores range from 100 to 0. A score of 100 indicates exclusive use of ankle strategy and a score of 0 indicates exclusive use of hip strategy (NeuroCom International, 2000). Strategy analysis scores that lie between the two extremes indicate a combination of the two strategies was used (NeuroCom International, 2000). The strategy analysis is calculated by the following formula: In this formula, 25 lb is the “diference measured between the greatest shear force (ShMAX) and the lowest shear force (ShMIN) generated by a test group of normal subjects who used only hip sway to balance on a narrow beam (Nashner, unpublished data)” (NeuroCom International, 2000). Ankle strategy is most appropriate for small adjustments to the center of gravity such as those that occur when the support surface is frm and movement is slow. Hip strategies are more efective with rapid movements or when COG approaches the limits of stability (Nashner, 2008). The sensory analysis graph is based on the average equilibrium scores of specifc paired SOT conditions. It is designed to aid in the interpretation of how well the patient uses somatosensory (SOM), visual (VIS), and vestibular (VEST) inputs as well as his or her ability to ignore conficting visual input (PREF) (Fig. 3.2). The motor control test evaluates automatic motor refex responses to sudden, unexpected forward and backward translations of the support surface (NeuroCom International, 2000). The amplitude of the translations is determined by the individual patient’s height. Three consecutive trials of small, medium, and large translations are recorded for both backward and forward perturbations. A score is determined for latency, weight symmetry, and amplitude scaling (Fig. 3.7). Latency refers to the time it takes for the automatic postural response to occur following the onset of platform translation. Latencies are calculated for each leg and each translation and are valuable for identifying motor system abnormalities (Nashner, 1997). Prolonged latencies imply dysfunction in any one or a combination of the components which comprise the long-loop automatic motor system and are most often associated with central and/or peripheral nervous system lesions (Nashner, 1997; Nashner, 2008). Weight symmetry refers to the percentage of body weight that is placed on each individual leg during the motor control test (Nashner, 2008). Amplitude scaling provides indication of the strength of the postural response (Nashner, 2008). Examination of motor control test raw data may provide further insight when an aphysiologic cause is suspected. A voluntary component is suspected when response tracings vary dramatically from one trial to the next, or when responses to small translations are large and highly variable (Nashner, 2008) (Fig. 3.8). Aphysiologic patterns may occur in patients who are either highly anxious or deliberately exaggerating sway (Nashner, 2008). As described by Nashner (2008), “The adaptation test assesses the ability to balance on irregular surfaces by suppressing automatic reactions to surface perturbations when they are disruptive to our stability” (p. 172). During the adaptation test, the patient attempts to maintain his or her balance during identical sequences of fve toes-up and fve toes-down rotations of the platform (Nashner, 2008). The amplitude of the patient’s sway is measured immediately following each surface rotation (Fig. 3.9). Measurements indicate how well the patient is able to utilize adaptive mechanisms to enhance stability (Nashner, 1997). Fig. 3.9 Adaptation test results in a normal subject. CDP may provide useful information in patients with case histories that indicate a history of falls, disequilibrium, postural instability, gait abnormalities, chronic symptoms indicating inadequate compensation, vertigo or dizziness of unknown etiology, or when a non-organic cause is suspected. Results from CDP may also be applied to the development and monitoring of vestibular rehabilitation (NeuroCom International, 2000). CDP does not indicate specifc pathology, but rather provides a quantitative assessment of the patient’s functional limitations. The test cannot be performed on everyone. Physical requirements for the test include a minimum weight of 40 lb, minimum height of 30 inches and the ability to stand unassisted for more than 2 to 3 minutes (NeuroCom International, 2000). It should be noted that some of the SOT trials cannot be completed if the patient is blind. VOG, also known as videonystagmography (VNG), is the most frequently ordered test in the dizziness and balance laboratory. Sometimes still referred to as electro-nystagmography or ENG, video-oculography utilizes video rather than electrode recording (Fig. 3.10). VOG is a combination of tests that assess ocular motor function and the horizontal VOR. The test helps to diferentiate between peripheral and central causes of dizziness and imbalance as well as provides important lateralization cues. The VOG test battery may include, but is not limited to, the following subtests: random saccades, horizontal and/or vertical smooth pursuit, spontaneous nystagmus with and without fxation, gaze nystagmus with and without fxation, post-headshake, positional/positioning, bithermal calorics, and fxation suppression. Fig. 3.10 Video-oculography goggles. In this photo, the infrared camera has been placed in the portal in front of the patient’s right eye. Pivoting the cover over the remaining portal allows testing in total darkness (without fixation) on certain subtests of the VOG. The random saccade test assesses velocity, accuracy, and latency of the eyes as they fxate upon alternating targets. Abnormalities on saccades are a central fnding but may also be caused by factors such as inattention, age, visual acuity, or medication efect (Leigh & Zee, 1991) (Fig. 3.11). Fig. 3.11 Disconjugate saccades in a patient diagnosed with multiple sclerosis. Note the difference in left and right velocities. Fig. 3.12 Saccadic pursuit in a patient with central pathology. For the smooth pursuit test, the patient is asked to follow a target with his or her eyes as it moves in the horizontal or vertical plane. Abnormal fndings on pursuit include saccadic or absent smooth pursuit and are considered a central fnding (Fig. 3.12). Other factors that may cause abnormal fndings on pursuit include the patient’s age, visual acuity, vigilance, and medication efect (Cass, 2008). Spontaneous nystagmus is measured frst with the patient staring at a target directly in front of him or her and then with fxation denied. Spontaneous nystagmus is considered abnormal when the slow component velocity exceeds 6 degrees/second (Shepard & Telian, 1996). Characteristics of the nystagmus can help determine its origin. Spontaneous nystagmus of peripheral origin is horizontal and becomes more pronounced when visual fxation is denied. The nystagmus is usually direction-fxed. Alexander’s law states that spontaneous nystagmus due to a vestibular lesion will intensify with gaze in the direction of the fast phase and will diminish with gaze in the direction of the slow phase. Alexander classifed the nystagmus by its intensity and direction. Nystagmus that is only visible when gazing in the direction of the fast phase is considered frst-degree nystagmus. The nystagmus is more intense with second-degree nystagmus and is visible when the eyes are in the neutral position as well as when gazing in the direction of the nystagmus. The nystagmus is most intense in third-degree nystagmus and is present when gazing in all directions (Isaacson, Ort, & Rubin, 2008). Patients with acute unilateral vestibular dysfunction may go through all three classifcations as central compensation occurs. Spontaneous nystagmus of central origin usually has a prominent vertical component, does not improve with fxation, and is accompanied with less vertigo than peripheral nystagmus (Brandt, 1997). Furthermore, central nystagmus often changes directions when gaze is directed away from the fast phase (Brandt, 1997). For the gaze nystagmus test, the patient is asked to hold the eyes in several eccentric positions frst while staring at a target, and then with fxation denied. Nystagmus that occurs only when the eyes are held in certain eccentric positions is referred to as gaze-evoked nystagmus. Gaze-evoked nystagmus is a central fnding but may also be caused by alcohol or medication efect (Hain, 1997; Bhansali, 2008). The post-headshake test is useful for detecting asymmetry in vestibular tone and/ or velocity storage (Leigh & Zee, 1991). For this test, the examiner rapidly shakes the patient’s head in the plane of the horizontal canal for 10 to 20 seconds. Following headshake, the eyes are observed for any resultant nystagmus. Horizontal post-headshake nystagmus indicates a unilateral vestibular lesion and usually beats toward the stronger side (Takahashi, Fetter, Koenig, & Dichgans, 1990). In some instances, headshake nystagmus may beat toward the side of the lesion as is sometimes seen in patients with Meniere’s disease (Takahashi et al, 1990). A vertical nystagmus which results from horizontal headshake is indicative of a central vestibular lesion (Leigh & Zee, 1991). Positional nystagmus is induced by holding the head in a specifc position. To test for positional nystagmus, movement of the patient’s eyes is observed while the patient holds the head and body in each position. Typical positions evaluated are the upright, supine, right ear-down and left ear-down positions. Each position is maintained for a minimum of 30 seconds (Gianoli & Smullen, 2008). Positional nystagmus is considered abnormal if it exceeds 6 degrees/second in a single position and may be of peripheral or central origin (Brandt, 1997). Positioning nystagmus is tested using the Dix-Hallpike maneuver
 What Is the Computerized Dynamic Posturography Test?
 What Is the Sensory Organization Test?
 What Can Be Gained from Center of Gravity Scores and Strategy Analysis?

 What Is the Sensory Analysis Graph?
 What Is the Motor Control Test?
 What Is the Adaptation Test?
 What Are the Clinical Applications of the Computerized Dynamic Posturography Test?
 What Are the Limitations of the Computerized Dynamic Posturography Test?
 What Is Video-Oculography?
 How Are Abnormalities on Saccades Interpreted?
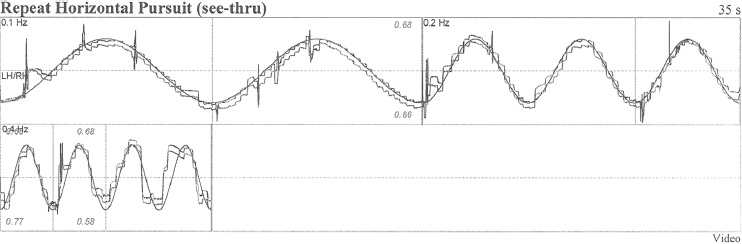
 How Are Pursuit Abnormalities Significant?
 When Is Spontaneous Nystagmus Significant and What Does It Mean?
 What Is the Significance of Gaze Nystagmus?
 What Does Post-Headshake Nystagmus Indicate?
 What Do Positional/Positioning Tests Indicate?
![]()
Stay updated, free articles. Join our Telegram channel

Full access? Get Clinical Tree


