Purpose
To report 5-year treatment outcomes in the Tube Versus Trabeculectomy (TVT) Study.
Design
Multicenter randomized clinical trial.
Methods
Settings: Seventeen clinical centers. Study population: Patients 18 to 85 years of age who had previous trabeculectomy and/or cataract extraction with intraocular lens implantation and uncontrolled glaucoma with intraocular pressure (IOP) ≥18 mm Hg and ≤40 mm Hg on maximum tolerated medical therapy. Interventions: Tube shunt (350-mm 2 Baerveldt glaucoma implant) or trabeculectomy with mitomycin C ([MMC]; 0.4 mg/mL for 4 minutes). Main outcome measures: IOP, visual acuity, use of supplemental medical therapy, and failure (IOP >21 mm Hg or not reduced by 20%, IOP ≤5 mm Hg, reoperation for glaucoma, or loss of light perception vision).
Results
A total of 212 eyes of 212 patients were enrolled, including 107 in the tube group and 105 in the trabeculectomy group. At 5 years, IOP (mean ± SD) was 14.4 ± 6.9 mm Hg in the tube group and 12.6 ± 5.9 mm Hg in the trabeculectomy group ( P = .12). The number of glaucoma medications (mean ± SD) was 1.4 ± 1.3 in the tube group and 1.2 ± 1.5 in the trabeculectomy group ( P = .23). The cumulative probability of failure during 5 years of follow-up was 29.8% in the tube group and 46.9% in the trabeculectomy group ( P = .002; hazard ratio = 2.15; 95% confidence interval = 1.30 to 3.56). The rate of reoperation for glaucoma was 9% in the tube group and 29% in the trabeculectomy group ( P = .025).
Conclusions
Tube shunt surgery had a higher success rate compared to trabeculectomy with MMC during 5 years of follow-up in the TVT Study. Both procedures were associated with similar IOP reduction and use of supplemental medical therapy at 5 years. Additional glaucoma surgery was needed more frequently after trabeculectomy with MMC than tube shunt placement.
Despite the introduction of several new glaucoma operations in recent years, trabeculectomy (or guarded filtration procedure) and tube shunt (or aqueous shunt) surgery remain the most commonly performed incisional procedures for the management of glaucoma. Trabeculectomy has historically been preferred over tube shunt implantation, except in refractory glaucomas at high risk for filtration failure. However, concern about bleb-related complications has contributed to an expanded use of tube shunts as an alternative to trabeculectomy. Medicare claims data show a 43% decrease in the number of trabeculectomy procedures and a concurrent 184% increase in tube shunt surgery between 1995 and 2004. Recent surveys of the American Glaucoma Society membership have demonstrated a rise in the proportion of surgeons using tube shunts and a decline in the popularity of trabeculectomy. These surveys have also indicated a lack of consensus regarding the best surgical approach for managing glaucoma in patients who have undergone prior ocular surgery. In particular, some surgeons favor placement of a tube shunt while others prefer a trabeculectomy with an adjunctive antifibrotic agent in eyes with previous cataract or glaucoma surgery.
The Tube Versus Trabeculectomy (TVT) Study was designed to prospectively compare the safety and efficacy of tube shunt surgery and trabeculectomy with mitomycin C (MMC) in eyes with prior ocular surgery. Patients with uncontrolled glaucoma who had previously undergone cataract extraction with intraocular lens implantation and/or failed filtering surgery were enrolled in this multicenter clinical trial and randomized to receive either a 350-mm 2 Baerveldt glaucoma implant (Abbott Medical Optics, Santa Ana, California, USA) or a trabeculectomy with MMC. The goal of this investigator-initiated study is to provide information that will assist in surgical decision making in similar patient groups. This article reports the outcomes of treatment during 5 years of follow-up in the TVT Study.
Methods
The design and methods of the TVT Study were previously described in detail, and are summarized herein.
Eligibility Criteria
Inclusion criteria included age 18 to 85 years, previous trabeculectomy and/or cataract extraction with intraocular lens implantation, and intraocular pressure (IOP) ≥18 mm Hg and ≤40 mm Hg on maximum tolerated medical therapy. Exclusion criteria included no light perception vision, pregnant or nursing women, active iris neovascularization or proliferative retinopathy, iridocorneal endothelial syndrome, epithelial or fibrous downgrowth, aphakia, vitreous in the anterior chamber for which a vitrectomy was anticipated, chronic or recurrent uveitis, severe posterior blepharitis, unwillingness to discontinue contact lens use after surgery, previous cyclodestructive procedure, prior scleral buckling procedure, presence of silicone oil, conjunctival scarring precluding a superior trabeculectomy, and need for glaucoma surgery combined with other ocular procedures or anticipated need for additional ocular surgery. Only 1 eye of eligible patients was included in the study.
Randomization and Treatment
The TVT Study was conducted at 17 clinical centers. Eligibility was independently confirmed at the Statistical Coordinating Center. Patients enrolled in the study were randomized to placement of a 350-mm 2 Baerveldt glaucoma implant or trabeculectomy with MMC. Randomization was performed using a permuted block design stratified by clinical center and type of previous intraocular surgery. Neither the patient nor the clinician was masked to the randomization assignment during follow-up.
A 350-mm 2 Baerveldt glaucoma implant was placed in the superotemporal quadrant in all patients randomized to the tube group. A limbus-based or fornix-based conjunctival flap was dissected, and the implant was sutured to sclera 10 mm posterior to the limbus. The Baerveldt tube was completely occluded to temporarily restrict flow through the device until encapsulation of the plate occurred. The surgeon was given the option of fenestrating the tube for early IOP reduction. The Baerveldt tube was inserted into the anterior chamber through a 23-gauge needle track. A patch graft was used to cover the limbal portion of the tube, and the conjunctiva was closed.
All patients randomized to the trabeculectomy group underwent a trabeculectomy with MMC superiorly. A limbus-based or fornix-based flap was created, and a fluid-retaining sponge soaked in MMC (0.4 mg/mL) was applied to the superior sclera for 4 minutes. A partial-thickness scleral flap was dissected, and a paracentesis was made. A block of limbal tissue was excised underneath the trabeculectomy flap. The scleral flap was reapproximated to the scleral bed with interrupted or releasable 10–0 nylon sutures. The conjunctiva was closed, and Seidel testing was performed at the conclusion of the case.
Patient Visits
Baseline demographic and clinical information were collected for enrolled patients. Follow-up visits were scheduled at 1 day, 1 week, 1 month, 3 months, 6 months, 1 year, 18 months, 2 years, 3 years, 4 years, and 5 years postoperatively. Each examination included measurement of Snellen visual acuity (VA), IOP, slit-lamp biomicroscopy, Seidel testing, and ophthalmoscopy. Humphrey perimetry, Early Treatment Diabetic Retinopathy Study (ETDRS) VA, and quality of life using the National Eye Institute Visual Function Questionnaire (NEI VFQ-25) were assessed at baseline and at the annual follow-up visits. A formal motility evaluation was performed in all patients at baseline and at the 1-year and 5-year follow-up visits, and at any visit after 3 months at which the patient reported diplopia. Investigators provided an explanation for loss of 2 or more lines of Snellen VA at follow-up visits after 3 months. Postoperative interventions and surgical complications were documented at each follow-up visit. Additional information was collected for patients undergoing a reoperation, including the date of surgery, type of procedure, and IOP level and number of glaucoma medications immediately prior to reoperation.
Outcome Measures
Outcome measures assessed in the TVT Study include IOP, VA, use of supplemental medical therapy, surgical complications, visual fields, quality of life, and failure. Failure was prospectively defined as IOP >21 mm Hg or less than 20% reduction below baseline on 2 consecutive follow-up visits after 3 months, IOP ≤5 mm Hg on 2 consecutive follow-up visits after 3 months, reoperation for glaucoma, or loss of light perception vision. Reoperation for glaucoma was defined as additional glaucoma surgery requiring a return to the operating room, such as placement of a tube shunt. Cyclodestruction was also counted as a reoperation for glaucoma. Interventions performed at the slit lamp, such as needling procedures and laser suture lysis, were not considered glaucoma reoperations. Eyes that had not failed by the above criteria and were not on supplemental medical therapy were considered complete successes. Eyes that had not failed but required supplemental medical therapy were defined as qualified successes. An independent Safety and Data Monitoring Committee (SDMC) met twice a year to monitor the conduct of the study.
Statistical Analysis
Univariate comparisons between treatment groups were performed using the 2-sided Student t test for continuous variables and the χ 2 test, Fisher exact test, or exact permutation χ 2 test for categorical variables. Snellen VA measurements were converted to logMAR equivalents for the purpose of data analysis, as reported previously. The time to failure was defined as the time from surgical treatment to reoperation for glaucoma, loss of light perception vision, or the first of 2 consecutive study visits after 3 months in which the patient had persistent hypotony (IOP ≤5 mm Hg) or inadequately reduced IOP (IOP >21 mm Hg or not reduced by 20% below baseline). Treatment comparisons of time to failure and time to reoperation for glaucoma were assessed with the stratified Kaplan-Meier survival analysis log-rank test. Risk factors for failure were evaluated with the Kaplan-Meier survival log-rank test. Multivariate analysis was performed using Cox proportional hazard regression analysis with forward stepwise elimination. A P value of .05 or less was considered statistically significant in our analyses.
Results
Recruitment and Retention
The TVT Study enrolled 212 eyes of 212 patients between October 1999 and April 2004. Randomization assigned 107 patients to placement of a 350-mm 2 Baerveldt glaucoma implant and 105 patients to a trabeculectomy with MMC. All patients received their assigned treatment.
Figure 1 shows the progress of patients in the study. In the overall study group of 212 patients, 28 patients (13%) died within 5 years of enrollment. An additional 39 patients (18%) missed their 5-year study visit. During the first 5 years, 13.0% of follow-up visits were missed because of deaths and losses to follow-up. The visit completion rate did not significantly differ by treatment group ( P = .22, χ 2 test).
Baseline Characteristics
Table 1 presents the baseline characteristics of study patients. No significant differences in any of the demographic or clinical features were observed between treatment groups at enrollment. Additional information on randomized patients was provided in a previous publication. Similar mean IOPs and glaucoma medications were seen among patients who were and were not lost to follow-up in both treatment groups ( Supplemental Table , available at AJO.com ).
| Tube Group (n = 107) | Trabeculectomy Group (n = 105) | P Value | |
|---|---|---|---|
| Age (years), mean ± SD | 70.9 ± 11.0 | 71.1 ± 9.9 | .89 a |
| Sex, n (%) | .055 b | ||
| Male | 43 (40) | 57 (54) | |
| Female | 64 (60) | 48 (46) | |
| Race, n (%) | .53 c | ||
| White | 52 (49) | 43 (41) | |
| Black | 40 (37) | 42 (40) | |
| Hispanic | 12 (11) | 18 (17) | |
| Other | 3 (3) | 2 (2) | |
| Diabetes mellitus, n (%) | 31 (29) | 36 (34) | .49 b |
| Hypertension, n (%) | 61 (57) | 63 (60) | .76 b |
| IOP (mm Hg), mean ± SD | 25.1 ± 5.3 | 25.6 ± 5.3 | .56 a |
| Glaucoma medications, mean ± SD | 3.2 ± 1.1 | 3.0 ± 1.2 | .17 a |
| Diagnosis, n (%) | .057 c | ||
| POAG | 88 (82) | 84 (80) | |
| CACG | 7 (7) | 11 (10) | |
| PXFG | 7 (7) | 1 (1) | |
| PG | 1 (1) | 0 (0) | |
| Other | 4 (4) | 9 (9) | |
| Lens status, n (%) | .85 c | ||
| Phakic | 24 (22) | 21 (20) | |
| PCIOL | 80 (75) | 80 (76) | |
| ACIOL | 3 (3) | 4 (4) | |
| Previous intraocular surgery | .35 a | ||
| Mean ± SD | 1.3 ± 0.5 | 1.2 ± 0.5 | |
| Range | 1–3 | 1–4 | |
| Interval (months), mean ± SD e | 54 ± 50 | 60 ± 55 | .42 a |
| ETDRS VA, mean ± SD | 62.7 ± 24.1 | 64.4 ± 19.6 | .56 a |
| Snellen VA | |||
| Median | 20/30 | 20/40 | .76 d |
| Range | 20/17–HM | 20/20–2/200 | |
| LogMAR mean ± SD | .42 ± .54 | .37 ± .38 | .40 a |
| Humphrey visual fields | |||
| MD, mean ± SD | −16.0 ± 10.2 | −15.8 ± 9.6 | 0.87 a |
| PSD, mean ± SD | 7.1 ± 3.5 | 6.9 ± 3.5 | 0.73 a |
e Interval between last intraocular surgery and surgical treatment in study.
Intraocular Pressure Reduction
Table 2 and Figure 2 provide baseline and follow-up IOP measurements for the tube and trabeculectomy groups. Patients who underwent additional glaucoma surgery were censored from analysis after reoperation. Both surgical procedures produced a significant and sustained reduction in IOP. At 5 years, IOP (mean ± SD) was 14.4 ± 6.9 mm Hg in the tube group and 12.6 ± 5.9 mm Hg in the trabeculectomy group ( P = .12, Student t test; 95% confidence interval −0.5 mm Hg to 4.1 mm Hg). Among patients who completed 5-year follow-up visits, IOP reduction from baseline (mean ± SD) was 10.2 ± 7.4 mm Hg (41.4%) in the tube group ( P < .001, paired t test) and 12.4 ± 7.2 mm Hg (49.5%) in the trabeculectomy group ( P < .001, paired t test). The degree of IOP reduction was similar between the 2 treatment groups at 5 years ( P = .097, Student t test). No significant difference in mean IOP was seen between treatment groups after 3 months. The proportion of patients with IOP ≤14 mm Hg was also similar between the tube and trabeculectomy groups. At 5 years, 39 patients (63.9%) in the tube group and 40 patients (63.5%) in the trabeculectomy group had an IOP of 14 mm Hg or less ( P > .99, χ 2 test).
| Tube Group a,b | Trabeculectomy Group a,b | P Value c | |
|---|---|---|---|
| Baseline | |||
| IOP (mm Hg) | 25.1 ± 5.3 | 25.6 ± 5.3 | .56 |
| Glaucoma medications | 3.2 ± 1.1 | 3.0 ± 1.2 | .17 |
| n | 107 | 105 | |
| 1 year | |||
| IOP (mm Hg) | 12.5 ± 3.9 | 12.7 ± 5.8 | .75 |
| Glaucoma medications | 1.3 ± 1.3 | 0.5 ± 0.9 | <.001 |
| n | 97 | 87 | |
| 2 years | |||
| IOP (mm Hg) | 13.4 ± 4.8 | 12.1 ± 5.0 | .097 |
| Glaucoma medications | 1.3 ± 1.3 | 0.8 ± 1.2 | .019 |
| n | 83 | 72 | |
| 3 years | |||
| IOP (mm Hg) | 13.3 ± 5.0 | 13.5 ± 6.9 | .83 |
| Glaucoma medications | 1.3 ± 1.3 | 1.0 ± 1.5 | .31 |
| n | 78 | 68 | |
| 4 years | |||
| IOP (mm Hg) | 13.5 ± 5.4 | 12.9 ± 6.1 | .58 |
| Glaucoma medications | 1.4 ± 1.4 | 1.2 ± 1.5 | .33 |
| n | 68 | 65 | |
| 5 years | |||
| IOP (mm Hg) | 14.4 ± 6.9 | 12.6 ± 5.9 | .12 |
| Glaucoma medications | 1.4 ± 1.3 | 1.2 ± 1.5 | .23 |
| n | 61 | 63 |
a Data presented as mean ± standard deviation.
b Data censored after a reoperation for glaucoma.
An additional intent-to-treat analysis was performed, which included patients who required further surgery for glaucoma. No significant difference in mean IOP was present between treatment groups taking into account all medical and surgical management during 5 years of follow-up. At 5 years, IOP (mean ± SD) was 14.3 ± 6.8 mm Hg in the tube group and 13.6 ± 6.2 mm Hg in the trabeculectomy group ( P = .54, Student t test; 95% confidence interval −1.4 mm Hg to 2.8 mm Hg).
Medical Therapy
Table 2 shows the number of glaucoma medications in the tube and trabeculectomy groups at baseline and follow-up. Patients who underwent additional glaucoma surgery were censored from analysis after reoperation. A significant reduction in the use of medical therapy was seen in both treatment groups. The number of glaucoma medications (mean ± SD) decreased from baseline by 1.8 ± 1.8 in the tube group ( P < .001, paired t test) and 1.7 ± 2.0 in the trabeculectomy group ( P < .001, paired t test) in patients who completed 5-year follow-up visits. A significantly greater use of supplemental medical therapy was observed in the tube group compared with the trabeculectomy group at all follow-up visits during the first 2 postoperative years. However, the mean number of glaucoma medications was similar between treatment groups at 3 years and at all subsequent study visits.
No significant difference in the mean number of medications was seen between treatment groups after 5 years of follow-up when patients who underwent additional glaucoma surgery were included in the analysis. The mean number of medications was 1.4 ± 1.3 in the tube group and 1.2 ± 1.4 in the trabeculectomy group at 5 years in an intent-to-treat analysis ( P = .25, Student t test).
Treatment Outcomes
Table 3 presents the outcomes of randomized patients, unadjusted for follow-up time. All patients who completed 5-year follow-up visits and/or had a prior failure were included in this analysis. A significantly higher failure rate was seen in the trabeculectomy group than in the tube group after 5 years. Treatment failure had occurred in 24 patients (33%) in the tube group and 42 patients (50%) in the trabeculectomy group at 5 years ( P = .034, χ 2 test adjusted for stratum). In the tube group, 18 patients (25%) were classified as complete successes and 31 patients (42%) were qualified successes. In the trabeculectomy group, 24 patients (29%) were complete successes and 18 patients (21%) were qualified successes. While the tube group had a higher overall success rate after 5 years, the rate of complete success was similar between treatment groups ( P = .58, χ 2 test adjusted for stratum).
| Tube Group a (n = 73) | Trabeculectomy Group a (n = 84) | |
|---|---|---|
| Stratum 1—previous cataract extraction | ||
| Failure | 8 (26) | 23 (59) |
| Qualified success | 15 (48) | 10 (26) |
| Complete success | 8 (26) | 6 (15) |
| Stratum 2—previous trabeculectomy or combined procedure without an antifibrotic agent | ||
| Failure | 8 (47) | 8 (47) |
| Qualified success | 6 (35) | 1 (6) |
| Complete success | 3 (18) | 8 (47) |
| Stratum 3—previous trabeculectomy with 5-FU or combined procedure with 5-FU or MMC | ||
| Failure | 1 (8) | 5 (36) |
| Qualified success | 4 (33) | 3 (21) |
| Complete success | 7 (58) | 6 (43) |
| Stratum 4—previous trabeculectomy with MMC | ||
| Failure | 7 (54) | 6 (43) |
| Qualified success | 6 (46) | 4 (29) |
| Complete success | 0 | 4 (29) |
| Overall group | ||
| Failure b | 24 (33) | 42 (50) |
| Qualified success | 31 (42) | 18 (21) |
| Complete success c | 18 (25) | 24 (29) |
a Data presented as number of patients (percentage).
b P = .034 for the difference in failure rates between treatment groups (χ 2 test adjusted for stratum).
c P = .58 for the difference in complete success rates between treatment groups (χ 2 test adjusted for stratum).
Kaplan-Meier survival analysis was also used to compare failure rates between the 2 treatment groups, and the results are presented in Figure 3 . The cumulative probability of failure was 29.8% in the tube group and 46.9% in the trabeculectomy group at 5 years ( P = .002, log-rank test adjusted for stratum; hazard ratio = 2.15; 95% confidence interval = 1.30 to 3.56). No significant differences in treatment efficacy were found between strata ( P = .143, test of treatment-stratum interaction).
Figure 4 presents the failure rates for the 2 treatment groups using alternative outcome criteria. Patients with persistent hypotony, reoperation for glaucoma, or loss of light perception vision were still classified as treatment failures. However, the upper IOP limit distinguishing success from failure was changed. When inadequate IOP reduction was defined as IOP greater than 17 mm Hg or not reduced by 20% from baseline on 2 consecutive follow-up visits after 3 months, the cumulative probability of failure at 5 years was 31.8% in the tube group and 53.6% in the trabeculectomy group ( P = .002, log-rank test adjusted for stratum; hazard ratio = 2.04; 95% confidence interval = 1.29 to 3.24). When inadequate IOP reduction was defined as IOP greater than 14 mm Hg on 2 consecutive visits after 3 months, the cumulative probability of failure was 52.3% in the tube group and 71.5% in the trabeculectomy group at 5 years ( P = .017, log-rank test adjusted for stratum; hazard ratio = 1.57; 95% confidence interval = 1.09 to 2.26). Significantly higher failure rates were observed in the trabeculectomy group compared with the tube group when more stringent IOP criteria were used to define success and failure.
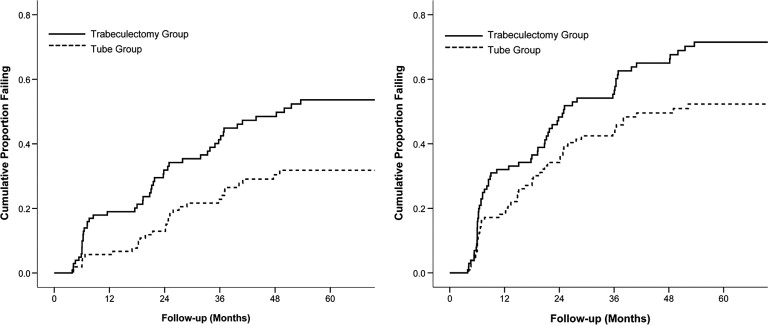
Table 4 lists the reasons for classification as a treatment failure. The most common cause for failure during 5 years of follow-up in both treatment groups was inadequate IOP reduction (IOP >21 mm Hg or not reduced by 20% below baseline on 2 consecutive follow-up visits after 3 months). There were 6 patients in the trabeculectomy group and 1 patient in the tube group who failed because of inadequate IOP reduction and subsequently underwent reoperation for glaucoma. One patient in the trabeculectomy group who failed because of persistent hypotony subsequently underwent a bleb revision for a bleb leak, and a reoperation for glaucoma was later performed when the bleb failed. Seven patients in the tube group and 11 patients in the trabeculectomy group had a reoperation for glaucoma before meeting the failure criteria for inadequate IOP reduction. Among the patients who failed because of inadequate IOP reduction or glaucoma reoperation, the number of medications (mean ± SD) at the time of failure was 2.2 ± 1.4 in the tube group and 2.4 ± 1.1 in the trabeculectomy group ( P = .54, Student t test). Persistent hypotony was the cause of treatment failure in 3 patients in the tube group and 13 patients in the trabeculectomy group. Loss of VA from baseline was seen in 13 patients in the overall group of 16 hypotony failures (81%). Despite failing because of hypotony, 2 patients in the trabeculectomy group and 1 patient in the tube group retained their preoperative level of vision throughout the 5 years of follow-up. When the 3 patients with hypotony and stable vision were reclassified as successes instead of failures, the cumulative probability of failure using survival analysis was 28.6% in the tube group and 44.4% in the trabeculectomy group at 5 years ( P = .003, log-rank test adjusted for stratum). Loss of light perception vision occurred in 1 patient in each treatment group. No significant difference in the distribution of reasons for failure was present between treatment groups ( P = .43, exact permutation χ 2 test).
| Tube Group a (n = 24) | Trabeculectomy Group a (n = 42) | |
|---|---|---|
| Inadequate IOP reduction b,c | 13 (54) | 17 (40) |
| Reoperation for glaucoma | 7 (29) | 11 (26) |
| Persistent hypotony d | 3 (13) | 13 (31) |
| Loss of light perception | 1 (4) | 1 (2) |
a Data are presented as number (percentage).
b IOP >21 mm Hg or not reduced by 20% below baseline on 2 consecutive follow-up visits after 3 months.
c Some patients underwent reoperation for glaucoma subsequent to failure because of inadequate IOP reduction.
d IOP ≤5 mm Hg on 2 consecutive follow-up visits after 3 months.
Baseline demographic and clinical features were evaluated as possible predictors for treatment failure and are shown in Table 5 . Treatment failures were pooled from both treatment groups for this risk factor analysis. Only assigned treatment was significantly associated with treatment outcome in univariate analysis ( P = .002, log-rank test). Stratum, age, sex, race, diabetes mellitus, hypertension, lens status, number of previous intraocular surgeries, time since last intraocular surgery, glaucoma type, preoperative number of medications, preoperative IOP, preoperative Snellen VA, and clinical centers were not associated with treatment failure either univariately or in a multivariate model adjusted for treatment. Separate risk factor analyses were also performed for each treatment group, and none of the baseline factors predicted failure for tube shunt surgery or trabeculectomy with MMC.
| Risk Factor | Number (%) | Cumulative Probability of Failure at 5 Years (%) b | P Value | |
|---|---|---|---|---|
| Univariate | Multivariate | |||
| Stratum a | .18 c | .18 d | ||
| 1 | 94 (44) | 39.0 | ||
| 2 | 49 (23) | 40.4 | ||
| 3 | 35 (17) | 25.1 | ||
| 4 | 34 (16) | 44.1 | ||
| Age (years) | .39 c | .39 d | ||
| <60 years | 31 (15) | 42.9 | ||
| 60–69 | 59 (28) | 44.6 | ||
| 70–79 | 79 (37) | 38.3 | ||
| ≥80 | 43 (20) | 28.6 | ||
| Sex | .47 c | .78 d | ||
| Male | 100 (47) | 42.1 | ||
| Female | 112 (53) | 34.6 | ||
| Race | .64 c | .67 d | ||
| White | 95 (45) | 35.7 | ||
| Black | 82 (39) | 40.4 | ||
| Hispanic | 30 (14) | 41.3 | ||
| Other | 5 (2) | 50.0 | ||
| Diabetes mellitus | .88 c | .76 d | ||
| Yes | 67 (32) | 35.2 | ||
| No | 145 (68) | 39.5 | ||
| Hypertension | .095 c | .073 d | ||
| Yes | 124 (59) | 31.6 | ||
| No | 88 (42) | 46.7 | ||
| Lens status | .19 c | .23 d | ||
| Phakic | 45 (21) | 47.7 | ||
| PCIOL | 160 (76) | 34.2 | ||
| ACIOL | 7 (3) | 65.7 | ||
| Previous intraocular surgery | .52 c | .43 d | ||
| 1 | 163 (77) | 38.2 | ||
| 2 | 41 (19) | 36.0 | ||
| 3 or 4 | 8 (4) | 56.3 | ||
| Time since last intraocular surgery (months) | .22 c | .35 d | ||
| <6 months | 15 (7) | 47.5 | ||
| ≥6 months | 190 (93) | 38.1 | ||
| Glaucoma type | .99 c | .76 d | ||
| Primary | 190 (90) | 37.1 | ||
| Secondary | 22 (10) | 47.5 | ||
| Preoperative number of glaucoma medications | .97 c | .97 d | ||
| 0–1 | 21 (10) | 35.7 | ||
| 2–3 | 108 (51) | 40.9 | ||
| 4–6 | 83 (39) | 35.2 | ||
| Preoperative IOP (mm Hg) | .60 c | .59 d | ||
| <23 | 77 (36) | 36.1 | ||
| 23–26 | 66 (31) | 42.8 | ||
| >26 | 69 (33) | 39.3 | ||
| Preoperative Snellen VA | .21 c | .17 d | ||
| ≥20/30 | 106 (50) | 31.6 | ||
| 20/40–20/150 | 74 (35) | 39.8 | ||
| ≤20/200 | 32 (15) | 64.4 | ||
| Clinical centers | .81 c | .95 d | ||
| Enrolled ≥50% patients | 133 (63) | 41.4 | ||
| Enrolled <50% patients | 79 (37) | 32.6 | ||
| Treatment | .002 c | – | ||
| Tube | 107 (50) | 29.8 | ||
| Trabeculectomy | 105 (50) | 46.9 | ||
a Stratum 1 = previous cataract extraction; stratum 2 = previous trabeculectomy or combined procedure without an antifibrotic agent; stratum 3 = previous trabeculectomy with 5-fluorouracil or combined procedure with 5-fluorouracil or mitomycin C; stratum 4 = previous trabeculectomy with mitomycin C.
b Kaplan-Meier survival analysis.
d Cox proportional hazard regression analysis, P value adjusted for treatment.
Reoperation for Glaucoma
Table 6 presents the reoperations that were performed for glaucoma. A higher rate of reoperation for glaucoma was observed in the trabeculectomy group compared with the tube group. The 5-year cumulative reoperation rate for glaucoma using Kaplan-Meier survival analysis was 9% in the tube group and 29% in the trabeculectomy group ( P = .025, log-rank test adjusted for stratum). A total of 18 patients in the trabeculectomy group underwent additional glaucoma surgery, which involved placement of a tube shunt in 15 patients, a bleb revision with tube shunt placement in 2 patients, and a trabeculectomy with 5-fluorouracil in 1 patient. One of the patients who received a tube shunt subsequently underwent a transscleral cyclophotocoagulation in the study eye as a second reoperation for glaucoma. In the tube group, 8 patients had glaucoma reoperations, including placement of a second tube shunt in 4 patients, transscleral cyclophotocoagulation in 3 patients, and endocyclophotocoagulation performed in conjunction with cataract surgery in 1 patient. Repeat transscleral cyclophotocoagulation was performed in the patient who had endocyclophotocoagulation.


