Purpose
To analyze the vitreoretinal interface in diabetic eyes using 3-dimensional wide-field volumes acquired using high-speed, long-wavelength swept-source optical coherence tomography (SSOCT).
Design
Prospective cross-sectional study.
Methods
Fifty-six diabetic patients (88 eyes) and 11 healthy nondiabetic controls (22 eyes) were recruited. Up to 8 SSOCT volumes were acquired for each eye. A registration algorithm removed motion artifacts and merged multiple SSOCT volumes to improve signal. Vitreous visualization was enhanced using vitreous windowing method.
Results
Of 88 diabetic eyes, 20 eyes had no retinopathy, 21 eyes had nonproliferative diabetic retinopathy (NPDR) without macular edema, 20 eyes had proliferative diabetic retinopathy (PDR) without macular edema, and 27 eyes had diabetic macular edema (DME) with either NPDR or PDR. Thick posterior hyaloid relative to healthy nondiabetic controls was observed in 0 of 20 (0%) diabetic eyes without retinopathy, 4 of 21 (19%) eyes with NPDR, 11 of 20 (55%) eyes with PDR, and 11 of 27 (41%) eyes with DME ( P = .0001). Vitreoschisis was observed in 6 of 22 (27%) healthy nondiabetic eyes, 9 of 20 (45%) diabetic eyes without retinopathy, 10 of 21 (48%) eyes with NPDR, 13 of 20 (65%) eyes with PDR, and 17 of 27 (63%) eyes with DME ( P = .007). While no healthy nondiabetic controls and diabetic eyes without retinopathy had adhesions/pegs between detached posterior hyaloid and retina, 1 of 21 (4%), 11 of 20 (55%), and 11 of 27 (41%) eyes with NPDR, PDR, and DME, respectively, demonstrated this feature ( P = .0001).
Conclusion
SSOCT with motion-correction and vitreous windowing provides wide-field 3-dimensional information of vitreoretinal interface in diabetic eyes. This may be useful in assessing progression of retinopathy, planning diabetic vitreous surgery, and predicting treatment outcomes.
The vitreous body is the largest structure in the human eye and occupies the space behind the lens and in front of the retina. In its normal state, the vitreous firmly adheres to the vitreous base, optic disc, and macula at birth. As the eye ages, a complex series of events causes the posterior vitreous cortex (hyaloid) to detach from the inner retinal surface. This occurrence is termed posterior vitreous detachment (PVD) and is a normal aging process. In some eyes, there may be an incomplete or defective separation of the posterior hyaloid from the inner retina leading to an anomalous PVD. Such an occurrence may result in the pathologic manifestations of the disorders of the vitreomacular interface. Retinal pathologies such as diabetic retinopathy, diabetic macular edema, age-related macular degeneration, and retinal vascular occlusions may be concurrently associated with abnormalities of the vitreomacular interface.
Diabetic retinopathy is the most common cause of new-onset visual impairment in working-age adults in the United States. It is typically classified as either nonproliferative diabetic retinopathy (NPDR) or proliferative diabetic retinopathy (PDR). Either one can have diabetic macular edema (DME). The pathogenesis and progression of diabetic retinopathy involves changes in the vitreous structure. However, because the vitreous is transparent, it is often difficult to reliably image the vitreous and the vitreoretinal interface. Since optical coherence tomography (OCT) was introduced as a noninvasive optical imaging modality for diagnosis of various retinal diseases, it has become a standard imaging modality in ophthalmic practice. With the advancement of OCT technology from time-domain to spectral-domain OCT (SDOCT), improved in vivo visualization of the posterior vitreous and vitreoretinal interface has become possible through improved axial resolution, higher imaging speed, and improved signal-to-noise ratio. Recent SDOCT studies have analyzed the vitreoretinal interface in diabetic macular edema and described features such as incomplete PVD, vitreomacular traction, and epiretinal membranes.
Of late, the introduction of swept-source OCT (SSOCT) technology has enabled higher image acquisition speed, wider imaging field, and lower sensitivity roll-off vs depth compared to SDOCT technology. Using SSOCT, recent studies demonstrated an ability to better visualize the posterior vitreous and vitreoretinal interface in healthy eyes and determined the prevalence and described the dimensions and shapes of the bursa premacularis and area of Martegiani. A more detailed 3-dimensional analysis of the posterior vitreous and vitreoretinal interface using volumetric SSOCT with a high A-scan density acquired over a wide field of the retina covering the fovea and the optic nerve head regions was recently demonstrated by Liu and associates. In that study, a vitreous windowing method was employed to enhance the details of the vitreous, and various features of the posterior vitreous and vitreoretinal interface in young healthy eyes were described. Another recent SSOCT study examined the vitreoretinal interface in 4 patients with PDR and described features such as neovascularization and vitreoschisis. That report was limited to a small number of patients, a study of only the proliferative stage of diabetic retinopathy, and the use of single B-scan imaging protocols on SSOCT.
Given that the vitreous plays an important role in the pathogenesis of diabetic retinopathy, the present study aims to perform an in vivo 3-dimensional analysis of the features of the posterior vitreous and vitreoretinal interface in diabetic eyes either without clinical evidence of retinopathy or with different stages of retinopathy, in comparison to age-matched healthy nondiabetic control eyes. It uses a vitreous windowing method to enhance visualization of the posterior vitreous and the vitreoretinal interface applied to 3-dimensional wide-field volumetric SSOCT covering the fovea and optic nerve head regions obtained using a high-speed, long-wavelength SSOCT prototype.
Methods
Subjects
Fifty-six patients with diabetes (88 eyes) with or without clinically visible diabetic retinopathy and 11 healthy nondiabetic controls (22 eyes) were prospectively recruited at the New England Eye Center, Tufts Medical Center (Boston, Massachusetts, USA) between September 1, 2012 and June 30, 2014, for imaging on a prototype SSOCT system. This system was developed at Massachusetts Institute of Technology (Cambridge, Massachusetts, USA) and deployed at the New England Eye Center (Boston, Massachusetts, USA). The healthy nondiabetic controls had a best-corrected visual acuity of 20/20 or better and underwent fundus examination to exclude any existing retinal or choroidal pathology. The diabetic patients had a best-corrected visual acuity of 20/200 or better and underwent complete ophthalmic examination including dilated fundus examination on slit-lamp biomicroscopy, fundus photography, OCT imaging on commercially available SDOCT (Carl Zeiss Meditec Inc, Dublin, California, USA; software version 6.0), and, in certain cases, fluorescein angiography. All subjects with a myopic refractive error of greater than 6 diopters were excluded. Diabetic patients with concomitant posterior segment pathologies such as age-related macular degeneration, central serous chorioretinopathy, prior vitrectomy, retinal detachment, and history of hypertension were also excluded.
Based on clinical assessment, the diabetic patients were characterized into 4 groups: (1) diabetes without retinopathy (20 eyes), (2) NPDR without macular edema (21 eyes), (3) PDR without macular edema (20 eyes), and (4) DME (27 eyes) with either NPDR (22 of 27 eyes) or PDR (5 of 27 eyes). A chart review was performed to determine if the eyes in the NPDR and PDR groups had any prior history of macular edema. Details of prior treatment with panretinal photocoagulation, focal laser, and/or anti–vascular endothelial growth factor (anti-VEGF) agents were also obtained from the charts ( Table 1 ).
| Healthy Subjects | No Diabetic Retinopathy | NPDR | PDR | DME | |
|---|---|---|---|---|---|
| Number of patients (eyes) | 11 (22) | 10 (20) | 13 (21) | 14 (20) | 19 (27) |
| Age, y (range) | 54 (48–62) | 58 (49–66) | 59 (45–65) | 56 (44–69) | 58 (42–71) |
| Mean myopic refractive error (range) | 1.25 (1.00–1.50) | 1.00 (0.50–1.50) | 1.50 (1.00–2.00) | 1.50 (0.75–2.25) | 1.50 (0.50–2.50) |
| Sex | Male: 4 (36%) Female: 7 (64%) | Male: 6 (60%) Female: 4 (40%) | Male: 7 (54%) Female: 6 (46%) | Male: 7 (50%) Female: 7 (50%) | Male: 11 (58%) Female: 8 (42%) |
| Best-corrected visual acuity | 20/20 or better | 20/20 | 20/20-20/80 | 20/20-20/200 | 20/25-20/200 |
| Prior treatment with focal laser/PRP (number of eyes) | NA | NA | 2 | 15 | 18 |
| Prior treatment with anti-VEGF agents (number of eyes) | NA | NA | NA | 6 | 21 |
This study was approved by the institutional review boards of Tufts Medical Center and the Massachusetts Institute of Technology and adhered to the Declaration of Helsinki and the Health Insurance Portability and Accountability Act. Signed written informed consent was obtained from all subjects prior to enrollment in the study.
Swept-Source Optical Coherence Tomography Imaging and Image Processing
All subjects underwent imaging using a research prototype SSOCT that employs a light source with a wavelength-sweeping laser centered at 1050 nm and yields an axial resolution of ∼6 μm in tissue, an imaging range of 3.6 mm, and an imaging speed of 100 000 A-scans/second that is ∼4 times faster than standard clinical SDOCT instruments. This prototype SSOCT has similar specifications as the Topcon Deep Range Imaging OCT-1 Atlantis SSOCT (Topcon Medical Systems, Oakland, New Jersey, USA), which was recently introduced commercially but has not yet been approved for use in the United States.
A trained operator acquired up to 8 orthogonally raster scanned 3-dimensional SSOCT volumes over a 12 mm × 12 mm (∼40 degree) region of the retina centered between the fovea and the optic nerve head with the focus manually adjusted for acquisition of better vitreous details. Each 3-dimensional SSOCT volume consists of 500 A-scans per B-scan for a total of 500 B-scans that takes less than 3 seconds to acquire. A registration algorithm was applied to at least 2 orthogonally scanned 3-dimensional SSOCT volumes to correct for motion artifacts; this motion-correction algorithm has been described previously. Following motion correction, multiple SSOCT volumes are merged into a single volume with improved signal. Arbitrary SSOCT images from a motion-corrected 3-dimensional volume can be viewed in any orthoplane or en face projection.
Each merged 3-dimensional motion-corrected SSOCT volume was then processed to enhance visualization of the posterior vitreous and vitreoretinal interface using a vitreous windowing method ( Figure 1 ). This method is analogous to computed tomography where tissues of varying physical densities can be visualized in better detail by changing contrast windows, and is performed by adjusting the threshold and contrast of the motion-corrected 3-dimensional SSOCT volume using a commercially available software algorithm (ImageJ; NIH, Bethesda, Maryland, USA).
Analysis of Features of Posterior Vitreous and Vitreoretinal Interface
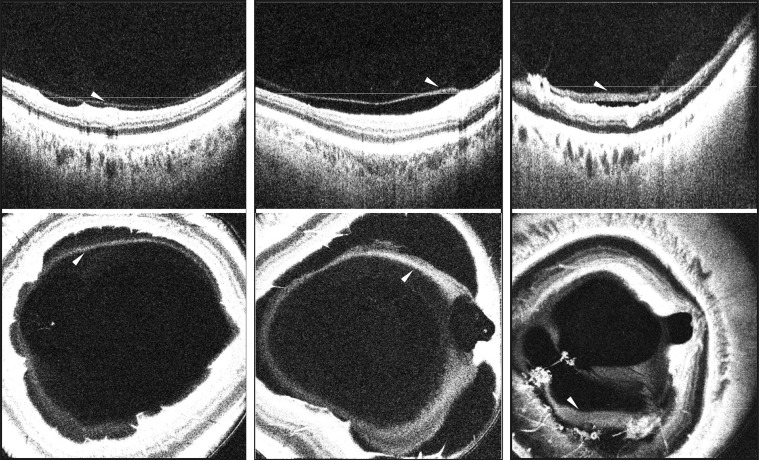
Two independent readers experienced in analyzing OCT images assessed the vitreous windowed motion-corrected 3-dimensional SSOCT volumes of each eye for features of the posterior vitreous and vitreoretinal interface. The features analyzed included: (1) bursa premacularis, (2) area of Martegiani, (3) posterior vitreous cortex (hyaloid) detachment, (4) thick posterior hyaloid, (5) vitreoschisis, (6) adhesions (pegs) between the detached posterior hyaloid and inner retinal surface, and (7) vitreous clumping ( Table 2 ). Each grader reviewed all 500 B-scans within the 3-dimensional SSOCT volume independently and noted his or her respective findings. Any disagreements between the readers were resolved by an open adjudication to make a final decision on the presence or absence of a particular feature in each eye.
| Feature Observed | % of Healthy Nondiabetic Eyes With Feature (N = 22) | % of Diabetic Eyes Without Retinopathy With Feature (N = 20) | % of Eyes With NPDR With Feature (N = 21) | % of Eyes With PDR With Feature (N = 20) | % of Eyes With DME With Feature (N = 27) | P Value |
|---|---|---|---|---|---|---|
| 1. Bursa premacularis | 17/22, 77% | 15/20, 75% | 14/21, 67% | 13/20, 65% | 17/27, 63% | .22 |
| 2. Area of Martegiani | 16/22, 73% | 14/20, 70% | 13/21, 62% | 13/20, 65% | 15/27, 56% | .09 |
| 3. Posterior vitreous cortex (hyaloid) detachment | 18/22, 82% | 17/20, 85% | 18/21, 86% | 17/20, 85% | 23/27, 85% | .18 |
| 4. Thick posterior hyaloid | NA | 0/20, 0% | 4/21, 19% | 11/20, 55% | 11/27, 41% | .0001* |
| 5. Vitreoschisis | 6/22, 27% | 9/20, 45% | 10/21, 48% | 13/20, 65% | 17/27, 63% | .007* |
| 6. Adhesions (pegs) between the detached posterior hyaloid and inner retinal surface | 0/22, 0% | 0/20, 0% | 1/21, 4% | 11/20, 55% | 11/27, 41% | .0001* |
| 7. Vitreous clumping | 11/22, 50% | 11/20, 55% | 13/21, 62% | 13/20, 65% | 18/27, 67% | .10 |
The bursa premacularis and the area of Martegiani were defined as optically clear hyporeflective spaces overlying the macula and the optic nerve head regions, respectively, as described previously. Posterior hyaloid detachment was defined as a single distinct linear hyperreflective band or a dense homogenous band separated from the inner retinal surface by an optically clear hyporeflective space. Vitreoschisis was defined as 2 distinct linear hyperreflective bands of the posterior hyaloid separated from each other by an optically clear hyporeflective space. Adhesions (pegs) between the detached posterior hyaloid and the inner retinal surface were defined as diagonal or perpendicular connections traversing the optically clear hyporeflective space between the detached posterior hyaloid and the inner retinal surface. Vitreous clumping was defined as a collection of hyperreflective aggregations either within the posterior vitreous, overlying a distinctly detached posterior hyaloid, or overlying the inner retinal surface in association with an indistinct posterior hyaloid detachment.
Quantification of Posterior Hyaloid Thickness
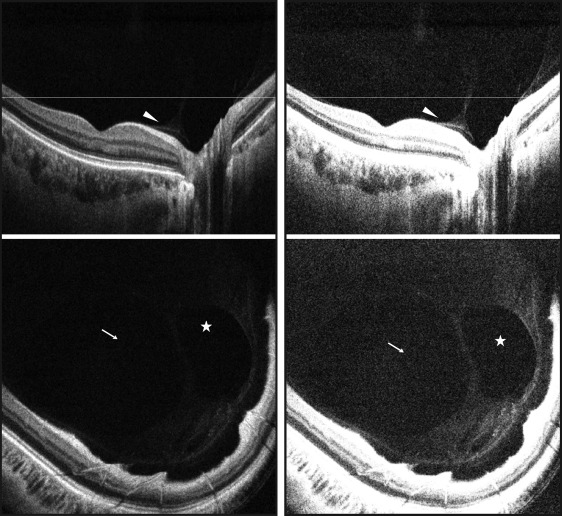
Two readers independently selected a frame (B-scan) within the vitreous windowed motion-corrected 3-dimensional SSOCT volume for each eye where the detached posterior hyaloid appeared thickest in that eye. The measurement was performed where the posterior hyaloid appeared the thickest on the selected B-scan. To be measurable, the posterior hyaloid had to be clearly detached from the inner retina and appear as either a single distinct linear hyperreflective band or a dense homogenous band separated from the inner retinal surface by an optically clear hyporeflective space ( Figure 2 ). If the posterior hyaloid was not detached throughout the SSOCT volume, it was noted as immeasurable. As the vitreous signal is inherently low, measurements of the posterior hyaloid were performed at the lowest visible signal. The vitreous window method employed in the present study helped better visualize the signal boundaries of the posterior hyaloid relative to the noise floor, thereby allowing accurate measurements. The average measurement of the 2 observers was calculated for each eye to be used for the purpose of analysis. All measurements were performed using Image J (NIH).