Purpose
To investigate the choroidal thickness in highly myopic eyes with no history of choroidal neovascularization or ocular surgery, and to correlate it with axial length, age, and spherical equivalent.
Design
Retrospective, comparative, noninterventional case series.
Methods
A total of 120 eyes of 83 patients with high myopia (spherical equivalent ≥−6 diopters or axial length ≥26 mm) and 96 eyes of 62 healthy patients were studied in a clinical setting. Eyes with prior vitreoretinal surgery or laser or anti-vascular endothelial growth factor therapy were excluded. Eyes were imaged using optical coherence tomography employing a 6-mm line, reference position “Choroid,” and image averaging 50. Choroidal thickness was manually measured from the posterior edge of the retinal pigment epithelium to the choroid-scleral junction at 500-μm intervals up to 2500 μm nasal and temporal to the fovea. Statistical analysis was performed.
Results
The high myopia group mean age was 54.4 ± 18.2 years (range, 18-99) and mean axial length was 29.17 ± 2.44 mm (range, 26.00-35.63). Mean macular choroidal thickness was 115.5 ± 85.3 μm (range, 6.9-436.0). The choroid was thickest temporally (134 μm), then subfoveally (130 μm), and was thinnest in the nasal area (68 μm). This pattern differed markedly from the control eyes. In the high myopia group, axial length had the best correlation with choroidal thickness (r = −0.740; P < .001). Choroidal thickness decreased 25.9 ± 2.1 μm for each additional millimeter.
Conclusions
Axial length is especially associated with choroidal thickness in high myopia. Choroidal thickness profile in highly myopic patients differs from that in emmetropic patients.
High myopia is one of the leading causes of low vision in the world. There is a higher prevalence in Asian countries, but it is estimated that 1% of the global population exhibits high myopia. Retinal detachment, epiretinal membrane, macular hole, choroidal neovascularization, lacquer cracks, posterior staphyloma, Fuchs spot, chorioretinal atrophy, and macular atrophy are more frequent in high myopia and are the reason for low visual acuity. Axial elongation of the globe may be one of the main causes of these ocular complications. Hayashi and associates associated increasing size of posterior staphyloma with a higher incidence of myopic maculopathy.
Axial length is a parameter that rarely changes after the growth period, around 20 years of age. In highly myopic eyes, posterior staphyloma can increase during adulthood; however, refractive spherical equivalent can change in any period because of aging of the lens, serous macular detachment, hyperglycemia, secondary to refractive surgery, glaucoma, or retinal surgery, and also after posterior staphyloma growth.
Until recently, indocyanine green angiography was the best diagnostic test for diseases involving the choroidal circulation and anatomy. The newly developed software for spectral-domain optical coherence tomography (SD OCT) has prompted a revolution in the ability to image the choroid. Since Spaide and associates described enhanced depth imaging (EDI)-OCT, the choroidal thickness in many chorioretinal diseases has been studied with this technology.
The choroid in high myopia has been demonstrated to be markedly thinner compared to normal eyes in both histologic and SD OCT studies. Choroidal thickness is different from that in normal patients in diabetic retinopathy, but not in glaucoma. Also, it is different in age-related macular degeneration, central serous chorioretinopathy, and posterior uveitis. Therefore, the purpose of this study was to compare the axial length, spherical equivalent, and age with the macular choroidal thickness in highly myopic patients without any other conditions that might complicate the natural history of high myopia.
Materials and Methods
A retrospective comparative analysis was performed on 120 eyes of 83 highly myopic patients and 96 eyes of 62 healthy patients. High myopia was defined as a spherical equivalent >−6 diopters (D) or an axial length greater than or equal to 26 mm. The patients were imaged with Topcon 3D-2000 OCT (Topcon Corporation, Tokyo, Japan) at Vissum Corporación Alicante from February 2011 to December 2011, by the same investigator (I.F.M.). The patients were imaged as part of routine clinical ophthalmic care.
In an effort to study the presentation of high myopia without complications or conditions that can change the choroidal morphology, eyes with a history of retinal detachment, scleral buckling, pars plana vitrectomy, photodynamic therapy, anti-vascular endothelial growth factor therapy, macular hole, epiretinal membrane, vitreomacular traction syndrome, foveoschisis, diabetes, any type of glaucoma, or posterior uveitis were excluded. In the control group the inclusion criterion was healthy eyes with a spherical equivalent between ± 6 D.
The scan pattern used on 3D-2000 OCT was a 6-mm line consisting of 1024 A-scans, reference position “Choroid,” and image averaging of 50. The reference position moves the zero-delay line behind the retinal pigment epithelium (RPE), which, added to the averaged images, makes for better visualization of the choroid. This pattern facilitates the visualization of deeper ocular structures, similar to the EDI mode in Heidelberg Spectralis and Zeiss Cirrus OCT systems.
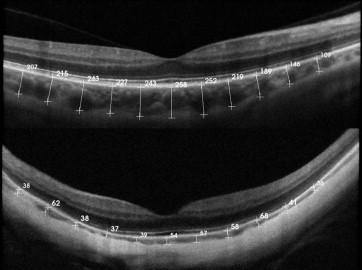
Two independent observers manually measured the choroidal thickness, using the caliper system provided by the software, perpendicularly from the outer edge of the hyperreflective RPE to the choroid-scleral junction. The image used for the measurements was the one with less retinal thickness crossing the center of the fovea, to measure equivalent meridians in each patient. Eleven measurements were taken (1 subfoveal, 5 temporal, and 5 nasal) at 500-μm intervals up to 2500 μm, also made with the caliper system ( Figure 1 ).
Statistical analysis was performed with SPSS software package version 17 (SPSS Inc, Chicago, Illinois, USA). Kolmogorov-Smirnov test was used to identify the normality of the distribution, then t test or Mann-Whitney U was performed. Pearson correlation was used to correlate choroidal thickness with age, visual acuity (VA), axial length, and spherical equivalent. One-way analysis of variance with Bonferroni post-test was used to compare mean thickness. Intraclass correlation coefficient was performed to compare interobserver measurements. Partial correlation coefficient was used as multiple regression analysis to control the effect of a third variable. Statistical significance was P < .05.
Results
The high myopia group consisted of 120 eyes of 77 women and 33 men. The control group consisted of 96 eyes 62 healthy patients. Mean ± standard deviation (SD) choroidal thickness in high myopia was 115.5 ± 85.3 μm (range, 6.9-436.0) and in controls was 257.4 ± 99.3 μm (range, 38.6-488.6). Mean ± SD age was 54.4 ± 18.2 years (range, 18-99) in high myopia and 52.6 ± 21.7 (range, 5-84) in the control group. Axial length was collected from the 120 highly myopic eyes, with an average of 29.1 ± 2.4 mm (range, 26.00-35.6); on the other side, the control group average was 23.0 ± 0.7 mm (range, 21.7-25.2). Mean ± SD spherical equivalent was -14.3 ± 5.4 D in the high myopia group and −0.3 ± 1.8 D in the control group. VA was changed to logMAR scale, with an average of 0.38 ± 0.48 and 0.043 ± 0.106 in high myopia and control groups, respectively. Choroidal thickness, axial length, spherical equivalent, and VA were statistically different in both groups ( P < .001, Mann-Whitney U test) and mean age was no different ( P = .46; Student t test) ( Table 1 ).
| High Myopia | Control | ||||||||||
|---|---|---|---|---|---|---|---|---|---|---|---|
| N | Min | Max | Mean | SD | N | Min | Max | Mean | SD | P | |
| Age, years | 120 | 18 | 99 | 54.4 | 18.2 | 96 | 5 | 84 | 52.6 | 21.7 | .46 |
| SFCT, μm | 120 | 0 | 484 | 131,3 | 98.4 | 96 | 33 | 577 | 290.3 | 120.4 | <.001 |
| Mean CT, μm | 120 | 6.9 | 436.0 | 115.5 | 85.3 | 96 | 38.6 | 488.6 | 257.4 | 99.3 | <.001 |
| AL, mm | 120 | 26.00 | 35.63 | 29.17 | 2.43 | 96 | 21.70 | 25.24 | 23.07 | 0.78 | <.001 |
| SE (diopters) | 120 | −6 | −26 | −14.34 | 5.46 | 96 | −5.25 | 6.00 | −0.33 | 1.81 | <.001 |
| VA (logMAR) | 120 | 0 (20/20) | −1,5 (20/800) | 0.38 | 0.48 | 96 | 0 (20/20) | −0.5 (20/63) | 0.43 | 0.106 | <.001 |
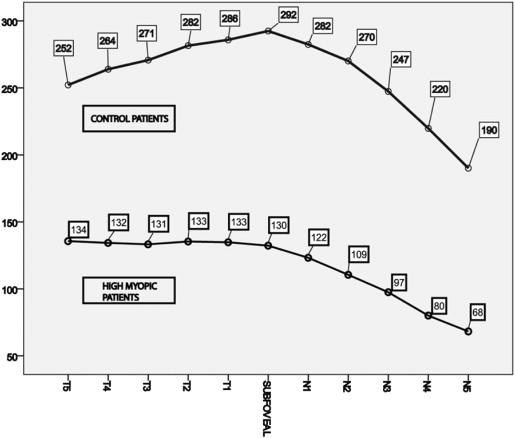
As shown in Figure 2 , the thickest choroid in highly myopic eyes is temporal (134 μm), then subfoveal (130 μm), and decreasing at each location further nasal toward the optic nerve. In control (normal) eyes, subfoveal choroidal thickness was universally the maximum (292 μm). In both the highly myopic and control groups, the nasal area had the thinnest choroidal thickness (68 μm and 190 μm, respectively).
Simple regression analysis showed a negative correlation between choroidal thickness and age in both groups (r = −0.423; P < .001 for highly myopic eyes and r = −0.572; P < .001 in control eyes), with a decrease of 1.9 μm and 2.6 μm each year, in high myopia and control groups, respectively. The decrease in thickness in the myopic eyes was statistically different than in controls. Axial length was not related statistically to choroidal thickness in the control group ( P = .718), although in high myopia it carried the strongest negative correlation (r = −0.740; P < .001). These data show that for each millimeter of axial length, choroidal thickness decreased by 25.91 μm in the eyes with underlying high myopia. Spherical equivalent and choroidal thickness were significantly correlated only in high myopia (r = −0.608; P < .001), with a decrease of 9.39 μm for each myopic D. VA showed a good correlation with subfoveal choroidal thickness (r = −0.503; P < .001 and r = −0.318; P < .001 in high myopia and control groups, respectively).
Multiple regression analysis shown through the partial correlation coefficient revealed that the choroidal thickness and age correlation was independent of axial length (r = −0.569; P < .001); also, choroidal thickness and axial length correlation was independent of age (r = −0.792; P < .001). We designed a predictive model for choroidal thickness depending on axial length and age, with a confidence interval for the constant of ±53.427, for the axial length of ±1.794, and for the age of ±0.24. The model is: choroidal thickness = 947.514 − 1.795 × age – 25.166 × axial length. For example, in a 43-year-old patient with 29 mm of axial length, the estimated choroidal thickness should be 140.515 μm.
Interobserver correlation was 0.982 with the intraclass correlation coefficient. The choroid-scleral junction could be visualized in all the high myopia eyes and in 93.75% of controls.
Results
The high myopia group consisted of 120 eyes of 77 women and 33 men. The control group consisted of 96 eyes 62 healthy patients. Mean ± standard deviation (SD) choroidal thickness in high myopia was 115.5 ± 85.3 μm (range, 6.9-436.0) and in controls was 257.4 ± 99.3 μm (range, 38.6-488.6). Mean ± SD age was 54.4 ± 18.2 years (range, 18-99) in high myopia and 52.6 ± 21.7 (range, 5-84) in the control group. Axial length was collected from the 120 highly myopic eyes, with an average of 29.1 ± 2.4 mm (range, 26.00-35.6); on the other side, the control group average was 23.0 ± 0.7 mm (range, 21.7-25.2). Mean ± SD spherical equivalent was -14.3 ± 5.4 D in the high myopia group and −0.3 ± 1.8 D in the control group. VA was changed to logMAR scale, with an average of 0.38 ± 0.48 and 0.043 ± 0.106 in high myopia and control groups, respectively. Choroidal thickness, axial length, spherical equivalent, and VA were statistically different in both groups ( P < .001, Mann-Whitney U test) and mean age was no different ( P = .46; Student t test) ( Table 1 ).


